|
|
市場調査レポート
商品コード
1597908
フローサイトメトリーの世界市場:技術別、製品別、用途別予測 - エグゼクティブコンサルタントガイド付き(2025年~2029年)Flow Cytometry Markets. Forecasts by Technology, Product and Application. With Executive and Consultant Guides. 2025 to 2029 |
||||||
|
|||||||
|
|||||||

| フローサイトメトリーの世界市場:技術別、製品別、用途別予測 - エグゼクティブコンサルタントガイド付き(2025年~2029年) |
|
出版日: 2024年11月21日
発行: Howe Sound Research
ページ情報: 英文 405 Pages
納期: 即日から翌営業日
|

全表示
- 概要
- 図表
- 目次
フローサイトメトリーは細胞を研究するための分析手法の主軸ですが、新たな免疫腫瘍学およびリキッドバイオプシー市場ががん治療競争において前例のない投資を生み出す中、その成長は現在加速しています。
その上、ゲノムに基づく新しい知識は、単一細胞の科学的探索の新世代を育成しています。この市場はとどまることなく成長を続けています。製薬業界の主力製品は、バイオテクノロジーの中心的存在になりつつあります。
当レポートは、世界のフローサイトメトリー市場について調査し、市場の概要とともに、技術別、製品別、用途別動向、および市場に参入する企業のプロファイルなどを提供しています。
目次
第1章 市場ガイド
第2章 イントロダクションと市場の定義
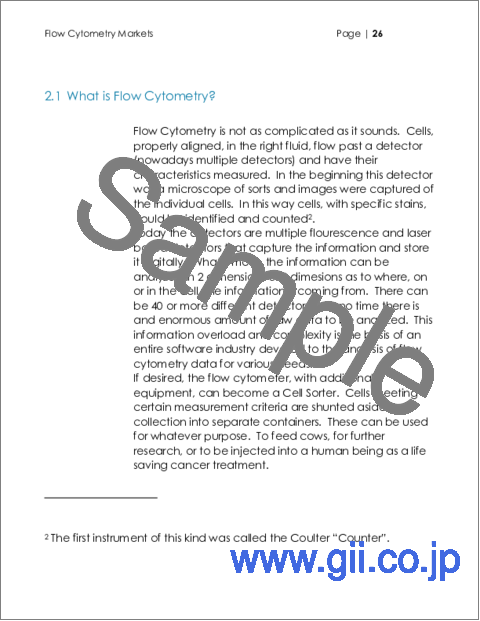
- フローサイトメトリーとは何か
- 市場の定義
- 調査手法
- 米国の医療市場と医薬品調査費- 展望
第3章 フローサイトメトリー- 技術ガイド
- フローサイトメーター
- ハードウェア
- データ分析
- 細胞選別
- ラベル
- ビーズアレイ
- インピーダンスフローサイトメトリー
- フローサイトメトリーの応用
- 細胞生存率アッセイ
- 細胞増殖アッセイ
- 細胞毒性アッセイ
- 細胞老化アッセイ
- アポトーシス
- オートファジー
- 壊死
- 酸化ストレス
- シグナル伝達経路、GPCR
- 免疫調節と抑制
- レポーター遺伝子技術
第4章 業界の概要
- 市場参入機関
- 学術研究機関
- CRO
- ゲノム機器サプライヤー
- 細胞分離および観察サプライヤー
- 細胞株および試薬サプライヤー
- 製薬会社
- 監査機関
- 認証機関
第5章 市場動向
- 成長促進要因
- 成長抑制要因
- 技術開発
第6章 フローサイトメトリーの最近の動向
第7章 主要企業のプロファイル
- Agilent/Dako
- Amphasys
- Apogee Flow Systems
- Applied Cytometry
- Astrolabe Diagnostics
- Beckman Coulter Diagnostics
- Becton, Dickinson and Company
- BennuBio
- bioMerieux Diagnostics
- Bio-Rad Laboratories, Inc.
- Cytek Biosciences
- Cytognos
- Cytonome
- De Novo Software
- Gemini Bio
- Kinetic River
- Logos Biosystems
- Luminex Corp(DiaSorin)
- Miltenyi Biotec
- Molecular Devices
- Nanion
- NanoCellect Biotechnology
- Omiq
- On-Chip Biotechnologies
- Partek
- Sartorius
- SBT Instruments
- Singleron Biotechnologies
- Sony Biotechnology
- Standard BioTools
- Stratedigm
- Sysmex
- Sysmex Partec
- Tecan
- Tercen Data
- Thermo Fisher Scientific Inc.
- TissueGnostics
- Union Biometrica
- Verity Software House
- Yokogawa Fluid Imaging Technologies
第8章 世界フローサイトメトリー市場の概要
- 世界市場概要、国別
- 世界市場概要、製品別
- 世界市場概要、用途別
- 世界市場概要、技術別
第9章 製品別世界市場
- 試薬
- 機器
- サービス
- ソフトウェア
第10章 用途別世界市場
- 研究
- 臨床
- 産業
- その他
第11章 技術別世界市場
- ジェル
- ビーズ
第12章 付録
Table of Tables
- Table 1: Some Characterics Measured by Flow Cytometry
- Table 2: Some Common Viability Assays
- Table 3: Oxidative Stress Related Diseases
- Table 4: Important Signalling Pathways
- Table 5: Market Players by Type
- Table 6: Four Factors Driving Growth
- Table 7: Three Factors Limiting Growth
- Table 8: Global Market by Country/Region
- Table 9: Global Market by Product
- Table 10: Global Market by Application
- Table 11: Global Market by Technology
- Table 12: Reagent Market by Country
- Table 13: Instrument Market by Country
- Table 14: Services Market by Country
- Table 15: Software Market by Country
- Table 16: Research Market by Country
- Table 17: Clinical Market by Country
- Table 18: Industrial Market by Country
- Table 19: Other Application Market by Country
- Table 20: Gel Market by Country
- Table 21: Bead Market by Country
- Table 22: Clinical Lab Fee Schedule
Table of Figures
- Figure 1: Pharmaceutical Research Expenditures ($Billion)
- Figure 2: Oxidative Stress and Free Radical Toxicity
- Figure 3: FDA Cancer Drug Approvals
- Figure 4: Immunotherapy vs Traditional
- Figure 5: Growth rates of Flow Cytometry by Product Class
- Figure 6: Market Size by Country
- Figure 7: Global Market by Product - Base vs. Final Year
- Figure 8: Product Market Base Year
- Figure 9: Product Market Final Year
- Figure 10: Product Share by Year
- Figure 11: Product Segment Growth
- Figure 12: Global Market by Application - Base vs. Final Year
- Figure 13: Application Market Base Year
- Figure 14: Application Market Final Year
- Figure 15: Application Share by Year
- Figure 16: Application Segment Growth
- Figure 17: Global Market by Technology - Base vs. Final Year
- Figure 18: Technology Market Base Year
- Figure 19: Technology Market Final Year
- Figure 20: Technology Share by Year
- Figure 21: Technology Segment Growth
- Figure 22: Chart - Reagent Market Growth
- Figure 23: Chart Instrument Market Growth
- Figure 24: Chart - Services Market Growth
- Figure 25: Chart - Software Market Growth
- Figure 26: Chart - Research Market Growth
- Figure 27: Chart Clinical Market Growth
- Figure 28: Chart - Industrial Market Growth
- Figure 29: Chart - Other Application Market Growth
- Figure 30: Chart - Gel Market Growth
- Figure 31: Chart Bead Market Growth
- Figure 32: FDA Cancer Drug Approvals by Year
- Figure 33: Clinical Trials for Immunotherapy by Year
- Figure 34: Share of Pharma R&D by Country
Report Overview:
Flow Cytometry is a mainstay of analytical methods to study cells, but growth is now accelerating as new immuno-oncology and liquid biopsy markets create unprecedented investment in the race to cure cancer. Research vs. Clinical, Bead vs. Gel, its all here in this comprehensive report.
On top of this new genome based knowledge is fostering a new generation of scientific exploration of single cells. This market just keeps on growing with no end in sight. The workhorse of the pharmaceutical industry is becoming a central player in biotechnology.
This is a complex area but this readable report will bring the entire management team up to speed, on both the technology and the opportunity.
The technology is moving faster than the market. Find the opportunities and the pitfalls. Understand growth expectations and the ultimate potential market size.
Table of Contents
1. Market Guides
- 1.1. Situation Analysis
- 1.2. Guide for Executives and Marketing Staff
- 1.3. Guide for Investment Analysts and Management Consultants
2. Introduction and Market Definition
- 2.1. What is Flow Cytometry?
- 2.1.1. Cell Sorting
- 2.1.2. Academic Use
- 2.2. Market Definition
- 2.2.1. Market Size.
- 2.2.2. Currency.
- 2.2.3. Years.
- 2.3. Methodology
- 2.3.1. Methodology
- 2.3.2. Sources
- 2.3.3. Authors
- 2.4. U.S. Medical Market and Pharmceutical Research Spending - Perspective
- 2.4.1. U.S. Expenditures for Pharmaceutical Research
3. Flow Cytometry - Guide to Technology
- 3.1. Flow Cytometers
- 3.2. Hardware
- 3.2.1. Fluidics
- 3.2.1.1. Hydrodynamic Focusing
- 3.2.1.2. Acoustic Focusing
- 3.2.2. Optics and electronics
- 3.2.2.1. Optical filters
- 3.2.2.2. Prisms, gratings, and spectral flow cytometry
- 3.2.2.3. Imaging flow cytometry
- 3.2.1. Fluidics
- 3.3. Data analysis
- 3.3.1. Compensation
- 3.3.2. Gating
- 3.3.3. Computational analysis
- 3.3.4. FMO controls
- 3.4. Cell Sorting
- 3.5. Labels
- 3.5.1. Fluorescent labels
- 3.5.2. Quantum dots
- 3.5.3. Isotope labeling
- 3.6. Bead Array
- 3.7. Impedance flow cytometry
- 3.8. Flow Cytometry Applications
- 3.9. Cell Viability Assays
- 3.10. Cell Proliferation Assays
- 3.11. Cytotoxicity Assays
- 3.12. Cell Senescence Assays
- 3.13. Apoptosis
- 3.14. Autophagy
- 3.15. Necrosis
- 3.16. Oxidative Stress
- 3.17. Signalling Pathways, GPCR
- 3.18. Immune Regulation & Inhibition
- 3.19. Reporter Gene Technology
4. Industry Overview
- 4.1. Players in a Dynamic Market
- 4.1.1. Academic Research Lab
- 4.1.2. Contract Research Organization
- 4.1.3. Genomic Instrumentation Supplier
- 4.1.4. Cell Separation and Viewing Supplier
- 4.1.5. Cell Line and Reagent Supplier
- 4.1.6. Pharmaceutical Company
- 4.1.7. Audit Body
- 4.1.8. Certification Body
5. Market Trends
- 5.1. Factors Driving Growth
- 5.1.1. The Move to Cell Based Analytics
- 5.1.2. Immuno-oncology
- 5.1.3. Genomic Blizzard
- 5.1.4. Technology Convergence
- 5.2. Factors Limiting Growth
- 5.2.1. Genomic Technology Competition
- 5.2.2. Instrument Integration
- 5.2.3. Maturity
- 5.3. Technology Development
- 5.3.1. Software
- 5.3.2. Instrument Size
- 5.3.3. Larger Panels
- 5.3.4. The Next Five Years
6. Flow Cytometry Recent Developments
- 6.1. Recent Developments - Importance and How to Use This Section
- 6.1.1. Importance of These Developments
- 6.1.2. How to Use This Section
- 6.2. CyPath-R Lung Cancer Test Supports Flow Cytometry Guidelines
- 6.3. Flow Cytometry Usedto Study MRD
- 6.4. Light-field flow cytometry for multiparametric 3D single-cell analysis
- 6.5. Virax Biolabs Partners for Long COVID Study
- 6.6. Agilent Aims for Early-Stage CDx Development Deals
- 6.7. Navigate BioPharma Services To Collaborate with BD
- 6.8. bioAffinity Technologies Acquires Assets of Precision Pathology Services
- 6.9. Bio-Rad enhances flow cytometry capabilities
- 6.10. BD Launches New Robotic System
- 6.11. Hybrid Flow Cytometer
- 6.12. BD and A*STAR collaborate
- 6.13. Cytek Biosciences to Acquire Flow Cytometry Business
- 6.14. METAFORA Launches a Digital Cytometry Analysis Platform
- 6.15. In Vitro Potency Assays Utilize Flow Cytometry
- 6.16. Celerion to Offer Molecular and Cell Biology Testing
- 6.17. Beckman Coulter launches Cytobank v10 Platform
- 6.18. NASA Deploys Flow Cytometer in Space
- 6.19. BD, Labcorp to Develop Flow Cytometry-Based Companion Diagnostics
- 6.20. Slingshot Biosciences Partners With Cambridge Bioscience to Distribute Synthetic Cells
- 6.21. Canopy Bio Targeting High-Throughput Spatial Proteomics
- 6.22. Becton Dickinson Advancing Rapid Image-Based Cell Sorting Tech
- 6.23. Insightful Science Acquires Data Science Company Omiq
- 6.24. Single-Cell Startup Nodexus Raises $30M
- 6.25. Bio-Rad Laboratories StarBright UltraViolet 400 Dye for Flow Cytometry
- 6.26. Cytek Biosciences Acquires Cell Analysis Business of Tonbo Biosciences
- 6.27. Becton Dickinson FACSymphony A5 SE Cell Analyzer
- 6.28. Biotium ExoBrite EV Membrane Staining Kits
- 6.29. Cytek Biosciences Prices $200M Initial Public Offering
- 6.30. Invivoscribe 12-Color Flow Cytometry Service
- 6.31. Beckman Coulter launches CytoFLEX SRT benchtop cell sorter
- 6.32. Thermo Fisher Acquires Cell Sorting Technology From Propel Labs
- 6.33. Thermo Fisher Acquires Programmable Dye Platform Pioneer Phitonex
- 6.34. NGS Bests Flow Cytometry for MRD-Based Prediction
- 6.35. Bio-Rad Launches New StarBright Dyes
- 6.36. Cytek Biosciences Closes $120M Financing Round
- 6.37. Cellular Analytics Detects Early Mesothelioma Using Liquid Biopsy
- 6.38. Cytek Biosciences Gets CE Mark for Flow Cytometer
- 6.39. Aigenpulse launches suite to automate flow cytometry
- 6.40. Sysmex Partec to Distribute De Novo Flow Cytometry Software
7. Profiles of Key Flow Cytometry Companies
- 7.1. Agilent/Dako
- 7.2. Amphasys
- 7.3. Apogee Flow Systems
- 7.4. Applied Cytometry
- 7.5. Astrolabe Diagnostics
- 7.6. Beckman Coulter Diagnostics
- 7.7. Becton, Dickinson and Company
- 7.8. BennuBio
- 7.9. bioMerieux Diagnostics
- 7.10. Bio-Rad Laboratories, Inc.
- 7.11. Cytek Biosciences
- 7.12. Cytognos
- 7.13. Cytonome
- 7.14. De Novo Software
- 7.15. Gemini Bio
- 7.16. Kinetic River
- 7.17. Logos Biosystems
- 7.18. Luminex Corp (DiaSorin)
- 7.19. Miltenyi Biotec
- 7.20. Molecular Devices
- 7.21. Nanion
- 7.22. NanoCellect Biotechnology
- 7.23. Omiq
- 7.24. On-Chip Biotechnologies
- 7.25. Partek
- 7.26. Sartorius
- 7.27. SBT Instruments
- 7.28. Singleron Biotechnologies
- 7.29. Sony Biotechnology
- 7.30. Standard BioTools
- 7.31. Stratedigm
- 7.32. Sysmex
- 7.33. Sysmex Partec
- 7.34. Tecan
- 7.35. Tercen Data
- 7.36. Thermo Fisher Scientific Inc.
- 7.37. TissueGnostics
- 7.38. Union Biometrica
- 7.39. Verity Software House
- 7.40. Yokogawa Fluid Imaging Technologies
8. Flow Cytometry Global Market Overview
- 8.1. Global Market Overview by Country
- 8.1.1. Table - Global Market by Country
- 8.1.2. Chart - Global Market by Country
- 8.2. Global Market Size by Product - Overview
- 8.2.1. Table - Global Market by Product
- 8.2.2. Chart - Global Market by Product - Base/Final Year Comparison
- 8.2.3. Chart - Global Market by Product - Base Year
- 8.2.4. Chart - Global Market by Product - Final Year
- 8.2.5. Chart - Global Market by Product - Share by Year
- 8.2.6. Chart - Global Market by Product - Segment Growth
- 8.3. Global Market Size by Application - Overview
- 8.3.1. Table - Global Market by Application
- 8.3.2. Chart - Global Market by Application - Base/Final Year Comparison
- 8.3.3. Chart - Global Market by Application - Base Year
- 8.3.4. Chart - Global Market by Application - Final Year
- 8.3.5. Chart - Global Market by Application - Share by Year
- 8.3.6. Chart - Global Market by Application - Segment Growth
- 8.4. Global Market Size by Technology - Overview
- 8.4.1. Table - Global Market by Technology
- 8.4.2. Chart - Global Market by Technology - Base/Final Year Comparison
- 8.4.3. Chart - Global Market by Technology - Base Year
- 8.4.4. Chart - Global Market by Technology - Final Year
- 8.4.5. Chart - Global Market by Technology - Share by Year
- 8.4.6. Chart - Global Market by Technology - Segment Growth
9. Global Market by Product
- 9.1. Reagent Market
- 9.1.1. Table - Reagent Market by Country
- 9.1.2. Chart - Reagent Market Segment Growth
- 9.2. Instrument Market
- 9.2.1. Table - Instrument Market by Country
- 9.2.2. Chart - Instrument Market Segment Growth
- 9.3. Services Market
- 9.3.1. Table - Services Market by Country
- 9.3.2. Chart - Services Market Segment Growth
- 9.4. Software Market
- 9.4.1. Table - Software Market by Country
- 9.4.2. Chart - Software Market Segment Growth
10. Global Market by Application
- 10.1. Research Market
- 10.1.1. Table - Research Market by Country
- 10.1.2. Chart - Research Market Segment Growth
- 10.2. Clinical Market
- 10.2.1. Table - Clinical Market by Country
- 10.2.2. Chart - Clinical Market Segment Growth
- 10.3. Industrial Market
- 10.3.1. Table - Industrial Market by Country
- 10.3.2. Chart - Industrial Market Segment Growth
- 10.4. Other Application Market
- 10.4.1. Table - Other Application Market by Country
- 10.4.2. Chart - Other Application Market Segment Growth
11. Global Market by Technology
- 11.1. Gel Market
- 11.1.1. Table - Gel Market by Country
- 11.1.2. Chart - Gel Market Segment Growth
- 11.2. Bead Market
- 11.2.1. Table - Bead Market by Country
- 11.2.2. Chart - Bead Market Segment Growth
12. Appendices
- 12.1. United States Medicare System: Clinical Laboratory Fees Schedule
- 12.2. FDA Cancer Drug Approvals by Year
- 12.3. Clinical Trials Started 2010 to 2016
- 12.4. Share of Pharma R&D by Country

