|
|
市場調査レポート
商品コード
1376008
審美歯科の市場規模、シェア、動向分析レポート:製品別、地域別、セグメント予測、2023年~2030年Cosmetic Dentistry Market Size, Share & Trends Analysis Report By Product (Dental Systems & Equipment, Dental Implants, Dental Crowns & Bridges), By Region (North America, Europe), And Segment Forecasts, 2023 - 2030 |
||||||
|
|
|||||||
カスタマイズ可能
|
|||||||

| 審美歯科の市場規模、シェア、動向分析レポート:製品別、地域別、セグメント予測、2023年~2030年 |
|
出版日: 2023年10月25日
発行: Grand View Research
ページ情報: 英文 100 Pages
納期: 2~10営業日
|

全表示
- 概要
- 図表
- 目次
審美歯科市場の成長と動向:
Grand View Research, Inc.の最新レポートによると、世界の審美歯科市場規模は2030年までに890億3,000万米ドルに達する見込みです。
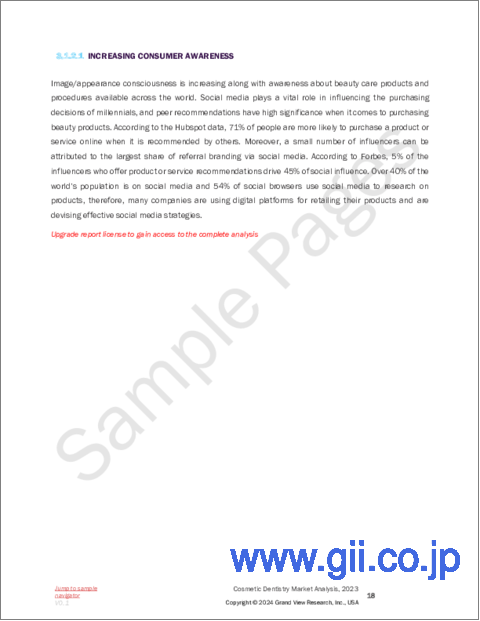
2023年から2030年までのCAGRは13.50%で拡大する見込みです。歯科疾患の増加に伴い、歯科衛生と歯科審美の維持に関する人々の意識の高まりが市場成長の要因となっています。
英国審美歯科学会によると、英国人口の約4分の1が審美歯科処置を受けています。NCBIによると、口腔の健康とは、口腔の病気や機能障害がないことだけではなく、対象者の社会生活や歯の外観に影響を与えることです。2018年に英国で実施された調査によると、自尊心、生活満足度、自己に関連する身体的魅力などの動機づけ要因により、審美的な処置を選ぶ女性が増えており、これらの女性には1つの共通点があった-メディアへの露出度が高いということです。ここ数年で、修復材料は著しく進歩しました。グラスアイオノマーとコンポジットレジンを組み合わせ、材料の強度を損なうことなく審美性を高めたハイブリッド材料には、有益な特徴があります。
当初、COVID-19の短期的な影響として、世界の審美歯科業界は妨げられました。ほとんどの歯科医院が患者の予約や入院を中止し、緊急治療のみが許可されました。その結果、患者の来院数が減少し、収益に大きな影響を与えました。NHS登録歯科診療所での定期検診は1,900万件減少したと報告されています。しかし、遠隔診療は患者と医師の双方にとって効果的なコミュニケーション手段となっています。その反面、オーストラリアのような国では、Zoomに費やす時間が長くなったため、審美歯科への関心が高まり、業界の前途に明るい兆しが見えてきました。
審美歯科市場レポートハイライト
- 北米が市場を独占し、2022年には40.0%の最大売上シェアを占めました。これは、技術の進歩と審美歯科に関わる処置を選択する個人の増加に起因します。
- アジア太平洋は、診療所数の増加、デンタルツーリズムの増加、製造における研究開発の増加、口腔ケアに関する意識の高まりにより、2023年から2030年にかけてCAGR 13.8%で成長すると予測されています。
- 製品タイプ別では、歯科用システム・機器分野が2022年に33.8%と最大の売上シェアを占めました。これは、歯科業界における幅広い用途に起因しています。
- 矯正用ブレースセグメントは、予測期間中に28.7%のCAGRで最速の成長が見込まれています。
- 市場は大手企業の存在により競争が激しいです。企業合併・買収 (M&A)、提携、製品発売など、企業が実施する様々な戦略的イニシアティブが市場の成長に大きく貢献しています。
目次
第1章 調査手法と範囲
第2章 エグゼクティブサマリー
第3章 審美歯科市場の変数、動向、範囲
- 市場系統の見通し
- 親市場の見通し
- 関連/付随市場の見通し
- 普及と成長の見通しマッピング
- 業界のバリューチェーン分析
- 償還の枠組み
- 市場力学
- 市場促進要因分析
- 市場抑制要因分析
- 審美歯科市場分析ツール
- 業界分析- ポーターのファイブフォース分析
- PESTEL分析
第4章 審美歯科:製品の推定・動向分析
- 審美歯科市場:重要なポイント
- 審美歯科市場:動向と市場シェア分析、2022年と2030年
- 歯科用システム・機器
- インスツルメントデリバリーシステム
- 歯科用チェア
- 歯科用ヘッドピース
- 光硬化装置
- 歯科用スケーリングユニット
- 歯科用CAM/CADシステム
- 歯科用レーザー
- 歯科用放射線装置
- 歯科用インプラント
- 歯科用クラウン・ブリッジ
- 歯科用ベニア
- 矯正用ブレース
- 結合剤
- インレー・アンレー
- ホワイトニング
第5章 審美歯科市場:地域の推定・動向分析
- 地域の見通し
- 地域別の審美歯科市場:重要なポイント
- 北米
- 欧州
- アジア太平洋地域
- ラテンアメリカ
- 中東・アフリカ
第6章 競合情勢
- 主要市場参入企業による最近の動向と影響分析
- 市場参入企業の分類
- Danaher Corporation
- Align Technology Inc.
- Dentsply International , Inc.
- 3M Company
- Zimmer Biomet Holding , Inc.
- Institut Straumann AG
- Sirona Dental Systems, Inc.
- Biolase, Inc.
- Planmeca Oy
- A-dec Inc.
List of Tables
- Table 1 List of Abbreviation
- Table 2 North America cosmetic dentistry market, by product, 2018 - 2030 (USD Million)
- Table 3 North America cosmetic dentistry market, by region, 2018 - 2030 (USD Million)
- Table 4 U.S. cosmetic dentistry market, by product, 2018 - 2030 (USD Million)
- Table 5 Canada cosmetic dentistry market, by product, 2018 - 2030 (USD Million)
- Table 6 Europe cosmetic dentistry market, by product, 2018 - 2030 (USD Million)
- Table 7 Europe cosmetic dentistry market, by region, 2018 - 2030 (USD Million)
- Table 8 Germany cosmetic dentistry market, by product, 2018 - 2030 (USD Million)
- Table 9 UK cosmetic dentistry market, by product, 2018 - 2030 (USD Million)
- Table 10 France cosmetic dentistry market, by product, 2018 - 2030 (USD Million)
- Table 11 Italy cosmetic dentistry market, by product, 2018 - 2030 (USD Million)
- Table 12 Spain cosmetic dentistry market, by product, 2018 - 2030 (USD Million)
- Table 13 Sweden cosmetic dentistry market, by product, 2018 - 2030 (USD Million)
- Table 14 Norway cosmetic dentistry market, by product, 2018 - 2030 (USD Million)
- Table 15 Denmark cosmetic dentistry market, by product, 2018 - 2030 (USD Million)
- Table 16 Asia Pacific cosmetic dentistry market, by product, 2018 - 2030 (USD Million)
- Table 17 Asia Pacific cosmetic dentistry market, by region, 2018 - 2030 (USD Million)
- Table 18 China cosmetic dentistry market, by product, 2018 - 2030 (USD Million)
- Table 19 Japan cosmetic dentistry market, by product, 2018 - 2030 (USD Million)
- Table 20 India cosmetic dentistry market, by product, 2018 - 2030 (USD Million)
- Table 21 Australia cosmetic dentistry market, by product, 2018 - 2030 (USD Million)
- Table 22 Thailand cosmetic dentistry market, by product, 2018 - 2030 (USD Million)
- Table 23 South Korea cosmetic dentistry market, by product, 2018 - 2030 (USD Million)
- Table 24 Latin America cosmetic dentistry market, by product, 2018 - 2030 (USD Million)
- Table 25 Latin America cosmetic dentistry market, by region, 2018 - 2030 (USD Million)
- Table 26 Brazil cosmetic dentistry market, by product, 2018 - 2030 (USD Million)
- Table 27 Mexico cosmetic dentistry market, by product, 2018 - 2030 (USD Million)
- Table 28 Argentina cosmetic dentistry market, by product, 2018 - 2030 (USD Million)
- Table 29 Middle East and Africa cosmetic dentistry market, by product, 2018 - 2030 (USD Million)
- Table 30 Middle East and Africa cosmetic dentistry market, by region, 2018 - 2030 (USD Million)
- Table 31 South Africa cosmetic dentistry market, by product, 2018 - 2030 (USD Million)
- Table 32 Saudi Arabia cosmetic dentistry market, by product, 2018 - 2030 (USD Million)
- Table 33 UAE cosmetic dentistry market, by product, 2018 - 2030 (USD Million)
- Table 34 Kuwait cosmetic dentistry market, by product, 2018 - 2030 (USD Million)
List of Figures
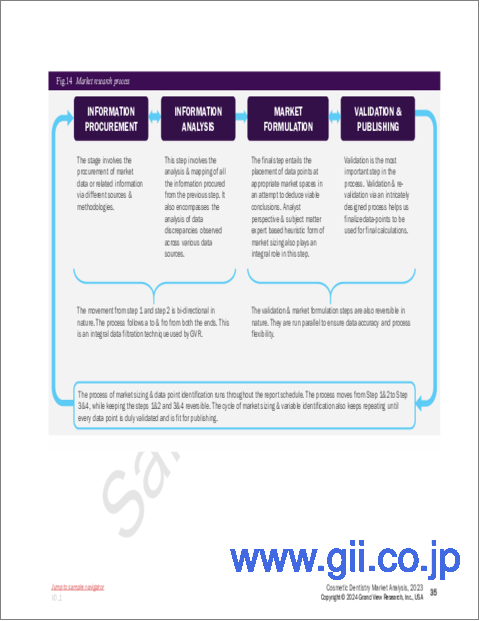
- Fig. 1 Market research process
- Fig. 2 Data triangulation techniques
- Fig. 3 Primary research pattern
- Fig. 4 Market research approaches
- Fig. 5 Value-chain-based sizing & forecasting
- Fig. 6 QFD modeling for market share assessment
- Fig. 7 Market formulation & validation
- Fig. 8 Cosmetic dentistry: market outlook
- Fig. 9 Cosmetic dentistry: competitive insights
- Fig. 10 Parent market outlook
- Fig. 11 Related/ancillary market outlook
- Fig. 12 Penetration and growth prospect mapping
- Fig. 13 Industry value chain analysis
- Fig. 14 Cosmetic dentistry market driver impact
- Fig. 15 Cosmetic dentistry market restraint impact
- Fig. 16 Cosmetic dentistry market strategic initiatives analysis
- Fig. 17 Cosmetic dentistry market: Product movement analysis
- Fig. 18 Cosmetic dentistry market: product outlook and key takeaways
- Fig. 19 Dental systems & equipment market estimates and forecasts, 2018 - 2030
- Fig. 20 Instrument delivery systems market estimates and forecasts, 2018 - 2030
- Fig. 21 Dental chairs market estimates and forecasts, 2018 - 2030
- Fig. 22 Dental handpieces market estimates and forecasts, 2018 - 2030
- Fig. 23 Light curing equipment market estimates and forecasts, 2018 - 2030
- Fig. 24 Dental scaling units market estimates and forecasts, 2018 - 2030
- Fig. 25 Dental CAM/CAD systems market estimates and forecasts, 2018 - 2030
- Fig. 26 Dental lasers market estimates and forecasts, 2018 - 2030
- Fig. 27 Dental radiology equipment market estimates and forecasts, 2018 - 2030
- Fig. 28 Dental implants market estimates and forecasts, 2018 - 2030
- Fig. 29 Dental crowns & bridges market estimates and forecasts, 2018 - 2030
- Fig. 30 Dental veneer market estimates and forecasts, 2018 - 2030
- Fig. 31 Orthodontic braces market estimates and forecasts, 2018 - 2030
- Fig. 32 Bonding agents market estimates and forecasts, 2018 - 2030
- Fig. 33 Inlays & Onlays market estimates and forecasts, 2018 - 2030
- Fig. 34 Whitening market estimates and forecasts, 2018 - 2030
- Fig. 35 Global cosmetic dentistry market: regional movement analysis
- Fig. 36 Global cosmetic dentistry market: regional outlook and key takeaways
- Fig. 37 North America market estimates and forecasts, 2018 - 2030
- Fig. 38 U.S. market estimates and forecasts, 2018 - 2030
- Fig. 39 Canada market estimates and forecasts, 2018 - 2030
- Fig. 40 Europe market estimates and forecasts, 2018 - 2030
- Fig. 41 U.K. market estimates and forecasts, 2018 - 2030
- Fig. 42 Germany market estimates and forecasts, 2018 - 2030
- Fig. 43 France market estimates and forecasts, 2018 - 2030
- Fig. 44 Italy market estimates and forecasts, 2018 - 2030
- Fig. 45 Spain market estimates and forecasts, 2018 - 2030
- Fig. 46 Sweden market estimates and forecasts, 2018 - 2030
- Fig. 47 Norway market estimates and forecasts, 2018 - 2030
- Fig. 48 Denmark market estimates and forecasts, 2018 - 2030
- Fig. 49 Asia Pacific market estimates and forecasts, 2018 - 2030
- Fig. 50 Japan market estimates and forecasts, 2018 - 2030
- Fig. 51 China market estimates and forecasts, 2018 - 2030
- Fig. 52 India market estimates and forecasts, 2018 - 2030
- Fig. 53 Australia market estimates and forecasts, 2018 - 2030
- Fig. 54 Thailand market estimates and forecasts, 2018 - 2030
- Fig. 55 South Korea market estimates and forecasts, 2018 - 2030
- Fig. 56 Latin America market estimates and forecasts, 2018 - 2030
- Fig. 57 Brazil market estimates and forecasts, 2018 - 2030
- Fig. 58 Mexico market estimates and forecasts, 2018 - 2030
- Fig. 59 Argentina market estimates and forecasts, 2018 - 2030
- Fig. 60 Middle East and Africa market estimates and forecasts, 2018 - 2030
- Fig. 61 Saudi Arabia market estimates and forecasts, 2018 - 2030
- Fig. 62 South Africa market estimates and forecasts, 2018 - 2030
- Fig. 63 UAE market estimates and forecasts, 2018 - 2030
- Fig. 64 Kuwait market estimates and forecasts, 2018 - 2030
Cosmetic Dentistry Market Growth & Trends:
The global cosmetic dentistry market size is expected to reach USD 89.03 billion by 2030, according to a new report by Grand View Research, Inc.. It is expected to expand at a CAGR of 13.50% from 2023 to 2030. With the rising cases of dental disorders, the increasing awareness among people regarding maintaining dental hygiene and dental aesthetics are responsible for the market growth.
According to the British Academy of Cosmetic Dentistry, approximately one-fourth of the U.K. population has undergone a cosmetic dental procedure. According to the NCBI, oral health is not only the absence of oral disease or any dysfunction but its influence on the subject's social life and dental appearance. As per a survey conducted in the U.K. in 2018, more women opt for aesthetic procedures due to motivational factors such as self-esteem, life satisfaction, and self-related physical attractiveness, and all these women had one similarity-they had high media exposure. Over the last few years, restorative materials have improved significantly. There are beneficial features of hybrid materials that have been created by combining glass ionomers with composites to achieve enhanced aesthetics without compromising the strength of the material.
Initially, as a short-term impact of COVID-19, the global cosmetic dentistry industry was hampered. Most of the dental clinics had stopped and discontinued patient appointments and admissions, with only emergency treatments given a permit. This resulted in a lower volume of patient visits and impacted revenue to a great extent. It was reported that there were 19 million fewer routine check-ups at NHS registered dental practices. However, telemedicine became an effective mode of communication for both patients and doctors. On the flip side, in countries such as Australia, due to the longer time spent on Zoom, interest in cosmetic dentistry has increased, highlighting some brighter days ahead for the industry.
Cosmetic Dentistry Market Report Highlights:
- North America dominated the market and accounted for the largest revenue share of 40.0% in 2022. This is attributed to technological advancements and an increase in the number of individuals opting for procedures involved in cosmetic dentistry.
- Asia Pacific is anticipated to grow at a CAGR of 13.8% from 2023 to 2030 due to the growing number of clinics, rising dental tourism, increasing R&D in manufacturing, and growing awareness about oral care.
- By product type, the dental systems and equipment segment accounted for the largest revenue share of 33.8% in 2022. This is attributed to their wide range of applications in the dental industry.
- The orthodontic braces segment is expected to grow at the fastest CAGR of 28.7% during the forecast period.
- The market is highly competitive owing to the presence of major players. The various strategic initiatives implemented by companies such as mergers, acquisitions, collaborations, and product launches are significantly contributing to the growth of the market
Table of Contents
Chapter 1. Methodology and Scope
- 1.1. Market Segmentation & Scope
- 1.1.1. Product
- 1.1.2. Regional scope
- 1.1.3. Estimates and forecast timeline
- 1.2. Research Methodology
- 1.3. Information Procurement
- 1.3.1. Purchased database
- 1.3.2. GVR's internal database
- 1.3.3. Secondary sources
- 1.3.4. Primary research
- 1.3.5. Details of primary research
- 1.4. Information or Data Analysis
- 1.5. Market Formulation & Validation
- 1.6. Model Details
- 1.7. List of Secondary Sources
- 1.8. List of Primary Sources
- 1.9. Objectives
Chapter 2. Executive Summary
- 2.1. Market Outlook
- 2.2. Segment Outlook
- 2.2.1. Product outlook
- 2.2.2. Regional outlook
- 2.3. Competitive Insights
Chapter 3. Cosmetic Dentistry Market Variables, Trends & Scope
- 3.1. Market Lineage Outlook
- 3.1.1. Parent market outlook
- 3.1.2. Related/ancillary market outlook
- 3.2. Penetration & Growth Prospect Mapping
- 3.3. Industry Value Chain Analysis
- 3.3.1. Reimbursement framework
- 3.4. Market Dynamics
- 3.4.1. Market driver analysis
- 3.4.2. Market restraint analysis
- 3.5. Cosmetic Dentistry Market Analysis Tools
- 3.5.1. Industry Analysis - Porter's
- 3.5.1.1. Supplier power
- 3.5.1.2. Buyer power
- 3.5.1.3. Substitution threat
- 3.5.1.4. Threat of new entrant
- 3.5.1.5. Competitive rivalry
- 3.5.2. PESTEL Analysis
- 3.5.2.1. Political landscape
- 3.5.2.2. Technological landscape
- 3.5.2.3. Economic landscape
- 3.5.1. Industry Analysis - Porter's
Chapter 4. Cosmetic Dentistry : Product Estimates & Trend Analysis
- 4.1. Cosmetic Dentistry Market: Key Takeaways
- 4.2. Cosmetic Dentistry Market: Movement & Market Share Analysis, 2022 & 2030
- 4.3. Dental Systems and Equipment
- 4.3.1. Instrument delivery systems
- 4.3.1.1. Market estimates and forecasts, 2018 - 2030 (USD Million)
- 4.3.2. Dental chairs
- 4.3.2.1. Market estimates and forecasts, 2018 - 2030 (USD Million)
- 4.3.3. Dental headpieces
- 4.3.3.1. Market estimates and forecasts, 2018 - 2030 (USD Million)
- 4.3.4. Light curing equipment
- 4.3.4.1. Market estimates and forecasts, 2018 - 2030 (USD Million)
- 4.3.5. Dental scaling units
- 4.3.5.1. Market estimates and forecasts, 2018 - 2030 (USD Million)
- 4.3.6. Dental CAM/CAD systems
- 4.3.6.1. Market estimates and forecasts, 2018 - 2030 (USD Million)
- 4.3.7. Dental lasers
- 4.3.7.1. Market estimates and forecasts, 2018 - 2030 (USD Million)
- 4.3.8. Dental radiology equipment
- 4.3.8.1. Market estimates and forecasts, 2018 - 2030 (USD Million)
- 4.3.1. Instrument delivery systems
- 4.4. Dental implants
- 4.4.1. Market estimates and forecasts, 2018 - 2030 (USD Million)
- 4.5. Dental crowns & bridges
- 4.5.1. Market estimates and forecasts, 2018 - 2030 (USD Million)
- 4.6. Dental veneers
- 4.6.1. Market estimates and forecasts, 2018 - 2030 (USD Million)
- 4.7. Orthodontic braces
- 4.7.1. Market estimates and forecasts, 2018 - 2030 (USD Million)
- 4.8. Bonding agents
- 4.8.1. Market estimates and forecasts, 2018 - 2030 (USD Million)
- 4.9. Inlays and onlays
- 4.9.1. Market estimates and forecasts, 2018 - 2030 (USD Million)
- 4.10. Whitening
- 4.10.1. Market estimates and forecasts, 2018 - 2030 (USD Million)
Chapter 5. Cosmetic Dentistry Market: Regional Estimates & Trend Analysis
- 5.1. Regional Outlook
- 5.2. Cosmetic Dentistry Market by Region: Key Takeaway
- 5.3. North America
- 5.3.1. Market estimates and forecasts, 2018 - 2030 (Revenue, USD Million)
- 5.3.2. U.S.
- 5.3.2.1. Market estimates and forecasts, 2018 - 2030 (Revenue, USD Million)
- 5.3.3. Canada
- 5.3.3.1. Market estimates and forecasts, 2018 - 2030 (Revenue, USD Million)
- 5.4. Europe
- 5.4.1. U.K.
- 5.4.1.1. Market estimates and forecasts, 2018 - 2030 (Revenue, USD Million)
- 5.4.2. Germany
- 5.4.2.1. Market estimates and forecasts, 2018 - 2030 (Revenue, USD Million)
- 5.4.3. France
- 5.4.3.1. Market estimates and forecasts, 2018 - 2030 (Revenue, USD Million)
- 5.4.4. Italy
- 5.4.4.1. Market estimates and forecasts, 2018 - 2030 (Revenue, USD Million)
- 5.4.5. Spain
- 5.4.5.1. Market estimates and forecasts, 2018 - 2030 (Revenue, USD Million)
- 5.4.6. Sweden
- 5.4.6.1. Market estimates and forecasts, 2018 - 2030 (Revenue, USD Million)
- 5.4.7. Norway
- 5.4.7.1. Market estimates and forecasts, 2018 - 2030 (Revenue, USD Million)
- 5.4.8. Denmark
- 5.4.8.1. Market estimates and forecasts, 2018 - 2030 (Revenue, USD Million)
- 5.4.1. U.K.
- 5.5. Asia Pacific
- 5.5.1. Japan
- 5.5.1.1. Market estimates and forecasts, 2018 - 2030 (Revenue, USD Million)
- 5.5.2. China
- 5.5.2.1. Market estimates and forecasts, 2018 - 2030 (Revenue, USD Million)
- 5.5.3. India
- 5.5.3.1. Market estimates and forecasts, 2018 - 2030 (Revenue, USD Million)
- 5.5.4. Australia
- 5.5.4.1. Market estimates and forecasts, 2018 - 2030 (Revenue, USD Million)
- 5.5.5. Thailand
- 5.5.5.1. Market estimates and forecasts, 2018 - 2030 (Revenue, USD Million)
- 5.5.6. South Korea
- 5.5.6.1. Market estimates and forecasts, 2018 - 2030 (Revenue, USD Million)
- 5.5.1. Japan
- 5.6. Latin America
- 5.6.1. Brazil
- 5.6.1.1. Market estimates and forecasts, 2018 - 2030 (Revenue, USD Million)
- 5.6.2. Mexico
- 5.6.2.1. Market estimates and forecasts, 2018 - 2030 (Revenue, USD Million)
- 5.6.3. Argentina
- 5.6.3.1. Market estimates and forecasts, 2018 - 2030 (Revenue, USD Million)
- 5.6.1. Brazil
- 5.7. MEA
- 5.7.1. Saudi Arabia
- 5.7.1.1. Market estimates and forecasts, 2018 - 2030 (Revenue, USD Million)
- 5.7.2. South Africa
- 5.7.2.1. Market estimates and forecasts, 2018 - 2030 (Revenue, USD Million)
- 5.7.3. UAE
- 5.7.3.1. Market estimates and forecasts, 2018 - 2030 (Revenue, USD Million)
- 5.7.4. Kuwait
- 5.7.4.1. Market estimates and forecasts, 2018 - 2030 (Revenue, USD Million)
- 5.7.1. Saudi Arabia
Chapter 6. Competitive Landscape
- 6.1. Recent Developments & Impact Analysis, By Key Market Participants
- 6.2. Market Participant Categorization
- 6.2.1. Danaher Corporation
- 6.2.1.1. Company overview
- 6.2.1.2. Financial performance
- 6.2.1.3. Product benchmarking
- 6.2.1.4. Strategic initiatives
- 6.2.2. Align Technology Inc.
- 6.2.2.1. Company overview
- 6.2.2.2. Financial performance
- 6.2.2.3. Product benchmarking
- 6.2.2.4. Strategic initiatives
- 6.2.3. Dentsply International , Inc.
- 6.2.3.1. Company overview
- 6.2.3.2. Financial performance
- 6.2.3.3. Product benchmarking
- 6.2.3.4. Strategic initiatives
- 6.2.4. 3M Company
- 6.2.4.1. Company overview
- 6.2.4.2. Financial performance
- 6.2.4.3. Product benchmarking
- 6.2.4.4. Strategic initiatives
- 6.2.5. Zimmer Biomet Holding , Inc.
- 6.2.5.1. Company overview
- 6.2.5.2. Financial performance
- 6.2.5.3. Product benchmarking
- 6.2.5.4. Strategic initiatives
- 6.2.6. Institut Straumann AG
- 6.2.6.1. Company overview
- 6.2.6.2. Financial performance
- 6.2.6.3. Product benchmarking
- 6.2.6.4. Strategic initiatives
- 6.2.7. Sirona Dental Systems, Inc.
- 6.2.7.1. Company overview
- 6.2.7.2. Financial performance
- 6.2.7.3. Product benchmarking
- 6.2.7.4. Strategic initiatives
- 6.2.8. Biolase, Inc.
- 6.2.8.1. Company overview
- 6.2.8.2. Financial performance
- 6.2.8.3. Product benchmarking
- 6.2.8.4. Strategic initiatives
- 6.2.9. Planmeca Oy
- 6.2.9.1. Company overview
- 6.2.9.2. Financial performance
- 6.2.9.3. Product benchmarking
- 6.2.9.4. Strategic initiatives
- 6.2.10. A-dec Inc.
- 6.2.10.1. Company overview
- 6.2.10.2. Financial performance
- 6.2.10.3. Product benchmarking
- 6.2.10.4. Strategic initiatives
- 6.2.1. Danaher Corporation

