|
|
市場調査レポート
商品コード
1114159
金属鍛造の市場規模、シェア、動向分析レポート:原材料別(炭素鋼、アルミニウム、合金鋼)、用途別(自動車、航空宇宙、石油・ガス)、地域別、セグメント別予測、2022年~2030年Metal Forging Market Size, Share & Trends Analysis Report By Raw Material (Carbon Steel, Aluminum, Alloy Steel), By Application (Automotive, Aerospace, Oil & Gas), By Region, And Segment Forecasts, 2022 - 2030 |
||||||
|
|
|||||||
|
● お客様のご希望に応じて、既存データの加工や未掲載情報(例:国別セグメント)の追加などの対応が可能です。 詳細はお問い合わせください。 |
|||||||


| 金属鍛造の市場規模、シェア、動向分析レポート:原材料別(炭素鋼、アルミニウム、合金鋼)、用途別(自動車、航空宇宙、石油・ガス)、地域別、セグメント別予測、2022年~2030年 |
|
出版日: 2022年07月12日
発行: Grand View Research
ページ情報: 英文 113 Pages
納期: 2~10営業日
|
- 全表示
- 概要
- 図表
- 目次
金属鍛造の市場成長・動向
Grand View Research, Inc.の最新レポートによると、世界の金属鍛造市場規模は2030年までに1454億4000万米ドルに達し、予測期間中にCAGR7.7%で拡大する見込みであることが明らかになりました。気候変動に対する意識の高まりと、政府による自然エネルギー、特に風力と水力への投資の増加が、鍛造部品の消費を押し上げると予想されます。したがって、この投資が予測期間中の製品需要を促進することが期待されます。例えば、2021年10月、米国政府は最大7つの大規模な洋上風力発電所を建設する計画を発表しました。同政府は、2030年までに30ギガワットの風力発電を行うことを目標としています。
同様に、2022年4月、同国政府は、2050年までに40GWの洋上風力発電プロジェクトを開発する計画を発表し、50の風力発電所に広がる見込みです。金属鍛造は、圧縮力を用いて金属を成形するプロセスです。プレス、ハンマー、ローリングなどを使って金属を成形します。このような電力、建設、農業、海洋、航空宇宙などの様々な産業における製品の需要の増加は、市場の成長を増強すると予想されます。原料に基づいて、炭素鋼は2021年に最大の収益シェアを占め、それは予測期間を通してその優位性を維持すると予想されます。
この成長は、同製品がしばしばタイトな結晶粒構造を持ち、摩擦に耐える機械的強度を持つという材料の特性に起因しています。また、炭素鋼は同種の製品よりも安価です。建設は、予測期間中、収益面で安定したCAGRで拡大すると予想されています。この成長は、COVID-19パンデミックによって生じた負の影響を解くために、建設部門への政府投資の増加に起因します。2021年11月に、イタリア政府は、2026年までに1.5~2.5%の経済成長を促進するための新しい回復および弾力化計画を打ち出しました。政府は、公共建築物の建設、再生可能エネルギー、廃棄物&水管理への投資を行う見込みです。
2021年、アジア太平洋地域は、売上高だけでなく、数量でも最大の地域市場となりました。2021年のAPAC地域の金属鍛造品の最大消費国は中国とインドでした。建設、自動車、エネルギーなどの様々な用途産業からの鍛造製品の需要増が、同地域の製品消費を押し上げました。世界の金属市場は競争が激しいです。鍛造製品の需要の高まりは、主要なメーカーが合併&買収戦略を選ぶことを余儀なくされています。例えば、2021年6月、インドの大手鍛造会社であるBharat Forgeは、Sanghvi Forging &Engineering Ltd.を買収したことを発表しました。
金属鍛造市場レポートハイライト
航空宇宙、発電、自動車などの業界からの軽量材料に対する高い需要により、アルミローマテリアルセグメントは予測期間中に最も速いCAGRを記録すると予測されます。
航空宇宙用途は、社会行動の変化による航空機需要の高まりと、それに伴う航空機生産の増加により、予測期間中に安定したCAGRで成長すると予想されます。
北米は、2022年から2030年にかけて、数量ベースでCAGR4.7%を記録すると予測されています。建設・インフラ業界への投資拡大と再生可能エネルギーへの需要が同地域の市場を牽引しています。
農業用アプリケーションは、収益と予測期間で大きなCAGRを記録する見込みです。
インドやブラジルなどでは農機具の需要が堅調で、今後数年間の市場成長を後押しする見込みです。
目次
第1章 調査手法と範囲
- 市場セグメンテーションと範囲
- 市場の定義
- 調査手法
- 調査範囲と前提
- 情報調達
- 購入したデータベース
- GVRの内部データベース
- 二次情報
- 第三者の視点
- 1次調査
- 情報分析
- データ分析モデル
- 市場形成とデータ可視化
- データの検証と公開
第2章 エグゼクティブサマリー
- 市場の見通し
- セグメント別見通し
- 競合考察
第3章 市場変数、動向、および範囲
- 市場の見通し
- 浸透と成長の見通しのマッピング
- 業界バリューチェーン分析
- 製造動向
- 原材料の動向
- 販売チャネル分析
- 規制の枠組み
- 市場力学
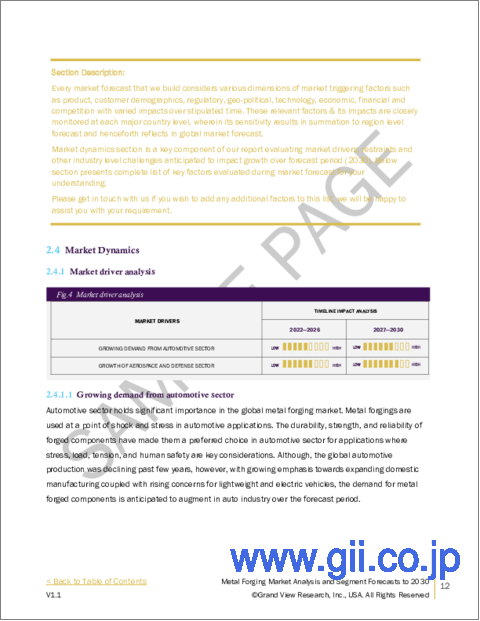
- 市場促進要因分析
- 市場制約分析
- 業界の課題
- 金属鍛造業界の分析- ポーターの5つの力
- サプライヤーの交渉力
- 買い手の交渉力
- 競争企業間の敵対関係
- 身代わりの脅威
- 新規参入業者の脅威
- 金属鍛造産業分析-PESTEL分析
- 政治的
- 経済
- 社交
- 技術的な
- 環境
- 法的
第4章 金属鍛造市場:原材料の見通しの見積もりと予測
- 定義と範囲
- 原材料の変動分析と市場シェア、2021年と2030年
- 炭素鋼
- 2017年から2030年までの炭素鋼市場の見積もりと予測(キロトン)
- 合金鋼
- 2017年から2030年までの合金鋼別の市場の見積もりと予測(キロトン)
- アルミニウム
- 2017年から2030年までのアルミニウム別の市場予測と予測(キロトン)
- マグネシウム
- 2017年から2030年までのマグネシウム別市場の見積もりと予測(キロトン)
- ステンレス鋼
- 2017年から2030年までのステンレス鋼別の市場予測と予測(キロトン)
- チタン
- 2017年から2030年までのチタン別の市場予測と予測(キロトン)
- その他
- 2017年から2030年までの市場の見積もりと予測(キロトン)
第5章 金属鍛造市場:アプリケーションの見通しの見積もりと予測
- 定義と範囲
- アプリケーションの変動分析と市場シェア、2021年と2030年
- 自動車
- 2017年から2030年までの自動車別の市場の見積もりと予測(キロトン)
- 交通手段
- 2017年から2030年までの自動車別の市場の見積もりと予測(キロトン)
- 航空宇宙
- 2017年から2030年までの航空宇宙別の市場の見積もりと予測(キロトン)
- 石油ガス
- 2017年から2030年までの石油とガス別市場の見積もりと予測(キロトン)
- 工事
- 2017年から2030年までの建設別の市場の見積もりと予測(キロトン)
- 農業
- 市場の見積もりと予測、農業別、2017~2030年(キロトン)
- 発電
- 2017年から2030年までの発電量別の市場予測と予測(キロトン)
- マリン
- 2017年から2030年までの海洋別の市場の見積もりと予測(キロトン)
- その他
- 2017年から2030年までの市場の見積もりと予測(キロトン)
第6章 金属鍛造市場の地域別見通しの見積もりと予測
- 地域の変動分析、2021年と2030年
- 北米
- 北米の金属鍛造市場推計・予測、2017~2030年(キロトン)
- 北米の金属鍛造市場推計・予測、原材料別、2017年から2030年(キロトン)
- 北米の金属鍛造市場推計・予測、用途別、2017~2030年(キロトン)
- 米国
- 米国の金属鍛造市場推計・予測、2017~2030年(キロトン)
- 米国の金属鍛造市場推計・予測、原材料別、2017~2030年(キロトン)
- 米国の金属鍛造市場推計・予測、用途別、2017~2030年(キロトン)
- カナダ
- カナダの金属鍛造市場推計・予測、2017~2030年(キロトン)
- カナダの金属鍛造市場推計・予測、原材料別、2017~2030年(キロトン)
- カナダの金属鍛造市場推計・予測、用途別、2017~2030年(キロトン)
- 欧州
- 欧州の金属鍛造市場推計・予測、2017~2030年(キロトン)
- 欧州の金属鍛造市場推計・予測、原材料別、2017年から2030年(キロトン)
- 欧州の金属鍛造市場推計・予測、アプリケーション別、2017~2030年(キロトン)
- ドイツ
- ドイツの金属鍛造市場推計・予測、2017~2030年(キロトン)
- ドイツの金属鍛造市場推計・予測、原材料別、2017~2030年(キロトン)
- ドイツの金属鍛造市場推計・予測、アプリケーション別、2017~2030年(キロトン)
- 英国
- 英国の金属鍛造市場推計・予測、2017~2030年(キロトン)
- 英国の金属鍛造市場推計・予測、原材料別、2017~2030年(キロトン)
- 英国の金属鍛造市場推計・予測、用途別、2017~2030年(キロトン)
- フランス
- フランスの金属鍛造市場推計・予測、2017~2030年(キロトン)
- フランスの金属鍛造市場推計・予測、原材料別、2017~2030年(キロトン)
- フランスの金属鍛造市場推計・予測、用途別、2017~2030年(キロトン)
- スペイン
- スペインの金属鍛造市場推計・予測、2017~2030年(キロトン)
- スペインの金属鍛造市場推計・予測、原材料別、2017~2030年(キロトン)
- スペインの金属鍛造市場推計・予測、用途別、2017~2030年(キロトン)
- イタリア
- イタリアの金属鍛造市場推計・予測、2017~2030年(キロトン)
- イタリアの金属鍛造市場推計・予測、原材料別、2017年から2030年(キロトン)
- イタリアの金属鍛造市場推計・予測、用途別、2017~2030年(キロトン)
- アジア太平洋地域
- アジア太平洋の金属鍛造市場推計・予測、2017~2030年(キロトン)
- アジア太平洋地域の金属鍛造市場推計・予測、原材料別、2017~2030年(キロトン)
- アジア太平洋の金属鍛造市場推計・予測、用途別、2017~2030年(キロトン)
- 中国
- 中国の金属鍛造市場推計・予測、2017~2030年(キロトン)
- 中国の金属鍛造市場推計・予測、原材料別、2017年から2030年(キロトン)
- 中国の金属鍛造市場推計・予測、用途別、2017~2030年(キロトン)
- インド
- インドの金属鍛造市場推計・予測、2017~2030年(キロトン)
- インドの金属鍛造市場推計・予測、原材料別、2017年から2030年(キロトン)
- インドの金属鍛造は、2017年から2030年までの用途別の市場と予測を見積もります(キロトン)
- 日本
- 日本の金属鍛造市場推計・予測、2017年から2030年(キロトン)
- 日本の金属鍛造市場推計・予測、原材料別、2017年から2030年(キロトン)
- 2017年から2030年までのアプリケーション別の日本の金属鍛造市場推計・予測(キロトン)
- 韓国
- 韓国の金属鍛造市場推計・予測、2017~2030年(キロトン)
- 韓国の金属鍛造市場推計・予測、原材料別、2017~2030年(キロトン)
- 韓国の金属鍛造市場推計・予測、アプリケーション別、2017~2030年(キロトン)
- 南米
- 中南米の金属鍛造市場推計・予測、2017~2030年(キロトン)
- 中南米の金属鍛造市場推計・予測、原材料別、2017年から2030年(キロトン)
- 中南米の金属鍛造市場推計・予測、用途別、2017~2030年(キロトン)
- 中東とアフリカ
- 中東およびアフリカの金属鍛造市場推計・予測、2017~2030年(キロトン)
- 中東およびアフリカの金属鍛造市場推計・予測、原材料別、2017~2030年(キロトン)
- 中東およびアフリカの金属鍛造市場推計・予測、用途別、2017~2030年(キロトン)
第7章 競合分析
- 主要な世界プレーヤーと最近の開発と業界への影響
- 戦略的枠組み
- ベンダー情勢
- 原材料のサプライヤー、ディストリビューター、その他の著名なメーカーのリスト
- 業界の主要プレーヤー/サプライヤーのリスト
- 潜在的な顧客のリスト
第8章 企業プロファイル
- Arconic
- 会社概要
- 財務実績
- 製品のベンチマーク
- 戦略的イニシアチブ
- ATI
- 会社概要
- 財務実績
- 製品のベンチマーク
- 戦略的イニシアチブ
- Bharat Forge
- 会社概要
- 財務実績
- 製品のベンチマーク
- 戦略的イニシアチブ
- Bruck GmbH
- 会社概要
- 財務実績
- 製品のベンチマーク
- 戦略的イニシアチブ
- China First Heavy Machinery Co., Ltd
- 会社概要
- 財務実績
- 製品のベンチマーク
- 戦略的イニシアチブ
- ELLWOOD Group Inc
- 会社概要
- 財務実績
- 製品のベンチマーク
- 戦略的イニシアチブ
- Jiangyin Hengrun Heavy Industries Co., Ltd.
- 会社概要
- 財務実績
- 製品のベンチマーク
- 戦略的イニシアチブ
- NIPPON STEEL CORPORATION
- 会社概要
- 財務実績
- 製品のベンチマーク
- 戦略的イニシアチブ
- Precision Castparts Corp.
- 会社概要
- 財務実績
- 製品のベンチマーク
- 戦略的イニシアチブ
- Kovarna VIVA
- 会社概要
- 財務実績
- 製品のベンチマーク
- 戦略的イニシアチブ
- LARSEN &TOUBRO LIMITED
- 会社概要
- 財務実績
- 製品のベンチマーク
- 戦略的イニシアチブ
- Scot Forge Company
- 会社概要
- 財務実績
- 製品のベンチマーク
- 戦略的イニシアチブ
- thyseenkrup AG
- 会社概要
- 財務実績
- 製品のベンチマーク
- 戦略的イニシアチブ
List of Tables
- Table 1 Metal forging market estimates & forecasts, by carbon steel 2017 - 2030 (USD Million) (Kilotons)
- Table 2 Metal forging market estimates & forecasts, by alloy steel, 2017 - 2030 (USD Million) (Kilotons)
- Table 3 Metal forging market estimates & forecasts, by aluminum, 2017 - 2030 (USD Million) (Kilotons)
- Table 4 Metal forging market estimates & forecasts, by magnesium, 2017 - 2030 (USD Million) (Kilotons)
- Table 5 Metal forging market estimates & forecasts, by stainless steel, 2017 - 2030 (USD Million) (Kilotons)
- Table 6 Metal forging market estimates & forecasts, by titanium. 2017 - 2030 (USD Million) (Kilotons)
- Table 7 Metal forging market estimates & forecasts, by 0thers. 2017 - 2030 (USD Million) (Kilotons)
- Table 8 Metal forging market estimates & forecasts, by automotive 2017 - 2030 (USD Million) (Kilotons)
- Table 9 Metal forging market estimates & forecasts, by transportation, 2017 - 2030 (USD Million) (Kilotons)
- Table 10 Metal forging market estimates & forecasts, by aerospace, 2017 - 2030 (USD Million) (Kilotons)
- Table 11 Metal forging market estimates & forecasts, by oil & gas, 2017 - 2030 (USD Million) (Kilotons)
- Table 12 Metal forging market estimates & forecasts, by construction, 2017 - 2030 (USD Million) (Kilotons)
- Table 13 Metal forging market estimates & forecasts, by agriculture. 2017 - 2030 (USD Million) (Kilotons)
- Table 14 Metal forging market estimates & forecasts, by power generation. 2017 - 2030 (USD Million) (Kilotons)
- Table 15 Metal forging market estimates & forecasts, by marine. 2017 - 2030 (USD Million) (Kilotons)
- Table 16 Metal forging market estimates & forecasts, by others. 2017 - 2030 (USD Million) (Kilotons)
- Table 17 North America metal forging market estimates & forecasts, 2017 - 2030 (USD Million) (Kilotons)
- Table 18 North America metal forging market estimates & forecasts, by raw material, 2017 - 2030 (USD Million)
- Table 19 North America metal forging market estimates & forecasts, by raw material, 2017 - 2030 (Kilotons)
- Table 20 North America metal forging market estimates & forecasts, by application, 2017 - 2030 (USD Million)
- Table 21 North America metal forging market estimates & forecasts, by application, 2017 - 2030 (Kilotons)
- Table 22 U.S. metal forging market estimates & forecasts, 2017 - 2030 (USD Million) (Kilotons)
- Table 23 U.S. metal forging market estimates & forecasts, by raw material, 2017 - 2030 (USD Million)
- Table 24 U.S. metal forging market estimates & forecasts, by raw material, 2017 - 2030 (Kilotons)
- Table 25 U.S. metal forging market estimates & forecasts, by application, 2017 - 2030 (USD Million)
- Table 26 U.S. metal forging market estimates & forecasts, by application, 2017 - 2030 (Kilotons)
- Table 27 Canada metal forging market estimates & forecasts, 2017 - 2030 (USD Million) (Kilotons)
- Table 28 Canada metal forging market estimates & forecasts, by raw material, 2017 - 2030 (USD Million)
- Table 29 Canada metal forging market estimates & forecasts, by raw material, 2017 - 2030 (Kilotons)
- Table 30 Canada metal forging market estimates & forecasts, by application, 2017 - 2030 (USD Million)
- Table 31 Canada metal forging market estimates & forecasts, by application, 2017 - 2030 (Kilotons)
- Table 32 Europe metal forging market estimates & forecasts, 2017 - 2030 (USD Million) (Kilotons)
- Table 33 Europe metal forging market estimates & forecasts, by raw material, 2017 - 2030 (USD Million)
- Table 34 Europe metal forging market estimates & forecasts, by raw material, 2017 - 2030 (Kilotons)
- Table 35 Europe metal forging market estimates & forecasts, by application, 2017 - 2030 (USD Million)
- Table 36 Europe metal forging market estimates & forecasts, by application, 2017 - 2030 (Kilotons)
- Table 37 Germany metal forging market estimates & forecasts, 2017 - 2030 (USD Million) (Kilotons)
- Table 38 Germany metal forging market estimates & forecasts, by raw material, 2017 - 2030 (USD Million)
- Table 39 Germany metal forging market estimates & forecasts, by raw material, 2017 - 2030 (Kilotons)
- Table 40 Germany metal forging market estimates & forecasts, by application, 2017 - 2030 (USD Million)
- Table 41 Germany metal forging market estimates & forecasts, by application, 2017 - 2030 (Kilotons)
- Table 42 U.K. metal forging market estimates & forecasts, 2017 - 2030 (USD Million) (Kilotons)
- Table 43 U.K. metal forging market estimates & forecasts, by raw material, 2017 - 2030 (USD Million)
- Table 44 U.K. metal forging market estimates & forecasts, by raw material t, 2017 - 2030 (Kilotons)
- Table 45 U.K. metal forging market estimates & forecasts, by application, 2017 - 2030 (USD Million)
- Table 46 U.K. metal forging market estimates & forecasts, by application, 2017 - 2030 (Kilotons)
- Table 47 France metal forging market estimates & forecasts, 2017 - 2030 (USD Million) (Kilotons)
- Table 48 France metal forging market estimates & forecasts, by raw material t, 2017 - 2030 (USD Million)
- Table 49 France metal forging market estimates & forecasts, by raw material, 2017 - 2030 (Kilotons)
- Table 50 France metal forging market estimates & forecasts, by application, 2017 - 2030 (USD Million)
- Table 51 France metal forging market estimates & forecasts, by application, 2017 - 2030 (Kilotons)
- Table 52 Italy metal forging market estimates & forecasts, by application, 2017 - 2030 (Kilotons)
- Table 53 Spain metal forging market estimates & forecasts, 2017 - 2030 (USD Million) (Kilotons)
- Table 54 Spain metal forging market estimates & forecasts, by raw material, 2017 - 2030 (USD Million)
- Table 55 Spain metal forging market estimates & forecasts, by raw material, 2017 - 2030 (Kilotons)
- Table 56 Spain metal forging market estimates & forecasts, by application, 2017 - 2030 (USD Million)
- Table 57 Spain metal forging market estimates & forecasts, by application, 2017 - 2030 (Kilotons)
- Table 58 Italy metal forging market estimates & forecasts, 2017 - 2030 (USD Million) (Kilotons)
- Table 59 Italy metal forging market estimates & forecasts, by raw material, 2017 - 2030 (USD Million)
- Table 60 Italy metal forging market estimates & forecasts, by p raw material, 2017 - 2030 (Kilotons)
- Table 61 Italy metal forging market estimates & forecasts, by application, 2017 - 2030 (USD Million)
- Table 62 Asia Pacific metal forging market estimates & forecasts, 2017 - 2030 (USD Million) (Kilotons)
- Table 63 Asia Pacific metal forging market estimates & forecasts, by raw material, 2017 - 2030 (USD Million)
- Table 64 Asia Pacific metal forging market estimates & forecasts, by raw material, 2017 - 2030 (Kilotons)
- Table 65 Asia Pacific metal forging market estimates & forecasts, by application, 2017 - 2030 (USD Million)
- Table 66 Asia Pacific metal forging market estimates & forecasts, by application, 2017 - 2030 (Kilotons)
- Table 67 China metal forging market estimates & forecasts, 2017 - 2030 (USD Million) (Kilotons)
- Table 68 China metal forging market estimates & forecasts, by raw material, 2017 - 2030 (USD Million)
- Table 69 China metal forging market estimates & forecasts, by raw material, 2017 - 2030 (Kilotons)
- Table 70 China metal forging market estimates & forecasts, by application, 2017 - 2030 (USD Million)
- Table 71 China metal forging market estimates & forecasts, by application, 2017 - 2030 (Kilotons)
- Table 72 Japan metal forging market estimates & forecasts, 2017 - 2030 (USD Million) (Kilotons)
- Table 73 Japan metal forging market estimates & forecasts, by raw material, 2017 - 2030 (USD Million)
- Table 74 Japan metal forging market estimates & forecasts, by raw material, 2017 - 2030 (Kilotons)
- Table 75 Japan metal forging market estimates & forecasts, by application, 2017 - 2030 (USD Million)
- Table 76 Japan metal forging market estimates & forecasts, by application, 2017 - 2030 (Kilotons)
- Table 77 India metal forging market estimates & forecasts, 2017 - 2030 (USD Million) (Kilotons)
- Table 78 India metal forging market estimates & forecasts, by raw material, 2017 - 2030 (USD Million)
- Table 79 India metal forging market estimates & forecasts, by raw material, 2017 - 2030 (Kilotons)
- Table 80 India metal forging market estimates & forecasts, by application, 2017 - 2030 (USD Million)
- Table 81 India metal forging market estimates & forecasts, by application, 2017 - 2030 (Kilotons)
- Table 82 South Korea metal forging market estimates & forecasts, 2017 - 2030 (USD Million) (Kilotons)
- Table 83 South Korea metal forging market estimates & forecasts, by raw material, 2017 - 2030 (USD Million)
- Table 84 South Korea metal forging market estimates & forecasts, by raw material, 2017 - 2030 (Kilotons)
- Table 85 South Korea metal forging market estimates & forecasts, by application, 2017 - 2030 (USD Million)
- Table 86 South Korea metal forging market estimates & forecasts, by application, 2017 - 2030 (Kilotons)
- Table 87 Central & South America metal forging market estimates & forecasts, 2017 - 2030 (USD Million) (Kilotons)
- Table 88 Central & South America metal forging market estimates & forecasts, by raw material, 2017 - 2030 (USD Million)
- Table 89 Central & South America metal forging market estimates & forecasts, by raw material, 2017 - 2030 (Kilotons)
- Table 90 Central & South America metal forging market estimates & forecasts, by application, 2017 - 2030 (USD Million)
- Table 91 Central & South America metal forging market estimates & forecasts, by application, 2017 - 2030 (Kilotons)
- Table 92 Middle East & Africa metal forging market estimates & forecasts, by raw material, 2017 - 2030 (USD Million)
- Table 93 Middle East & Africa metal forging market estimates & forecasts, by raw material, 2017 - 2030 (Kilotons)
- Table 94 Middle East & Africa metal forging market estimates & forecasts, by application, 2017 - 2030 (USD Million)
- Table 95 Middle East & Africa metal forging market estimates & forecasts, by application, 2017 - 2030 (Kilotons)
List of Figures
- Fig. 1 Market segmentation & scope
- Fig. 2 Information procurement
- Fig. 3 Primary research pattern
- Fig. 4 Primary research process
- Fig. 5 Primary research approaches
- Fig. 6 Market snapshot
- Fig. 7 Segmental outlook
- Fig. 8 Competitive Insights
- Fig. 9 Global metal forging market, 2017 - 2030 (USD Million) (Kilotons)
- Fig. 10 Penetration & growth prospect mapping, by application, 2021
- Fig. 11 Value chain analysis
- Fig. 12 Market driver analysis
- Fig. 13 Market restraint analysis
- Fig. 14 Metal forging market: Raw material movement analysis & Market Share, 2021 & 2030 (%) (USD Million)
- Fig. 15 Metal forging market: Application movement analysis, 2021 & 2030 (%) (USD Million)
- Fig. 16 Metal forging market: Regional movement analysis, 2021 & 2030 (%) (USD Million)
Metal Forging Market Growth & Trends:
The global metal forging market size is expected to reach USD 145.44 billion by 2030, according to a new report by Grand View Research, Inc., expanding at a CAGR of 7.7% over the forecast period. Rising awareness about climate change and increasing investment in renewables, especially in wind and hydro, by governments is expected to boost the consumption of forged components. Thus, this investment is expected to propel the product demand during the forecast period. For instance, in October 2021, the U.S government unveiled plans to build up to 7 major offshore wind farms. The government is targeting to produce 30 gigawatts of wind power by 2030.
Similarly, in April 2022, the government of the country announced that it is planning to develop a 40 GW offshore wind project by 2050 that is expected to spread over 50 wind farms.Metal forging is the process, in which metals are shaped and formed using compressive force. These forces are applied using pressing, hammering, and rolling. Increasing demand for the product in various industries, such as power, construction, agriculture, marine, and aerospace, is anticipated to augment the market growth.Based on raw material, carbon steel accounted for the largest revenue share in 2021 and it is expected to maintain its dominance throughout the forecast period.
The growth is attributed to the properties of the material as the product often has a tight grain structure, which makes it mechanically strong to withstand friction. Also, carbon steel is cheaper than its counterparts.Construction is anticipated to expand at a steady CAGR, in terms of revenue, over the forecast period. The growth is attributed to increasing government investment in the construction sector to untangle the negative impact created by the COVID-19 pandemic.In November 2021, the Italian government came up with a new recovery and resilience plan to foster economic growth by 1.5 to 2.5% by 2026. The government is expected to invest in the construction of public buildings, renewable energy, and waste & water management.
In 2021, Asia Pacific was the largest regional market, in terms of revenue as well as volume. China and India were the largest consumers of metal forgings in 2021 in the APAC region. The rising demand for forged products from various application industries, such as construction, automotive, and energy, has pushed product consumption in the region.The global metal market is highly competitive. The rising demand for forged products has forced key manufacturers to opt for merger & acquisition strategies. For instance, in June 2021, Bharat Forge, a leading forging company in India announced that they have acquired Sanghvi Forging & Engineering Ltd.
Metal Forging Market Report Highlights:
- The aluminumraw materials segment is anticipated to register the fastest CAGR over the forecast period due to the high demand for lightweight materials from industries, such as aerospace, power generation, and automotive
- The aerospace application segment is expected to grow at a steady CAGR over the forecast period due to the high demand for air travel owing to changes in social behavior, which, in turn, is boosting aircraft production
- North America is expected to register a CAGR of 4.7%, in terms of volume, from2022 to 2030. Increasing investment in the construction & infrastructure industry and demand for renewables is driving the regional market
- The agriculture application segment is expected to register a significant CAGR, in terms of revenue,over the forecast period
- Steady demand for farm equipment in countries, such as India and Brazil, is likely to support marketgrowthin the coming years
Table of Contents
Chapter 1. Methodology and Scope
- 1.1. Market Segmentation & Scope
- 1.2. Market Definition
- 1.3. Research Methodology
- 1.4. Research Scope and Assumptions
- 1.5. Information Procurement
- 1.5.1. Purchased Database
- 1.5.2. GVR's Internal Database
- 1.5.3. Secondary Sources
- 1.5.4. Third-Party Perspectives
- 1.5.5. Primary Research
- 1.6. Information Analysis
- 1.6.1. Data Analysis Models
- 1.7. Market Formulation & Data Visualization
- 1.8. Data Validation & Publishing
Chapter 2. Executive Summary
- 2.1. Market Outlook
- 2.2. Segmental Outlook
- 2.3. Competitive Insights
Chapter 3. Market Variables, Trends, and Scope
- 3.1. Market Outlook
- 3.2. Penetration & Growth Prospect Mapping
- 3.3. Industry Value Chain Analysis
- 3.3.1. Manufacturing Trend
- 3.3.2. Raw Material Trends
- 3.3.3. Sales Channel Analysis
- 3.4. Regulatory Framework
- 3.5. Market Dynamics
- 3.5.1. Market Driver Analysis
- 3.5.2. Market Restraint Analysis
- 3.5.3. Industry Challenges
- 3.6. Metal Forging Industry Analysis-Porter's Five Forces
- 3.6.1. Bargaining Power of Supplier
- 3.6.2. Bargaining Power of Buyers
- 3.6.3. Competitive Rivalry
- 3.6.4. Threat of Substitute
- 3.6.5. Threat of New Entrants
- 3.7. Metal Forging Industry Analysis-PESTEL Analysis
- 3.7.1. Political
- 3.7.2. Economics
- 3.7.3. Social
- 3.7.4. Technological
- 3.7.5. Environmental
- 3.7.6. Legal
Chapter 4. Metal Forging Market: Raw Material Outlook Estimates & Forecasts
- 4.1. Definition & Scope
- 4.2. Raw Material Movement Analysis & Market Share, 2021 & 2030
- 4.3. Carbon Steel
- 4.3.1. Market estimates & forecasts, by carbon steel, 2017 - 2030 (USD Million) (Kilotons)
- 4.4. Alloy Steel
- 4.4.1. Market estimates & forecasts, by alloy steel, 2017 - 2030 (USD Million) (Kilotons)
- 4.5. Aluminum
- 4.5.1. Market estimates & forecasts, by aluminum, 2017 - 2030 (USD Million) (Kilotons)
- 4.6. Magnesium
- 4.6.1. Market estimates & forecasts, by magnesium, 2017 - 2030 (USD Million) (Kilotons)
- 4.7. Stainless Steel
- 4.7.1. Market estimates & forecasts, by stainless steel, 2017 - 2030 (USD Million) (Kilotons)
- 4.8. Titanium
- 4.8.1. Market estimates & forecasts, by titanium, 2017 - 2030 (USD Million) (Kilotons)
- 4.9. Others
- 4.9.1. Market estimates & forecasts, by others 2017 - 2030 (USD Million) (Kilotons
Chapter 5. Metal Forging Market: Application Outlook Estimates & Forecasts
- 5.1. Definition & Scope
- 5.2. Application Movement Analysis & Market Share, 2021 & 2030
- 5.3. Automotive
- 5.3.1. Market estimates & forecasts, by automotive, 2017 - 2030 (USD Million) (Kilotons)
- 5.4. Transportation
- 5.4.1. Market estimates & forecasts, by automotive, 2017 - 2030 (USD Million) (Kilotons)
- 5.5. Aerospace
- 5.5.1. Market estimates & forecasts, by aerospace, 2017 - 2030 (USD Million) (Kilotons)
- 5.6. Oil & Gas
- 5.6.1. Market estimates & forecasts, by oil & gas, 2017 - 2030 (USD Million) (Kilotons)
- 5.7. Construction
- 5.7.1. Market estimates & forecasts, by construction, 2017 - 2030 (USD Million) (Kilotons)
- 5.8. Agriculture
- 5.8.1. Market estimates & forecasts, by agriculture, 2017 - 2030 (USD Million) (Kilotons)
- 5.9. Power Generation
- 5.9.1. Market estimates & forecasts, by power generation, 2017 - 2030 (USD Million) (Kilotons)
- 5.10. Marine
- 5.10.1. Market estimates & forecasts, by marine, 2017 - 2030 (USD Million) (Kilotons)
- 5.11. Others
- 5.11.1. Market estimates & forecasts, by other, 2017 - 2030 (USD Million) (Kilotons)
Chapter 6. Metal Forging Market Regional Outlook Estimates & Forecasts
- 6.1. Regional Movement Analysis, 2021 & 2030
- 6.2. North America
- 6.2.1. North America metal forging market estimates and forecasts, 2017 - 2030 (USD Million) (Kilotons)
- 6.2.2. North America metal forging market estimates and forecasts, by raw material, 2017 - 2030 (USD Million) (Kilotons)
- 6.2.3. North America metal forging market estimates and forecasts, by application, 2017 - 2030 (USD Million) (Kilotons)
- 6.2.4. U.S.
- 6.2.4.1 U.S. metal forging market estimates and forecasts, 2017 - 2030 (USD Million) (Kilotons)
- 6.2.4.2 U.S. metal forging market estimates and forecasts, by raw material, 2017 - 2030 (USD Million) (Kilotons)
- 6.2.4.3 U.S. metal forging market estimates and forecasts, by application, 2017 - 2030 (USD Million) (Kilotons)
- 6.2.5. Canada
- 6.2.5.1 Canada metal forging market estimates and forecasts, 2017 - 2030 (USD Million) (Kilotons)
- 6.2.5.2 Canada metal forging market estimates and forecasts, by raw material, 2017 - 2030 (USD Million) (Kilotons)
- 6.2.5.3 Canada metal forging market estimates and forecasts, by application, 2017 - 2030 (USD Million) (Kilotons)
- 6.3. Europe
- 6.3.1. Europe metal forging market estimates and forecasts, 2017 - 2030 (USD Million) (Kilotons)
- 6.3.2. Europe metal forging market estimates and forecasts, by raw material, 2017 - 2030 (USD Million) (Kilotons)
- 6.3.3. Europe metal forging market estimates and forecasts, by application, 2017 - 2030 (USD Million) (Kilotons)
- 6.3.4. Germany
- 6.3.4.1 Germany metal forging market estimates and forecasts, 2017 - 2030 (USD Million) (Kilotons)
- 6.3.4.2 Germany metal forging market estimates and forecasts, by raw material, 2017 - 2030 (USD Million) (Kilotons)
- 6.3.4.3 Germany metal forging market estimates and forecasts, by application, 2017 - 2030 (USD Million) (Kilotons)
- 6.3.5. U.K.
- 6.3.5.1 U.K. metal forging market estimates and forecasts, 2017 - 2030 (USD Million) (Kilotons)
- 6.3.5.2 U.K. metal forging market estimates and forecasts, by raw material, 2017 - 2030 (USD Million) (Kilotons)
- 6.3.5.3 U.K. metal forging market estimates and forecasts, by application, 2017 - 2030 (USD Million) (Kilotons)
- 6.3.6. France
- 6.3.6.1 France metal forging market estimates and forecasts, 2017 - 2030 (USD Million) (Kilotons)
- 6.3.6.2 France metal forging market estimates and forecasts, by raw material, 2017 - 2030 (USD Million) (Kilotons)
- 6.3.6.3 France metal forging market estimates and forecasts, by application, 2017 - 2030 (USD Million) (Kilotons)
- 6.3.7. Spain
- 6.3.7.1 Spain metal forging market estimates and forecasts, 2017 - 2030 (USD Million) (Kilotons)
- 6.3.7.2 Spain metal forging market estimates and forecasts, by raw material, 2017 - 2030 (USD Million) (Kilotons)
- 6.3.7.3 Spain metal forging market estimates and forecasts, by application, 2017 - 2030 (USD Million) (Kilotons)
- 6.3.8. Italy
- 6.3.8.1 Italy metal forging market estimates and forecasts, 2017 - 2030 (USD Million) (Kilotons)
- 6.3.8.2 Italy metal forging market estimates and forecasts, by raw material, 2017 - 2030 (USD Million) (Kilotons)
- 6.3.8.3 Italy metal forging market estimates and forecasts, by application, 2017 - 2030 (USD Million) (Kilotons)
- 6.4. Asia Pacific
- 6.4.1. Asia Pacific metal forging market estimates and forecasts, 2017 - 2030 (USD Million) (Kilotons)
- 6.4.2. Asia Pacific metal forging market estimates and forecasts, by raw material, 2017 - 2030 (USD Million) (Kilotons)
- 6.4.3. Asia Pacific metal forging market estimates and forecasts, by application, 2017 - 2030 (USD Million) (Kilotons)
- 6.4.4. China
- 6.4.4.1 China metal forging market estimates and forecasts, 2017 - 2030 (USD Million) (Kilotons)
- 6.4.4.2 China metal forging market estimates and forecasts, by raw material, 2017 - 2030 (USD Million) (Kilotons)
- 6.4.4.3 China metal forging market estimates and forecasts, by application, 2017 - 2030 (USD Million) (Kilotons)
- 6.4.5. India
- 6.4.5.1 India metal forging market estimates and forecasts, 2017 - 2030 (USD Million) (Kilotons)
- 6.4.5.2 India metal forging market estimates and forecasts, by raw material, 2017 - 2030 (USD Million) (Kilotons)
- 6.4.5.3 India metal forging estimates market and forecasts, by application, 2017 - 2030 (USD Million) (Kilotons)
- 6.4.6. Japan
- 6.4.6.1 Japan metal forging market estimates and forecasts, 2017 - 2030 (USD Million) (Kilotons)
- 6.4.6.2 Japan metal forging market estimates and forecasts, by raw material, 2017 - 2030 (USD Million) (Kilotons)
- 6.4.6.3 Japan metal forging market estimates and forecasts, by application, 2017 - 2030 (USD Million) (Kilotons)
- 6.4.7. South Korea
- 6.4.7.1 South Korea metal forging market estimates and forecasts, 2017 - 2030 (USD Million) (Kilotons)
- 6.4.7.2 South Korea metal forging market estimates and forecasts, by raw material, 2017 - 2030 (USD Million) (Kilotons)
- 6.4.7.3 South Korea metal forging market estimates and forecasts, by application, 2017 - 2030 (USD Million) (Kilotons)
- 6.5. Cental & South America
- 6.5.1. Central & South America metal forging market estimates and forecasts, 2017 - 2030 (USD Million) (Kilotons)
- 6.5.2. Central & South America metal forging market estimates and forecasts, by raw material, 2017 - 2030 (USD Million) (Kilotons)
- 6.5.3. Central & South America metal forging market estimates and forecasts, by application, 2017 - 2030 (USD Million) (Kilotons)
- 6.6. Middle East & Africa
- 6.6.1. Middle East & Africa metal forging market estimates and forecasts, 2017 - 2030 (USD Million) (Kilotons)
- 6.6.2. Middle East & Africa metal forging market estimates and forecasts, by raw material, 2017 - 2030 (USD Million) (Kilotons)
- 6.6.3. Middle East & Africa metal forging market estimates and forecasts, by application, 2017 - 2030 (USD Million) (Kilotons)
Chapter 7. Competitive Analysis
- 7.1. Key Global Players & Recent Development & Their Impact On The Industry
- 7.2. Strategy Frameworks
- 7.3. Vendor Landscape
- 7.3.1. List of raw material suppliers, distributors and other prominent manufactures
- 7.3.2. List of key players/supplier in the industry
- 7.3.3. List of potential customers
Chapter 8. Company Profiles
- 8.1. Arconic
- 8.1.1. Company Overview
- 8.1.2. Financial Performance
- 8.1.3. Product Benchmarking
- 8.1.4. Strategic Initiative
- 8.2. ATI
- 8.2.1. Company Overview
- 8.2.2. Financial Performance
- 8.2.3. Product Benchmarking
- 8.2.4. Strategic Initiative
- 8.3. Bharat Forge
- 8.3.1. Company Overview
- 8.3.2. Financial Performance
- 8.3.3. Product Benchmarking
- 8.3.4. Strategic Initiative
- 8.4. Bruck GmbH
- 8.4.1. Company Overview
- 8.4.2. Financial Performance
- 8.4.3. Product Benchmarking
- 8.4.4. Strategic Initiative
- 8.5. China First Heavy Machinery Co., Ltd
- 8.5.1. Company Overview
- 8.5.2. Financial Performance
- 8.5.3. Product Benchmarking
- 8.5.4. Strategic Initiative
- 8.6. ELLWOOD Group Inc
- 8.6.1. Company Overview
- 8.6.2. Financial Performance
- 8.6.3. Product Benchmarking
- 8.6.4. Strategic Initiative
- 8.7. Jiangyin Hengrun Heavy Industries Co., Ltd.
- 8.7.1. Company Overview
- 8.7.2. Financial Performance
- 8.7.3. Product Benchmarking
- 8.7.4. Strategic Initiative
- 8.8. NIPPON STEEL CORPORATION
- 8.8.1. Company Overview
- 8.8.2. Financial Performance
- 8.8.3. Product Benchmarking
- 8.8.4. Strategic Initiative
- 8.9. Precision Castparts Corp.
- 8.9.1. Company Overview
- 8.9.2. Financial Performance
- 8.9.3. Product Benchmarking
- 8.9.4. Strategic Initiative
- 8.10. Kovarna VIVA
- 8.10.1. Company Overview
- 8.10.2. Financial Performance
- 8.10.3. Product Benchmarking
- 8.10.4. Strategic Initiative
- 8.11. LARSEN & TOUBRO LIMITED
- 8.11.1. Company Overview
- 8.11.2. Financial Performance
- 8.11.3. Product Benchmarking
- 8.11.4. Strategic Initiative
- 8.12. Scot Forge Company
- 8.12.1. Company Overview
- 8.12.2. Financial Performance
- 8.12.3. Product Benchmarking
- 8.12.4. Strategic Initiative
- 8.13. thyseenkrup AG
- 8.13.1. Company Overview
- 8.13.2. Financial Performance
- 8.13.3. Product Benchmarking
- 8.13.4. Strategic Initiative