|
|
市場調査レポート
商品コード
1750644
潤滑油の世界市場規模、シェア、動向分析レポート:製品別、用途別、地域別、セグメント別予測(2025年~2030年)Lubricants Market Size, Share & Trends Analysis Report By Product, By Application, By Region, And Segment Forecasts, 2025 - 2030 |
||||||
|
|||||||
カスタマイズ可能
|
|||||||

| 潤滑油の世界市場規模、シェア、動向分析レポート:製品別、用途別、地域別、セグメント別予測(2025年~2030年) |
|
出版日: 2025年05月26日
発行: Grand View Research
ページ情報: 英文 80 Pages
納期: 2~10営業日
|

全表示
- 概要
- 図表
- 目次
潤滑油市場の成長と動向:
Grand View Research, Inc.の最新レポートによると、世界の潤滑油の市場規模は2025年~2030年にCAGR3.8%で拡大し、2030年には1,802億米ドルに達すると推定されています。
環境に優しい特性を持つバイオベースの潤滑油の需要が伸びていることから、今後数年間はより高い需要が見込まれます。さらに、原材料の入手可能性やインフラ・人件費の削減など様々な要因から、メーカーは発展途上国に生産拠点を移し、拡大しています。このことが、予測期間中の市場成長を押し上げると予想されます。一般的な石油メーカーは、原油、CBM、タイトオイル、その他の添加剤を使用して、あらゆるタイプの潤滑油を製造しています。
PEGの最大の用途は医療用で、2022年の市場シェアの40%以上を占めました。PEGの優れた混合性、吸湿性、非毒性特性により、錠剤や軟膏など数多くの医薬品に高い需要があります。特にインド、中国、ブラジルなどの新興国における医薬品支出の増加は、予測期間中にPEG市場を押し上げると予想されます。VOC排出量が少ないため、溶剤としてのPEGの使用が増加していることと相まって、塗料・コーティングの需要が伸びており、今後6年間の市場成長を促進すると予想されます。
中国、インド、ブラジルなどの新興市場の経済成長により、これらの地域では公共交通機関の整備が進んでいます。この動向は、業務自動車用潤滑油の需要をさらに強化すると予想されます。アジア太平洋の自動車産業は、急速な経済開発、大規模な建設プロジェクト、100%直接投資や「スマートシティ」など政府による様々な有利な政策の導入により、予測期間中に高い成長率を記録すると予想されます。急速な産業開発と高性能高級乗用車への需要の高まりも、国際的な自動車関連企業による多額の投資を引き寄せています。
エクソンモービルやシェブロンなどの企業は、特定の用途向けの潤滑油の生産に直接関与しており、これらの企業はさらに、潤滑油の安定した販売を確保するために、主要なエンドユーザーとの供給契約に関与しています。トタル、シェル、アムソイル、カストロールなどの企業は、タタ・モーターズやヴェスタス・ウィンド・システムズと独占供給契約を結び、自社の潤滑油ブランドを供給しています。世界企業だけでなく、地域の業界企業も、特に自動車用潤滑油ユーザー向けに、地域のサービスセンターで直接販売チャネルを開発しています。また、エンドユーザーの年次イベントに参加し、オファー価格で製品を展示する企業もあります。
潤滑油市場のレポートのハイライト
- 市場は、自動車とそのスペアパーツの取引拡大に伴う自動車用オイルとグリースの需要増加により、大きく推定されています。
- 2024年には自動車セグメントが53.3%の最大収益シェアで世界の業界を支配しました。これは、バス、トラック、その他の旅客輸送形態などの消費者向け自動車の販売増加に起因しています。
- ガスタービンオイルは、ガスタービンの効率的かつ信頼性の高い運転を助けると同時に、発電所運転の安全性と生産性を高めるために作られた高性能オイルです。
- 2024年の売上高シェアは44.9%で、アジア太平洋が市場を独占しています。優れた性能特性を持つ先端技術製品を求める消費者が増加しています。このことが市場の成長に寄与しています。
目次
第1章 調査手法と範囲
第2章 エグゼクティブサマリー
第3章 市場の変数、動向、範囲
- 世界の潤滑油市場の見通し
- バリューチェーン分析
- 原材料の見通し
- 自動車/製品の見通し
- 販売チャネル分析
- 価格動向分析
- 価格に影響を与える要因
- 規制の枠組み
- 標準とコンプライアンス
- 市場力学
- 市場促進要因分析
- 市場抑制要因分析
- 市場課題分析
- 市場機会分析
- ポーターのファイブフォース分析
- 供給企業の交渉力
- 買い手の交渉力
- 代替の脅威
- 新規参入業者の脅威
- 競争企業間の敵対関係
- PESTLE分析
- 政治
- 経済
- 社会情勢
- 製品
- 環境
- 法律
第4章 潤滑油市場:製品の推定・動向分析
- 潤滑油市場:製品の変動分析、2023年・2030年
- ミネラルオイル
- 合成油
- バイオベースオイル
第5章 潤滑油市場:用途の推定・動向分析
- 潤滑油市場:用途の変動分析、2023年・2030年
- 産業
- 自動車
- 海洋
- 航空宇宙
- その他の用途
第6章 潤滑油市場:地域の推定・動向分析
- 地域分析、2023年・2030年
- 北米
- 製品別、2018年~2030年
- 用途別、2018年~2030年
- 米国
- カナダ
- メキシコ
- 欧州
- 製品別、2018年~2030年
- 用途別、2018年~2030年
- ドイツ
- 英国
- フランス
- イタリア
- スペイン
- アジア太平洋
- 製品別、2018年~2030年
- 用途別、2018年~2030年
- 中国
- インド
- 日本
- 韓国
- ラテンアメリカ
- 製品別、2018年~2030年
- 用途別、2018年~2030年
- ブラジル
- アルゼンチン
- 中東・アフリカ
- 製品別、2018年~2030年
- 用途別、2018年~2030年
- サウジアラビア
- 南アフリカ
第7章 競合情勢
- 主要市場参入企業の最近の動向
- 企業分類
- 企業ヒートマップ分析
- 企業の市場ポジショニング分析:2024年
- 戦略マッピング
- 企業プロファイル/上場企業
- ExxonMobil Corp.
- Royal Dutch Shell Co.
- BP PLC
- TotalEnergies
- Chevron Corp
- Fuchs
- Castrol India Limited
- Amsoil Inc.
- JX Nippon &Gas Exploration Corp.
- Phillips 66 Company
- Valvoline LLC
- PetroChina Company Ltd.
List of Tables
- TABLE 1 Lubricants market estimates & forecasts, 2018 - 2030 (Kilo Tons) (USD Million)
- TABLE 2 Mineral Oil lubricants market estimates & forecasts, 2018 - 2030 (Kilo Tons) (USD Million)
- TABLE 3 Synthetic Oil lubricants market estimates & forecasts, 2018 - 2030 (Kilo Tons) (USD Million)
- TABLE 4 Bio-Based Oils lubricants market estimates & forecasts, 2018 - 2030 (Kilo Tons) (USD Million)
- TABLE 5 Other product lubricants market estimates & forecasts, 2018 - 2030 (Kilo Tons) (USD Million)
- TABLE 6 Lubricants market estimates & forecasts, by industrial, 2018 - 2030 (Kilo Tons) (USD Million)
- TABLE 7 Lubricants market estimates & forecasts, by automotive, 2018 - 2030 (Kilo Tons) (USD Million)
- TABLE 8 Lubricants market estimates & forecasts, by marines, 2018 - 2030 (Kilo Tons) (USD Million)
- TABLE 9 Lubricants market estimates & forecasts, by aerospaces, 2018 - 2030 (Kilo Tons) (USD Million)
- TABLE 10 Lubricants market estimates & forecasts, by other applications, 2018 - 2030 (Kilo Tons) (USD Million)
- TABLE 11 Lubricants market estimates & forecasts, 2018 - 2030 (USD Million)
- TABLE 12 Lubricants market estimates & forecasts by product, 2018 - 2030 (Kilo Tons)
- TABLE 13 Lubricants market estimates & forecasts by product, 2018 - 2030 (USD Million)
- TABLE 14 Lubricants market estimates & forecasts by application, 2018 - 2030 (Kilo Tons)
- TABLE 15 Lubricants market estimates & forecasts by application, 2018 - 2030 (USD Million)
- TABLE 16 North America polyurethane Coatings market estimates & forecast, 2018 - 2030 (Kilo Tons) (USD Million)
- TABLE 17 North America lubricants market estimates & forecasts by product, 2018 - 2030 (Kilo Tons)
- TABLE 18 North America lubricants market estimates & forecasts by product, 2018 - 2030 (USD Million)
- TABLE 19 North America lubricants market estimates & forecasts by application, 2018 - 2030 (Kilo Tons)
- TABLE 20 North America lubricants market estimates & forecasts by application, 2018 - 2030 (USD Million)
- TABLE 21 U.S. lubricants market estimates & forecasts, 2018 - 2030 (Kilo Tons) (USD Million)
- TABLE 22 U.S. lubricants market estimates & forecasts by product, 2018 - 2030 (Kilo Tons)
- TABLE 23 U.S. lubricants market estimates & forecasts by product, 2018 - 2030 (USD million)
- TABLE 24 U.S. lubricants market estimates & forecasts by application, 2018 - 2030 (Kilo Tons)
- TABLE 25 U.S. lubricants market estimates & forecasts by application, 2018 - 2030 (USD million)
- TABLE 26 Canada lubricants market estimates & forecasts, 2018 - 2030 (Kilo Tons) (USD million)
- TABLE 27 Canada lubricants market estimates & forecasts by product, 2018 - 2030 (Kilo Tons)
- TABLE 28 Canada lubricants market estimates & forecasts by product, 2018 - 2030 (USD million)
- TABLE 29 Canada lubricants market estimates & forecasts by application, 2018 - 2030 (Kilo Tons)
- TABLE 30 Canada lubricants market estimates & forecasts by application, 2018 - 2030 (USD million)
- TABLE 31 Mexico lubricants market estimates & forecasts, 2018 - 2030 (Kilo Tons) (USD million)
- TABLE 32 Mexico lubricants market estimates & forecasts by product, 2018 - 2030 (Kilo Tons)
- TABLE 33 Mexico lubricants market estimates & forecasts by product, 2018 - 2030 (USD million)
- TABLE 34 Mexico lubricants market estimates & forecasts by application, 2018 - 2030 (Kilo Tons)
- TABLE 35 Mexico lubricants market estimates & forecasts by application, 2018 - 2030 (USD million)
- TABLE 36 Europe lubricants market estimates & forecasts, 2018 - 2030 (Kilo Tons) (USD million)
- TABLE 37 Europe lubricants market estimates & forecasts by product, 2018 - 2030 (Kilo Tons)
- TABLE 38 Europe lubricants market estimates & forecasts by product, 2018 - 2030 (USD million)
- TABLE 39 Europe lubricants market estimates & forecasts by application, 2018 - 2030 (Kilo Tons)
- TABLE 40 Europe lubricants market estimates & forecasts by application, 2018 - 2030 (USD million)
- TABLE 41 Germany lubricants market estimates & forecasts, 2018 - 2030 (Kilo Tons) (USD million)
- TABLE 42 Germany lubricants market estimates & forecasts by product, 2018 - 2030 (Kilo Tons)
- TABLE 43 Germany lubricants market estimates & forecasts by product, 2018 - 2030 (USD million)
- TABLE 44 Germany lubricants market estimates & forecasts by application, 2018 - 2030 (Kilo Tons)
- TABLE 45 Germany lubricants market estimates & forecasts by application, 2018 - 2030 (USD million)
- TABLE 46 UK lubricants market estimates & forecasts, 2018 - 2030 (Kilo Tons) (USD million)
- TABLE 47 UK lubricants market estimates & forecasts by product, 2018 - 2030 (Kilo Tons)
- TABLE 48 UK lubricants market estimates & forecasts by product, 2018 - 2030 (USD million)
- TABLE 49 UK lubricants market estimates & forecasts by application, 2018 - 2030 (Kilo Tons)
- TABLE 50 UK lubricants market estimates & forecasts by application, 2018 - 2030 (USD million)
- TABLE 51 France lubricants market estimates & forecasts, 2018 - 2030 (Kilo Tons) (USD million)
- TABLE 52 France lubricants market estimates & forecasts by product, 2018 - 2030 (Kilo Tons)
- TABLE 53 France lubricants market estimates & forecasts by product, 2018 - 2030 (USD million)
- TABLE 54 France lubricants market estimates & forecasts by application, 2018 - 2030 (Kilo Tons)
- TABLE 55 France lubricants market estimates & forecasts by application, 2018 - 2030 (USD million)
- TABLE 56 Italy lubricants market estimates & forecasts, 2018 - 2030 (Kilo Tons) (USD million)
- TABLE 57 Italy lubricants market estimates & forecasts by product, 2018 - 2030 (Kilo Tons)
- TABLE 58 Italy lubricants market estimates & forecasts by product, 2018 - 2030 (USD million)
- TABLE 59 Italy lubricants market estimates & forecasts by application, 2018 - 2030 (Kilo Tons)
- TABLE 60 Italy lubricants market estimates & forecasts by application, 2018 - 2030 (USD million)
- TABLE 61 Spain lubricants market estimates & forecasts, 2018 - 2030 (Kilo Tons) (USD million)
- TABLE 62 Spain lubricants market estimates & forecasts by product, 2018 - 2030 (Kilo Tons)
- TABLE 63 Spain lubricants market estimates & forecasts by product, 2018 - 2030 (USD million)
- TABLE 64 Spain lubricants market estimates & forecasts by application, 2018 - 2030 (Kilo Tons)
- TABLE 65 Spain lubricants market estimates & forecasts by application, 2018 - 2030 (USD million)
- TABLE 66 Asia pacific lubricants market estimates & forecasts, 2018 - 2030 (Kilo Tons) (USD million)
- TABLE 67 Asia pacific lubricants market estimates & forecasts by product, 2018 - 2030 (Kilo Tons)
- TABLE 68 Asia pacific lubricants market estimates & forecasts by product, 2018 - 2030 (USD million)
- TABLE 69 Asia pacific lubricants market estimates & forecasts by application, 2018 - 2030 (Kilo Tons)
- TABLE 70 Asia pacific lubricants market estimates & forecasts by application, 2018 - 2030 (USD million)
- TABLE 71 China lubricants market estimates & forecast, 2018 - 2030 (Kilo Tons) (USD million)
- TABLE 72 China lubricants market estimates & forecasts by product, 2018 - 2030 (Kilo Tons)
- TABLE 73 China lubricants market estimates & forecasts by product, 2018 - 2030 (USD million)
- TABLE 74 China lubricants market estimates & forecasts by application, 2018 - 2030 (Kilo Tons)
- TABLE 75 China lubricants market estimates & forecasts by application, 2018 - 2030 (USD million)
- TABLE 76 India lubricants market estimates & forecast, 2018 - 2030 (Kilo Tons) (USD million)
- TABLE 77 India lubricants market estimates & forecasts by product, 2018 - 2030 (Kilo Tons)
- TABLE 78 India lubricants market estimates & forecasts by product, 2018 - 2030 (USD million)
- TABLE 79 India lubricants market estimates & forecasts by application, 2018 - 2030 (Kilo Tons)
- TABLE 80 India lubricants market estimates & forecasts by application, 2018 - 2030 (USD million)
- TABLE 81 Japan lubricants market estimates & forecast, 2018 - 2030 (Kilo Tons) (USD million)
- TABLE 82 Japan lubricants market estimates & forecasts by product, 2018 - 2030 (Kilo Tons)
- TABLE 83 Japan lubricants market estimates & forecasts by product, 2018 - 2030 (USD million)
- TABLE 84 Japan lubricants market estimates & forecasts by application, 2018 - 2030 (Kilo Tons)
- TABLE 85 Japan lubricants market estimates & forecasts by application, 2018 - 2030 (USD million)
- TABLE 86 South Korea lubricants market estimates & forecast, 2018 - 2030 (Kilo Tons) (USD million)
- TABLE 87 South Korea lubricants market estimates & forecasts by product, 2018 - 2030 (Kilo Tons)
- TABLE 88 South Korea lubricants market estimates & forecasts by product, 2018 - 2030 (USD million)
- TABLE 89 South Korea lubricants market estimates & forecasts by application, 2018 - 2030 (Kilo Tons)
- TABLE 90 South Korea lubricants market estimates & forecasts by application, 2018 - 2030 (USD million)
- TABLE 91 Latin America lubricants market estimates & forecasts, 2018 - 2030 (Kilo Tons) (USD million)
- TABLE 92 Latin America lubricants market estimates & forecasts by product, 2018 - 2030 (Kilo Tons)
- TABLE 93 Latin America lubricants market estimates & forecasts by product, 2018 - 2030 (USD million)
- TABLE 94 Latin America lubricants market estimates & forecasts by application, 2018 - 2030 (Kilo Tons)
- TABLE 95 Latin America lubricants market estimates & forecasts by application, 2018 - 2030 (USD million)
- TABLE 96 Brazil lubricants market estimates & forecast, 2018 - 2030 (Kilo Tons) (USD million)
- TABLE 97 Brazil lubricants market estimates & forecasts by product, 2018 - 2030 (Kilo Tons)
- TABLE 98 Brazil lubricants market estimates & forecasts by product, 2018 - 2030 (USD million)
- TABLE 99 Brazil lubricants market estimates & forecasts by application, 2018 - 2030 (Kilo Tons)
- TABLE 100 Brazil lubricants market estimates & forecasts by application, 2018 - 2030 (USD million)
- TABLE 101 Argentina lubricants market estimates & forecasts, 2018 - 2030 (Kilo Tons) (USD million)
- TABLE 102 Argentina lubricants market estimates & forecasts by product, 2018 - 2030 (Kilo Tons)
- TABLE 103 Argentina lubricants market estimates & forecasts by product, 2018 - 2030 (USD million)
- TABLE 104 Argentina lubricants market estimates & forecasts by application, 2018 - 2030 (Kilo Tons)
- TABLE 105 Argentina lubricants market estimates & forecasts by application, 2018 - 2030 (USD million)
- TABLE 106 Middle East & Africa lubricants market estimates & forecasts, 2018 - 2030 (Kilo Tons) (USD million)
- TABLE 107 Middle East & Africa lubricants market estimates & forecasts by product, 2018 - 2030 (Kilo Tons)
- TABLE 108 Middle East & Africa lubricants market estimates & forecasts by product, 2018 - 2030 (USD million)
- TABLE 109 Middle East & Africa lubricants market estimates & forecasts by application, 2018 - 2030 (Kilo Tons)
- TABLE 110 Middle East & Africa lubricants market estimates & forecasts by application, 2018 - 2030 (USD million)
- TABLE 111 Saudi Arabia lubricants market estimates & forecasts, 2018 - 2030 (Kilo Tons) (USD million)
- TABLE 112 Saudi Arabia lubricants market estimates & forecasts by product, 2018 - 2030 (Kilo Tons)
- TABLE 113 Saudi Arabia lubricants market estimates & forecasts by product, 2018 - 2030 (USD million)
- TABLE 114 Saudi Arabia lubricants market estimates & forecasts by application, 2018 - 2030 (Kilo Tons)
- TABLE 115 Saudi Arabia lubricants market estimates & forecasts by application, 2018 - 2030 (USD million)
- TABLE 116 South Africa lubricants market estimates & forecasts, 2018 - 2030 (Kilo Tons) (USD million)
- TABLE 117 South Africa lubricants market estimates & forecasts by product, 2018 - 2030 (Kilo Tons)
- TABLE 118 South Africa lubricants market estimates & forecasts by product, 2018 - 2030 (USD million)
- TABLE 119 South Africa lubricants market estimates & forecasts by application, 2018 - 2030 (Kilo Tons)
- TABLE 120 South Africa lubricants market estimates & forecasts by application, 2018 - 2030 (USD million)
List of Figures
- FIG. 1 Market segmentation
- FIG. 2 Information procurement
- FIG. 3 Data analysis models
- FIG. 4 Market formulation and validation
- FIG. 5 Data validating & publishing
- FIG. 6 Market snapshot
- FIG. 7 Segmental outlook - Application & Product
- FIG. 8 Competitive Outlook
- FIG. 9 Lubricants market outlook, 2018 - 2030 (USD Million)
- FIG. 10 Value chain analysis
- FIG. 11 Market dynamics
- FIG. 12 Porter's Analysis
- FIG. 13 PESTEL Analysis
- FIG. 14 Lubricants market, by product: Key takeaways
- FIG. 15 Lubricants market, by product: Market share, 2024 & 2030
- FIG. 16 Lubricants market, by application: Key takeaways
- FIG. 17 Lubricants market, by application: Market share, 2024 & 2030
- FIG. 18 Lubricants market: regional analysis, 2023
- FIG. 19 Lubricants market, by region: Key takeaways
Lubricants Market Growth & Trends:
The global lubricants market size is estimated to reach USD 180.2 billion by 2030, expanding at a CAGR of 3.8% from 2025 to 2030, according to a new report by Grand View Research, Inc. Growth in demand for biobased lubes owing to their eco-friendly characteristics is poised to pave way for higher demand over the coming years. Furthermore, the manufacturers are shifting and expanding their production units in developing nations owing to various factors, such as availability of raw materials and reduced infrastructure & labor costs. This, in turn, is anticipated to boost the market growth over the forecast period. Typical oil manufacturers use crude oil, CBM, tight oil, and other additives to formulate all types of lubricants.
Medical was the largest application for PEG, accounting for more than 40% of market share in 2022. Superior blending, hygroscopicity, and non-toxic properties of PEG have resulted in high demand for the chemical in numerous pharmaceutical products such as tablets and ointments. Increasing pharmaceutical expenditure, particularly in emerging economies of India, China, and Brazil, is expected to boost PEG market over the forecast period. Growing demand for paints & coatings coupled with the increasing use of PEG as a solvent due to its low VOC emissions is anticipated to fuel market growth over the next six years.
Economic growth in emerging markets, such as China, India, and Brazil, has led to the betterment of public transportation in these regions. This trend is expected to further strengthen commercial automotive lubricant demand. The Asia Pacific automotive industry is anticipated to witness a high growth rate over the forecast period owing to rapid economic development, mega construction projects, and the introduction of various favorable policies by the government, such as 100% FDI and "Smart Cities". Rapid industrial development and growing demand for high-performance luxurious passenger cars have also attracted heavy investments from international automotive players.
Companies, such as ExxonMobil and Chevron, are directly involved in the production of lubricants for specific applications, these companies are further involved in supply agreements with major end-users to ensure steady sales of lubricants. Companies, such as Total, Shell, Amsoil, and Castrol, have entered into exclusive supply agreements with Tata Motors & Vestas Wind Systems to supply their lubricant brands. Global as well as regional industry players are developing direct sales channels, especially for automotive lubricant users, at their local service centers. Some companies also participate in annual events of their end-users and showcase their products at offer prices.
Lubricants Market Report Highlights:
- The market is estimated significantly due to the increasing demand for automotive oils and greases on account of the growing trade of vehicles and their spare parts
- The automotive segment dominated the global industry in 2024 with the largest revenue share of 53.3%. This is attributed to the increased sales of consumer automobiles, such as buses, trucks, and other forms of passenger transport.
- Gas turbine oil is a high-performance oil created to help gas turbines run more efficiently and reliably while also enhancing the safety and productivity of power plant operations
- Asia Pacific dominated the market with a revenue share of 44.9% in 2024. A rising number of consumers is demanding advanced technological products with superior performance characteristics. This factor is conducive to market growth.
Table of Contents
Chapter 1. Methodology and Scope
- 1.1. Market Segmentation & Scope
- 1.2. Market Definition
- 1.3. Information Procurement
- 1.3.1. Information Analysis
- 1.3.2. Market Formulation & Data Visualization
- 1.3.3. Data Validation & Publishing
- 1.4. Research Scope and Assumptions
- 1.4.1. List of Data Sources
Chapter 2. Executive Summary
- 2.1. Market Snapshot
- 2.2. Segmental Outlook
- 2.3. Competitive Outlook
Chapter 3. Market Variables, Trends, and Scope
- 3.1. Global Lubricants Market Outlook
- 3.2. Value Chain Analysis
- 3.2.1. Raw Material Outlook
- 3.2.2. Automotive/Product Outlook
- 3.2.3. Sales Channel Analysis
- 3.3. Price Trend Analysis
- 3.3.1. Factors Influencing Prices
- 3.4. Regulatory Framework
- 3.4.1. Standards & Compliances
- 3.5. Market Dynamics
- 3.5.1. Market Driver Analysis
- 3.5.2. Market Restraint Analysis
- 3.5.3. Market Challenges Analysis
- 3.5.4. Market Opportunity Analysis
- 3.6. Porter's Five Forces Analysis
- 3.6.1. Bargaining Power of Suppliers
- 3.6.2. Bargaining Power of Buyers
- 3.6.3. Threat of Substitution
- 3.6.4. Threat of New Entrants
- 3.6.5. Competitive Rivalry
- 3.7. PESTLE Analysis
- 3.7.1. Political
- 3.7.2. Economic
- 3.7.3. Social Landscape
- 3.7.4. Product
- 3.7.5. Environmental
- 3.7.6. Legal
Chapter 4. Lubricants Market: Product Estimates & Trend Analysis
- 4.1. Lubricants Market: Product Movement Analysis, 2023 & 2030
- 4.2. Mineral Oil
- 4.2.1. Market estimates and forecasts, 2018 - 2030 (Kilo Tons) (USD Million)
- 4.3. Synthetic Oil
- 4.3.1. Market estimates and forecasts, 2018 - 2030 (Kilo Tons) (USD Million)
- 4.4. Bio-Based Oils
- 4.4.1. Market estimates and forecasts, 2018 - 2030 (Kilo Tons) (USD Million)
Chapter 5. Lubricants Market: Application Estimates & Trend Analysis
- 5.1. Lubricants Market: Application Movement Analysis, 2023 & 2030
- 5.2. Industrial
- 5.2.1. Market estimates and forecasts, 2018 - 2030 (Kilo Tons) (USD Million)
- 5.3. Automotive
- 5.3.1. Market estimates and forecasts, 2018 - 2030 (Kilo Tons) (USD Million)
- 5.4. Marines
- 5.4.1. Market estimates and forecasts, 2018 - 2030 (Kilo Tons) (USD Million)
- 5.5. Aerospace
- 5.5.1. Market estimates and forecasts, 2018 - 2030 (Kilo Tons) (USD Million)
- 5.6. Other Applications
- 5.6.1. Market estimates and forecasts, 2018 - 2030 (Kilo Tons) (USD Million)
Chapter 6. Lubricants Market: Regional Estimates & Trend Analysis
- 6.1. Regional Analysis, 2023 & 2030
- 6.2. North America
- 6.2.1. Market estimates and forecasts, 2018 - 2030 (Kilo Tons) (USD Million)
- 6.2.2. Market estimates and forecasts, by product, 2018 - 2030 (Kilo Tons) (USD Million)
- 6.2.3. Market estimates and forecasts, by application, 2018 - 2030 (Kilo Tons) (USD Million)
- 6.2.4. U.S.
- 6.2.4.1. Market estimates and forecasts, 2018 - 2030 (Kilo Tons) (USD Million)
- 6.2.4.2. Market estimates and forecasts, by product, 2018 - 2030 (Kilo Tons) (USD Million)
- 6.2.4.3. Market estimates and forecasts, by application, 2018 - 2030 (Kilo Tons) (USD Million)
- 6.2.5. Canada
- 6.2.5.1. Market estimates and forecasts, 2018 - 2030 (Kilo Tons) (USD Million)
- 6.2.5.2. Market estimates and forecasts, by product, 2018 - 2030 (Kilo Tons) (USD Million)
- 6.2.5.3. Market estimates and forecasts, by application, 2018 - 2030 (Kilo Tons) (USD Million)
- 6.2.6. Mexico
- 6.2.6.1. Market estimates and forecasts, 2018 - 2030 (Kilo Tons) (USD Million)
- 6.2.6.2. Market estimates and forecasts, by product, 2018 - 2030 (Kilo Tons) (USD Million)
- 6.2.6.3. Market estimates and forecasts, by application, 2018 - 2030 (Kilo Tons) (USD Million)
- 6.3. Europe
- 6.3.1. Market estimates and forecasts, 2018 - 2030 (Kilo Tons) (USD Million)
- 6.3.2. Market estimates and forecasts, by product, 2018 - 2030 (Kilo Tons) (USD Million)
- 6.3.3. Market estimates and forecasts, by application, 2018 - 2030 (Kilo Tons) (USD Million)
- 6.3.4. Germany
- 6.3.4.1. Market estimates and forecasts, 2018 - 2030 (Kilo Tons) (USD Million)
- 6.3.4.2. Market estimates and forecasts, by product, 2018 - 2030 (Kilo Tons) (USD Million)
- 6.3.4.3. Market estimates and forecasts, by application, 2018 - 2030 (Kilo Tons) (USD Million)
- 6.3.5. UK
- 6.3.5.1. Market estimates and forecasts, 2018 - 2030 (Kilo Tons) (USD Million)
- 6.3.5.2. Market estimates and forecasts, by product, 2018 - 2030 (Kilo Tons) (USD Million)
- 6.3.5.3. Market estimates and forecasts, by application, 2018 - 2030 (Kilo Tons) (USD Million)
- 6.3.6. France
- 6.3.6.1. Market estimates and forecasts, 2018 - 2030 (Kilo Tons) (USD Million)
- 6.3.6.2. Market estimates and forecasts, by product, 2018 - 2030 (Kilo Tons) (USD Million)
- 6.3.6.3. Market estimates and forecasts, by application, 2018 - 2030 (Kilo Tons) (USD Million)
- 6.3.7. Italy
- 6.3.7.1. Market estimates and forecasts, 2018 - 2030 (Kilo Tons) (USD Million)
- 6.3.7.2. Market estimates and forecasts, by product, 2018 - 2030 (Kilo Tons) (USD Million)
- 6.3.7.3. Market estimates and forecasts, by application, 2018 - 2030 (Kilo Tons) (USD Million)
- 6.3.8. Spain
- 6.3.8.1. Market estimates and forecasts, 2018 - 2030 (Kilo Tons) (USD Million)
- 6.3.8.2. Market estimates and forecasts, by product, 2018 - 2030 (Kilo Tons) (USD Million)
- 6.3.8.3. Market estimates and forecasts, by application, 2018 - 2030 (Kilo Tons) (USD Million)
- 6.4. Asia Pacific
- 6.4.1. Market estimates and forecasts, 2018 - 2030 (Kilo Tons) (USD Million)
- 6.4.2. Market estimates and forecasts, by product, 2018 - 2030 (Kilo Tons) (USD Million)
- 6.4.3. Market estimates and forecasts, by application, 2018 - 2030 (Kilo Tons) (USD Million)
- 6.4.4. China
- 6.4.4.1. Market estimates and forecasts, 2018 - 2030 (Kilo Tons) (USD Million)
- 6.4.4.2. Market estimates and forecasts, by product, 2018 - 2030 (Kilo Tons) (USD Million)
- 6.4.4.3. Market estimates and forecasts, by application, 2018 - 2030 (Kilo Tons) (USD Million)
- 6.4.5. India
- 6.4.5.1. Market estimates and forecasts, 2018 - 2030 (Kilo Tons) (USD Million)
- 6.4.5.2. Market estimates and forecasts, by product, 2018 - 2030 (Kilo Tons) (USD Million)
- 6.4.5.3. Market estimates and forecasts, by application, 2018 - 2030 (Kilo Tons) (USD Million)
- 6.4.6. Japan
- 6.4.6.1. Market estimates and forecasts, 2018 - 2030 (Kilo Tons) (USD Million)
- 6.4.6.2. Market estimates and forecasts, by product, 2018 - 2030 (Kilo Tons) (USD Million)
- 6.4.6.3. Market estimates and forecasts, by application, 2018 - 2030 (Kilo Tons) (USD Million)
- 6.4.7. South Korea
- 6.4.7.1. Market estimates and forecasts, 2018 - 2030 (Kilo Tons) (USD Million)
- 6.4.7.2. Market estimates and forecasts, by product, 2018 - 2030 (Kilo Tons) (USD Million)
- 6.4.7.3. Market estimates and forecasts, by application, 2018 - 2030 (Kilo Tons) (USD Million)
- 6.5. Latin America
- 6.5.1. Market estimates and forecasts, 2018 - 2030 (Kilo Tons) (USD Million)
- 6.5.2. Market estimates and forecasts, by product, 2018 - 2030 (Kilo Tons) (USD Million)
- 6.5.3. Market estimates and forecasts, by application, 2018 - 2030 (Kilo Tons) (USD Million)
- 6.5.4. Brazil
- 6.5.4.1. Market estimates and forecasts, 2018 - 2030 (Kilo Tons) (USD Million)
- 6.5.4.2. Market estimates and forecasts, by product, 2018 - 2030 (Kilo Tons) (USD Million)
- 6.5.4.3. Market estimates and forecasts, by application, 2018 - 2030 (Kilo Tons) (USD Million)
- 6.5.5. Argentina
- 6.5.5.1. Market estimates and forecasts, 2018 - 2030 (Kilo Tons) (USD Million)
- 6.5.5.2. Market estimates and forecasts, by product, 2018 - 2030 (Kilo Tons) (USD Million)
- 6.5.5.3. Market estimates and forecasts, by application, 2018 - 2030 (Kilo Tons) (USD Million)
- 6.6. Middle East & Africa
- 6.6.1. Market estimates and forecasts, 2018 - 2030 (Kilo Tons) (USD Million)
- 6.6.2. Market estimates and forecasts, by product, 2018 - 2030 (Kilo Tons) (USD Million)
- 6.6.3. Market estimates and forecasts, by application, 2018 - 2030 (Kilo Tons) (USD Million)
- 6.6.4. Saudi Arabia
- 6.6.4.1. Market estimates and forecasts, 2018 - 2030 (Kilo Tons) (USD Million)
- 6.6.4.2. Market estimates and forecasts, by product, 2018 - 2030 (Kilo Tons) (USD Million)
- 6.6.4.3. Market estimates and forecasts, by application, 2018 - 2030 (Kilo Tons) (USD Million)
- 6.6.5. South Africa
- 6.6.5.1. Market estimates and forecasts, 2018 - 2030 (Kilo Tons) (USD Million)
- 6.6.5.2. Market estimates and forecasts, by product, 2018 - 2030 (Kilo Tons) (USD Million)
- 6.6.5.3. Market estimates and forecasts, by application, 2018 - 2030 (Kilo Tons) (USD Million)
Chapter 7. Competitive Landscape
- 7.1. Recent Developments by Key Market Participants
- 7.2. Company Categorization
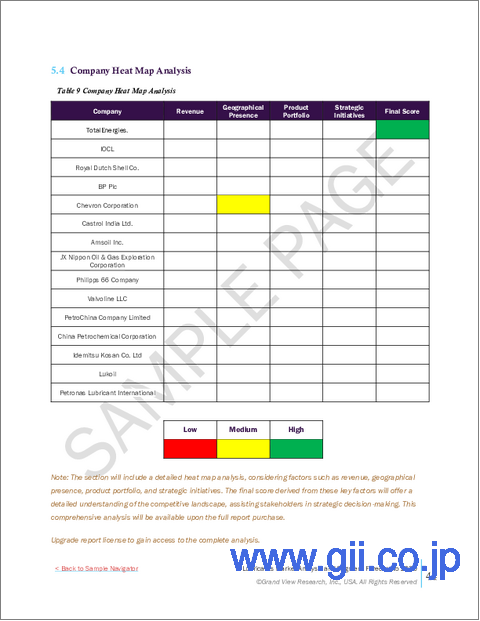
- 7.3. Company Heat Map Analysis
- 7.4. Company Market Positioning Analysis, 2024
- 7.5. Strategy Mapping
- 7.6. Company Profiles/Listing
- 7.6.1. ExxonMobil Corp.
- 7.6.1.1. Company Overview
- 7.6.1.2. Financial Performance
- 7.6.1.3. Product Benchmarking
- 7.6.2. Royal Dutch Shell Co.
- 7.6.2.1. Company Overview
- 7.6.2.2. Financial Performance
- 7.6.2.3. Product Benchmarking
- 7.6.3. BP PLC
- 7.6.3.1. Company Overview
- 7.6.3.2. Financial Performance
- 7.6.3.3. Product Benchmarking
- 7.6.4. TotalEnergies
- 7.6.4.1. Company Overview
- 7.6.4.2. Financial Performance
- 7.6.4.3. Product Benchmarking
- 7.6.5. Chevron Corp
- 7.6.5.1. Company Overview
- 7.6.5.2. Financial Performance
- 7.6.5.3. Product Benchmarking
- 7.6.6. Fuchs
- 7.6.6.1. Company Overview
- 7.6.6.2. Financial Performance
- 7.6.6.3. Product Benchmarking
- 7.6.7. Castrol India Limited
- 7.6.7.1. Company Overview
- 7.6.7.2. Financial Performance
- 7.6.7.3. Product Benchmarking
- 7.6.8. Amsoil Inc.
- 7.6.8.1. Company Overview
- 7.6.8.2. Financial Performance
- 7.6.8.3. Product Benchmarking
- 7.6.9. JX Nippon & Gas Exploration Corp.
- 7.6.9.1. Company Overview
- 7.6.9.2. Financial Performance
- 7.6.9.3. Product Benchmarking
- 7.6.10. Phillips 66 Company
- 7.6.10.1. Company Overview
- 7.6.10.2. Financial Performance
- 7.6.10.3. Product Benchmarking
- 7.6.11. Valvoline LLC
- 7.6.11.1. Company Overview
- 7.6.11.2. Financial Performance
- 7.6.11.3. Product Benchmarking
- 7.6.12. PetroChina Company Ltd.
- 7.6.12.1. Company Overview
- 7.6.12.2. Financial Performance
- 7.6.12.3. Product Benchmarking
- 7.6.1. ExxonMobil Corp.

