|
|
市場調査レポート
商品コード
1511945
ナノ材料の市場規模、シェア、動向分析レポート:材料別、用途別、地域別、セグメント予測、2024年~2030年Nanomaterials Market Size, Share & Trends Analysis Report By Material (Gold, Silver, Iron, Copper), By Application (Aerospace, Automotive, Medical), By Region, And Segment Forecasts, 2024 - 2030 |
||||||
|
|||||||
カスタマイズ可能
|
|||||||

| ナノ材料の市場規模、シェア、動向分析レポート:材料別、用途別、地域別、セグメント予測、2024年~2030年 |
|
出版日: 2024年06月24日
発行: Grand View Research
ページ情報: 英文 135 Pages
納期: 2~10営業日
|

全表示
- 概要
- 図表
- 目次
ナノ材料市場の成長と動向:
Grand View Research, Inc.の最新レポートによると、世界のナノ材料市場規模は2030年までに327億7,000万米ドルに達し、2024年から2030年にかけてCAGR 15.0%で拡大すると予測されています。
この成長の背景には、エレクトロニクス、バイオメディカル、ドラッグデリバリー、光学分野での同製品の幅広い既存および潜在的用途があります。さらに、ナノテクノロジーはヘルスケア産業において、抗感染症、神経学、心臓血管障害など様々な用途で広く使用されています。
ナノテクノロジーはまた、ナノセンサー、ナノファイバー、ナノチューブを作るためにエレクトロニクス産業でも広く使われています。また、3Dプリント・バッテリー、生分解性電極、髪の毛1本を包み込むことができる超柔軟チップなどにも使われています。この技術は、廃水処理や水システムからの浮遊金属粒子の除去にも使われています。
ヘルスケア技術の急速な進歩、医療診断業界の成長、医療画像用途における様々な利点が市場を牽引すると予想されます。さらに、ナノテクノロジーに関する研究への注目の高まりや、バイオテクノロジーや医薬品の研究開発に対する政府支出の増加は、予測期間にわたって世界のナノ材料市場の成長を増大させると予想されます。
ナノ材料は主に商業および研究目的で合成されます。必要な原材料は、大規模生産の場合は商業メーカーが、小規模生産の場合は研究室が調達します。ナノ材料は研究目的で研究所で製造され、そこでこれらのナノ粒子が研究され、潜在的な用途が探索されます。
酸化アルミニウム・ナノ材料は、機械的応力、化学物質、摩耗に対する優れた耐性など、その卓越した構造的・物理化学的特性により、多様な用途に使用されています。さらに、良好な光学特性を示し、大きな表面積を持っています。酸化アルミニウム・ナノ粒子は、調製コストが低く、入手や取り扱いが容易であるため、予測期間中、世界的に需要がさらに高まると予想されます。
ナノ粒子の毒性評価は、業界が直面する主要な阻害要因の1つになると予想されます。ナノ粒子の研究と生産の増加は、異なる暴露、生物学的および投与条件下でのナノ粒子の毒性を評価するための、より信頼性の高い標準化された方法の必要性を増大させる結果となった。
ナノ材料は、Fisher ScientificやBIO Scientific Pty Ltdのような販売業者のネットワークを通じてエンドユーザーに供給されます。販売業者は、バイオメディカル、エネルギー、電子機器、廃水処理など、いくつかのエンドユーザー産業に製品を供給しています。大学の研究室でナノ材料が製造され、自家消費される場合もあります。しかし、これらの大学は、バイオメディカル、エレクトロニクス、エネルギー用途の研究を行うために、Nanoshel Inc.などの商業メーカーから最終製品を調達することもあります。
ナノ材料市場レポートハイライト
- 材料別では、チタン(Ti)ナノ材料セグメントは予測期間中にCAGR 16.3%で成長すると予想されます。化学産業は、特に酸化性酸の存在下で優れた耐食性を発揮するため、チタンナノ材料の最大のユーザーです。航空宇宙産業は、その高い強度と低密度、高温(および極低温)に耐える能力により、これらのナノ材料の第二位のユーザーです。
- 塗料・コーティング用途分野の2023年の収益は20億2,000万米ドルで、予測期間中にCAGR 13.4%で成長すると予想されています。新しいナノベースのコーティングは、表面を機能化し、保護を提供するために広く使用されています。
- 欧州は、2023年に28億1,000万米ドルの収益を占め、英国内の製薬産業からの需要増加により、予測期間中にCAGR 11.8%で成長すると予測されています。さらに、再生可能エネルギーを効率的に利用するための技術的進歩を実施するためのドイツでの投資の増加は、有機太陽電池の効率を向上させるナノ材料の能力と相まって、この地域におけるナノ材料市場の成長にプラスの影響を与えると予想されています。
- 有力企業は、世界のナノ材料市場で競争力を維持するために、生産能力や事業の拡大、提携、M&A、製品や用途の開拓など、さまざまな事業戦略を駆使しています。さらに、いくつかの企業や大学は、ナノ材料の医薬品や病気の診断への応用を見出すための研究開発活動に従事しています。
目次
第1章 調査手法と範囲
第2章 エグゼクティブサマリー
第3章 ナノ材料市場の変数、動向、範囲
- 市場関連見通し
- 金ナノ材料市場
- 業界バリューチェーン分析
- 販売チャネル分析
- 技術概要
- ゾルゲル法
- 逆ミセル
- 共沈
- 共重合体テンプレート
- 規制の枠組み
- アナリストの視点
- 市場力学
- 市場 促進要因分析
- 市場抑制要因分析
- 業界の機会
- 業界の課題
- ビジネス環境ツール分析:ナノ材料市場
- ポーターのファイブフォース分析
- SWOTによるPESTLE分析
- 市場混乱分析
第4章 ナノ材料市場:材料推定・動向分析
- 重要なポイント
- 2023年と2030年の物質変動分析と市場シェア
- 世界のナノ材料市場(材料別、2018年~2030年)
- 金(Au)
- 銀(Ag)
- 鉄(Fe)
- 銅(Cu)
- プラチナ(Pt)
- チタン(Ti)
- ニッケル(Ni)
- 酸化アルミニウム
- アンチモンスズ酸化物
- 酸化ビスマス
- カーボンナノチューブ
- その他のナノ材料
第5章 ナノ材料市場:用途の推定・動向分析
- 重要なポイント
- 用途変動分析と市場シェア、2023年と2030年
- 世界のナノ材料市場(用途別、2018年~2030年)
- 航空宇宙
- 自動車
- 医学
- エネルギーと電力
- エレクトロニクス
- 塗料とコーティング
- その他の用途
第6章 ナノ材料市場:地域推定・動向分析
- 重要なポイント
- 地域別市場シェア分析、2023年および2030年
- 北米
- 北米のナノ材料市場推計・予測、2018年-2030年
- 材料別、2018年-2030年
- 用途別、2018年-2030年
- 米国
- カナダ
- メキシコ
- 欧州
- 欧州のナノ材料市場の推定と予測、2018年-2030年
- 材料別、2018年-2030年
- 用途別、2018年-2030年
- ドイツ
- 英国
- フランス
- アジア太平洋
- アジア太平洋のナノ材料市場の推定と予測、2018年-2030年
- 材料別、2018年-2030年
- 用途別、2018年-2030年
- 中国
- インド
- 日本
- 中南米
- 中南米ナノ材料市場の推定と予測、2018年-2030年
- 材料別、2018年-2030年
- 用途別、2018年-2030年
- ブラジル
- 中東・アフリカ
- 中東・アフリカのナノ材料市場の推定と予測、2018年-2030年
- 材料別、2018年-2030年
- 用途別、2018年-2030年
第7章 競合情勢
- 主要プレーヤー、その最近の動向、そして業界への影響
- 主要企業/競合の分類
- 企業の市況分析
- 企業ヒートマップ分析
- 戦略マッピング
- 企業リスト
- Strem
- American Elements
- US Research Nanomaterials, Inc.
- nanoComposix
- Frontier Carbon Solutions, LLC.
- Nanoshel LLC
- SkySpring Nanomaterials, Inc.
- Nanophase Technologies Corporation
- Cytodiagnostics Inc
- Quantum Materials Corporation
List of Tables
- Table 1 Gold (Au) nanomaterials market estimates and forecasts, 2018 - 2030 (USD Million)
- Table 2 Silver (Ag) Nanomaterials Market Estimates and Forecasts, 2018 - 2030 (USD Million)
- Table 3 Fe (Iron) Nanomaterials Market Estimates and Forecasts, 2018 - 2030 (USD Million)
- Table 4 Cu (Copper) Nanomaterials Market Estimates and Forecasts, 2018 - 2030 (USD Million)
- Table 5 Platinum (Pt) nanomaterials market estimates and forecasts, 2018 - 2030 (USD Million)
- Table 6 Titanium (Ti) nanomaterials market estimates and forecasts, 2018 - 2030 (USD Million)
- Table 7 Nickel (Ni) nanomaterials market estimates and forecasts, 2018 - 2030 (USD Million)
- Table 8 Aluminum Oxide Nanomaterials Market Estimates and Forecasts, 2018 - 2030 (USD Million)
- Table 9 Antimony Tin Oxide Nanomaterials Market Estimates and Forecasts, 2018 - 2030 (USD Million)
- Table 10 Bismuth Oxide Nanomaterials Market Estimates and Forecasts, 2018 - 2030 (USD Million)
- Table 11 Carbon Nanotubes Market Estimates and Forecasts, 2018 - 2030 (USD Million)
- Table 12 Other Nanomaterials Market Estimates and Forecasts, 2018 - 2030 (USD Million)
- Table 13 Nanomaterials market estimates and forecasts for aerospace applications, (USD Million)
- Table 14 Nanomaterials market estimates and forecasts for automotive applications, (USD Million)
- Table 15 Nanomaterials market estimates and forecasts for medical applications, (USD Million)
- Table 16 Nanomaterials market estimates and forecasts for energy & power applications, (USD Million)
- Table 17 Nanomaterials market estimates and forecasts for electronics applications, (USD Million)
- Table 18 Nanomaterials market estimates and forecasts for paints & coatings applications, (USD Million)
- Table 19 Nanomaterials market estimates and forecasts for other applications, (USD Million)
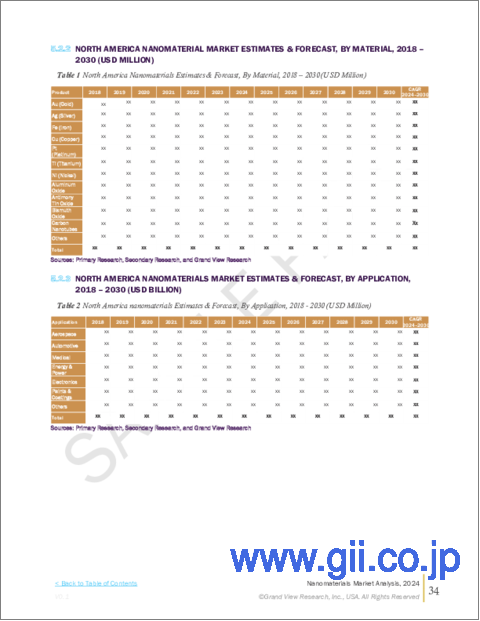
- Table 20 North America nanomaterials market estimates & forecasts, 2018 - 2030 (USD Million)
- Table 21 North America nanomaterials market estimates & forecasts, by material, 2018 - 2030 (USD Million)
- Table 22 North America nanomaterials market estimates & forecasts, by application, 2018 - 2030 (USD Million)
- Table 23 U.S. nanomaterials market estimates & forecasts, 2018 - 2030 (USD Million)
- Table 24 U.S. nanomaterials market estimates & forecasts, by material, 2018 - 2030 (USD Million)
- Table 25 U.S. nanomaterials market estimates & forecasts, by application, 2018 - 2030 (USD Million)
- Table 26 Canada nanomaterials market estimates & forecasts, 2018 - 2030 (USD Million)
- Table 27 Canada nanomaterials market estimates & forecasts, by material, 2018 - 2030 (USD Million)
- Table 28 Canada nanomaterials market estimates & forecasts, by application, 2018 - 2030 (USD Million)
- Table 29 Mexico nanomaterials market estimates & forecasts, 2018 - 2030 (USD Million)
- Table 30 Mexico nanomaterials market estimates & forecasts, by material, 2018 - 2030 (USD Million)
- Table 31 Mexico nanomaterials market estimates & forecasts, by application, 2018 - 2030 (USD Million)
- Table 32 Europe nanomaterials market estimates & forecasts, 2018 - 2030 (USD Million)
- Table 33 Europe nanomaterials market estimates & forecasts, by material, 2018 - 2030 (USD Million)
- Table 34 Europe nanomaterials market estimates & forecasts, by application, 2018 - 2030 (USD Million)
- Table 35 UK nanomaterials market estimates & forecasts, 2018 - 2030 (USD Million)
- Table 36 UK nanomaterials market estimates & forecasts, by material, 2018 - 2030 (USD Million)
- Table 37 UK nanomaterials market estimates & forecasts, by application, 2018 - 2030 (USD Million)
- Table 38 Germany nanomaterials market estimates & forecasts, 2018 - 2030 (USD Million)
- Table 39 Germany nanomaterials market estimates & forecasts, by material, 2018 - 2030 (USD Million)
- Table 40 Germany nanomaterials market estimates & forecasts, by application, 2018 - 2030 (USD Million)
- Table 41 France nanomaterials market estimates & forecasts, 2018 - 2030 (USD Million)
- Table 42 France nanomaterials market estimates & forecasts, by material, 2018 - 2030 (USD Million)
- Table 43 France nanomaterials market estimates & forecasts, by application, 2018 - 2030 (USD Million)
- Table 44 Asia Pacific nanomaterials market estimates & forecasts, 2018 - 2030 (USD Million)
- Table 45 Asia Pacific nanomaterials market estimates & forecasts, by material, 2018 - 2030 (USD Million)
- Table 46 Asia Pacific nanomaterials market estimates & forecasts, by application, 2018 - 2030 (USD Million)
- Table 47 China nanomaterials market estimates & forecasts, 2018- 2030 (USD Million)
- Table 48 China nanomaterials market estimates & forecasts, by material, 2018 - 2030 (USD Million)
- Table 49 China nanomaterials market estimates & forecasts, by application, 2018 - 2030 (USD Million)
- Table 50 India nanomaterials market estimates & forecasts, 2018 - 2030 (USD Million)
- Table 51 India nanomaterials market estimates & forecasts, by material, 2018 - 2030 (USD Million)
- Table 52 India nanomaterials market estimates & forecasts, by application, 2018 - 2030 (USD Million)
- Table 53 Japan nanomaterials market estimates & forecasts, 2018 - 2030 (USD Million)
- Table 54 Japan nanomaterials market estimates & forecasts, by material, 2018 - 2030 (USD Million)
- Table 55 Japan nanomaterials market estimates & forecasts, by application, 2018 - 2030 (USD Million)
- Table 56 Central & South America nanomaterials market estimates & forecasts, 2018 - 2030 (USD Million)
- Table 57 Central & South America nanomaterials market estimates & forecasts, by material, 2018 - 2030 (USD Million)
- Table 58 Central & South America nanomaterials market estimates & forecasts, by application, 2018 - 2030 (USD Million)
- Table 59 Brazil nanomaterials market estimates & forecasts, 2018 - 2030 (USD Million)
- Table 60 Brazil nanomaterials market estimates & forecasts, by material, 2018 - 2030 (USD Million)
- Table 61 Brazil nanomaterials market estimates & forecasts, by application, 2018 - 2030 (USD Million)
- Table 62 Middle East & Africa nanomaterials market estimates & forecasts, 2018 - 2030 (USD Million)
- Table 63 Middle East & Africa nanomaterials market estimates & forecasts, by material, 2018 - 2030 (USD Million)
- Table 64 Middle East & Africa nanomaterials market estimates & forecasts, by application, 2018 - 2030 (USD Million)
List of Figures
- Fig. 1 Information Procurement
- Fig. 2 Primary Research Pattern
- Fig. 3 Primary Research Process
- Fig. 4 Market Research Approaches - Bottom-Up Approach
- Fig. 5 Market Research Approaches - Top-Down Approach
- Fig. 6 Market Research Approaches - Combined Approach
- Fig. 7 Market Snapshot
- Fig. 8 Segmental Outlook
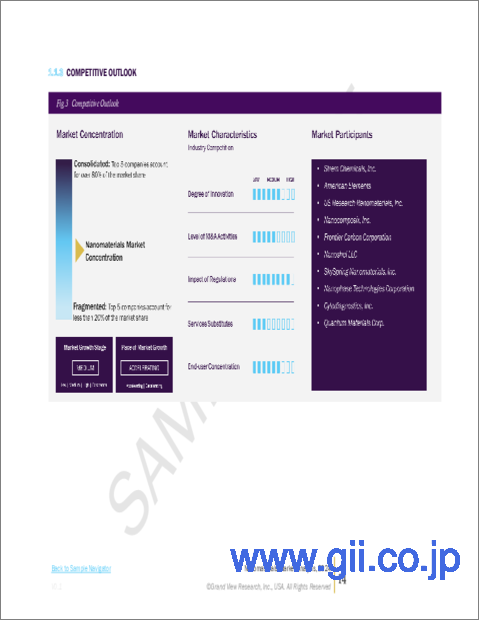
- Fig. 9 Competitive Outlook
- Fig. 10 Nanomaterials Market - Penetration & Growth Prospect Mapping
- Fig. 11 Nanomaterials Market - Value Chain Analysis
- Fig. 12 Market Drivers
- Fig. 13 Global Medical Device Market Share, By Region, 2023 (%)
- Fig. 14 Market Restraint
- Fig. 15 Nanomaterials Market: Material Movement Analysis, 2023 & 2030
- Fig. 16 Nanomaterials Market: Application Movement Analysis, 2023 & 2030
- Fig. 17 Nanomaterials Market: Regional Movement Analysis, 2023 & 2030
- Fig. 18 Competition Categorization
- Fig. 19 Company Market Positioning
- Fig. 20 Strategy Mapping, 2023
Nanomaterials Market Growth & Trends:
The global nanomaterials market size is expected to reach USD 32.77 billion by 2030 and expanding at a CAGR 15.0% from 2024 to 2030, according to a new report by Grand View Research, Inc. This growth can be attributed to a wide range of existing and potential applications of the product in electronics, biomedical, drug delivery, and optical fields. In addition, nanotechnology is extensively used in the healthcare industry in various applications such as anti-infective, neurology, and cardiovascular disorders.
Nanotechnology is also widely used in the electronics industry to make nanosensors, nanofibers, and nanotubes. It is also used in 3D-printed batteries, biodegradable electrodes, and super flexible chips capable of encircling a hair strand. This technology is also used in wastewater treatment and the removal of suspended metal particles from water systems.
Rapid advancements in healthcare technology, growth in the medical diagnostics industry, and various benefits in medical imaging applications are anticipated to drive the market. Furthermore, increased focus on research pertaining to nanotechnology and rising government expenditure on biotechnology and pharmaceutical research & development are expected to augment the growth of the global nanomaterials market over the forecast period.
Nanomaterials are mainly synthesized for commercial and research purposes. The required raw materials are procured by commercial manufacturers for large-scale production or by research laboratories for small-scale production. Nanomaterials are produced in laboratories for research purposes, wherein these nanoparticles are studied and explored for potential applications.
Aluminum oxide nanomaterials are used in a diverse range of applications owing to their exceptional structural and/or physicochemical properties, including superior resistance to mechanical stress, chemicals, and wear. In addition, they exhibit favorable optical properties and have large surface areas. The low cost of preparation and the ease of availability and handling of aluminum oxide nanoparticles are expected to further drive their demand globally during the forecast period.
Toxicity assessment of the nanoparticles is expected to be one of the major restraints faced by the industry. The increasing research and production of nanoparticles have resulted in augmenting the need for more reliable and standardized methods for evaluating the toxicity of the nanoparticles under different exposure, biological, and dosing conditions.
Nanomaterials are supplied to end-users through a network of distributors such as Fisher Scientific and BIO Scientific Pty Ltd. Distributors supply the product to several end-user industries such as biomedical, energy, electronic, and wastewater treatment. In some cases, nanomaterials are manufactured in university laboratories for captive consumption. However, these universities also procure the end product from commercial manufacturers such as Nanoshel Inc. to conduct research in biomedical, electronics, and energy applications.
Nanomaterials Market Report Highlights:
- Based on material, Titanium (Ti) nanomaterials segment is expected to grow at a CAGR of 16.3% over the forecast period. The chemicals industry is the largest user of titanium nanomaterials owing to their excellent corrosion resistance, particularly in the presence of oxidizing acids. The aerospace industry is the second-largest user of these nanomaterials owing to their high strength and low density, as well as their ability to withstand high (and cryogenic) temperatures.
- Paints & coatings application segment had a revenue of USD 2.02 billion in 2023 and is expected to grow at a CAGR of 13.4% over the forecast period. Novel nano-based coatings are widely used to functionalize surfaces and provide protection, which is expected to grow the demand for nanomaterials over the forecast period.
- Europe accounted for revenue of USD 2.81 billion in 2023 and is expected to grow at a CAGR of 11.8% over the forecast period owing to the growing demand from the pharmaceuticals industry within the UK. Furthermore, rising investments in Germany to carry out technological advancements for efficiently harnessing renewable energy, coupled with the ability of nanomaterials to increase the efficiency of organic solar cells, are anticipated to have a positive impact on the growth of the nanomaterials market in the region.
- Prominent players have been using a variety of business strategies such as capacity and business expansion, collaborations, mergers and acquisitions, and product and application development to stay competitive in the global nanomaterials market. In addition, several companies and universities are engaged in R&D activities to find the application of nanomaterials in drugs and diagnostics of diseases.
Table of Contents
Chapter 1. Methodology and Scope
- 1.1. Research Methodology
- 1.2. Research Scope & Assumption
- 1.3. Information Procurement
- 1.3.1. Purchased Database
- 1.3.2. GVR's Internal Database
- 1.3.3. Secondary Sources & Third-Party Perspectives
- 1.3.4. Primary Research
- 1.4. Information Analysis
- 1.4.1. Data Analysis Models
- 1.5. Market Formulation & Data Visualization
- 1.6. List of Data Sources
Chapter 2. Executive Summary
- 2.1. Market Outlook, 2023 (USD Million)
- 2.2. Segmental Outlook
- 2.3. Competitive Insights
Chapter 3. Nanomaterials Market Variables, Trends & Scope
- 3.1. Market Ancillary Outlook
- 3.1.1. Gold Nanomaterials Market
- 3.2. Industry Value Chain Analysis
- 3.3. Sales Channel Analysis
- 3.4. Technological Overview
- 3.4.1. Sol-Gel Method
- 3.4.2. Reverse Micelle
- 3.4.3. Co-Precipitation
- 3.4.4. Copolymer Template
- 3.5. Regulatory Framework
- 3.5.1. Analyst Perspective
- 3.6. Market Dynamics
- 3.6.1. Market Driver Analysis
- 3.6.1.1. Rapid Technological Advancements in Medical Industry
- 3.6.1.2. Increasing Penetration of Nanotechnology in Various Applications
- 3.6.2. Market Restraint Analysis
- 3.6.2.1. Toxicity Assessment of Nanomaterials
- 3.6.3. Industry Opportunities
- 3.6.4. Industry Challenges
- 3.6.1. Market Driver Analysis
- 3.7. Business Environmental Tools Analysis: Nanomaterials market
- 3.7.1. Porter's Five Forces Analysis
- 3.7.1.1. Bargaining Power of Suppliers
- 3.7.1.2. Bargaining Power of Buyers
- 3.7.1.3. Threat of Substitution
- 3.7.1.4. Threat of New Entrants
- 3.7.1.5. Competitive Rivalry
- 3.7.2. PESTLE Analysis, by SWOT
- 3.7.2.1. Political Landscape
- 3.7.2.2. Economic Landscape
- 3.7.2.3. Social Landscape
- 3.7.2.4. Technology Landscape
- 3.7.2.5. Environmental Landscape
- 3.7.2.6. Legal Landscape
- 3.7.1. Porter's Five Forces Analysis
- 3.8. Market Disruption Analysis
Chapter 4. Nanomaterials Market: Material Estimates & Trend Analysis
- 4.1. Key Takeaways
- 4.2. Material movement analysis & market share, 2023 & 2030
- 4.3. Global Nanomaterials market by material, 2018 - 2030 (USD Million)
- 4.4. Gold (Au)
- 4.4.1. Gold (Au) Nanomaterials Market Estimates And Forecasts, 2018 - 2030 (USD Million)
- 4.5. Silver (Ag)
- 4.5.1. Silver (Ag) Nanomaterials Market Estimates And Forecasts, 2018 - 2030 (USD Million)
- 4.6. Iron (Fe)
- 4.6.1. Iron (Fe) Nanomaterials Market Estimates And Forecasts, 2018 - 2030 (USD Million)
- 4.7. Copper (Cu)
- 4.7.1. Copper (Cu) Nanomaterials Market Estimates And Forecasts, 2018 - 2030 (USD Million)
- 4.8. Platinum (Pt)
- 4.8.1. Platinum (Pt) Nanomaterials Market Estimates And Forecasts, 2018 - 2030 (USD Million)
- 4.9. Titanium (Ti)
- 4.9.1. Titanium (Ti) Nanomaterials Market Estimates And Forecasts, 2018 - 2030 (USD Million)
- 4.10. Nickel (Ni)
- 4.10.1. Nickel (Ni) Nanomaterials Market Estimates And Forecasts, 2018 - 2030 (USD Million)
- 4.11. Aluminum Oxide
- 4.11.1. Aluminum Oxide Nanomaterials Market Estimates And Forecasts, 2018 - 2030 (USD Million)
- 4.12. Antimony Tin Oxide
- 4.12.1. Antimony Tin Oxide Nanomaterials Market Estimates And Forecasts, 2018 - 2030 (USD Million)
- 4.13. Bismuth Oxide
- 4.13.1. Bismuth Oxide Nanomaterials Market Estimates And Forecasts, 2018 - 2030 (USD Million)
- 4.14. Carbon Nanotubes
- 4.14.1. Carbon Nanotubes Market Estimates And Forecasts, 2018 - 2030 (USD Million)
- 4.15. Other Nanomaterials
- 4.15.1. Other Nanomaterials Market Estimates And Forecasts, 2018 - 2030 (USD Million)
Chapter 5. Nanomaterials Market: Application Estimates & Trend Analysis
- 5.1. Key Takeaways
- 5.2. Application movement analysis & market share, 2023 & 2030
- 5.3. Global Nanomaterials market by application, 2018 - 2030 (USD Million)
- 5.4. Aerospace
- 5.4.1. Nanomaterials Market Estimates And Forecasts For Aerospace, 2018 - 2030 (USD Million)
- 5.5. Automotive
- 5.5.1. Nanomaterials Market Estimates And Forecasts For Automotive, 2018 - 2030 (USD Million
- 5.6. Medical
- 5.6.1. Nanomaterials Market Estimates And Forecasts For Medical, 2018 - 2030 (USD Million)
- 5.7. Energy & Power
- 5.7.1. Nanomaterials Market Estimates And Forecasts For Energy & Power, 2018 - 2030 (USD Million)
- 5.8. Electronics
- 5.8.1. Nanomaterials Market Estimates And Forecasts For Electronics, 2018 - 2030 (USD Million)
- 5.9. Paints & Coatings
- 5.9.1. Nanomaterials Market Estimates And Forecasts For Paints & Coatings, 2018 - 2030 (USD Million)
- 5.10. Other Applications
- 5.10.1. Nanomaterials Market Estimates And Forecasts For Other Applications, 2018 - 2030 (USD Million)
Chapter 6. Nanomaterials Market: Regional Estimates & Trend Analysis
- 6.1. Key Takeaways
- 6.2. Regional Market Share Analysis, 2023 & 2030
- 6.3. North America
- 6.3.1. North America Nanomaterials Market Estimates And Forecasts, 2018 - 2030 (USD Million)
- 6.3.2. North America Nanomaterials Market Estimates & Forecasts, By Material, 2018 - 2030 (USD Million)
- 6.3.3. North America Nanomaterials Market Estimates & Forecasts, By Application, 2018 - 2030 (USD Million)
- 6.3.4. U.S.
- 6.3.4.1. U.S. Nanomaterials Market Estimates & Forecasts, 2018 - 2030 (USD Million)
- 6.3.4.2. U.S. Nanomaterials Market Estimates & Forecasts, By Material, 2018 - 2030 (USD Million)
- 6.3.4.3. U.S. Nanomaterials Market Estimates & Forecasts, By Application, 2018 - 2030 (USD Million)
- 6.3.5. Canada
- 6.3.5.1. Canada Nanomaterials Market Estimates & Forecasts, 2018 - 2030 (USD Million)
- 6.3.5.2. Canada Nanomaterials Market Estimates & Forecasts, By Material, 2018 - 2030 (USD Million)
- 6.3.5.3. Canada Nanomaterials Market Estimates & Forecasts, By Application, 2018 - 2030 (USD Million)
- 6.3.6. Mexico
- 6.3.6.1. Mexico Nanomaterials Market Estimates & Forecasts, 2018 - 2030 (USD Million)
- 6.3.6.2. Mexico Nanomaterials Market Estimates & Forecasts, By Material, 2018 - 2030 (USD Million)
- 6.3.6.3. Mexico Nanomaterials Market Estimates & Forecasts, By Application, 2018 - 2030 (USD Million)
- 6.4. Europe
- 6.4.1. Europe Nanomaterials Market Estimates & Forecasts, 2018 - 2030 (USD Million
- 6.4.2. Europe Nanomaterials Market Estimates & Forecasts, By Material, 2018 - 2030 (USD Million)
- 6.4.3. Europe Nanomaterials Market Estimates & Forecasts, By Application, 2018 - 2030 (USD Million)
- 6.4.4. Germany
- 6.4.4.1. Germany Nanomaterials Market Estimates & Forecasts, 2018 - 2030 (USD Million)
- 6.4.4.2. Germany Nanomaterials Market Estimates & Forecasts, By Material, 2018 - 2030 (USD Million)
- 6.4.4.3. Germany Nanomaterials Market Estimates & Forecasts, By Application, 2018 - 2030 (USD Million)
- 6.4.5. UK
- 6.4.5.1. UK Nanomaterials Market Estimates & Forecasts, 2018 - 2030 (USD Million)
- 6.4.5.2. UK Nanomaterials Market Estimates & Forecasts, By Material, 2018 - 2030 (USD Million)
- 6.4.5.3. UK Nanomaterials Market Estimates & Forecasts, By Application, 2018 - 2030 (USD Million)
- 6.4.6. France
- 6.4.6.1. France Nanomaterials Market Estimates & Forecasts, 2018 - 2030 (USD Million)
- 6.4.6.2. France Nanomaterials Market Estimates & Forecasts, By Material, 2018 - 2030 (USD Million)
- 6.4.6.3. France Nanomaterials Market Estimates & Forecasts, By Application, 2018 - 2030 (USD Million)
- 6.5. Asia Pacific
- 6.5.1. Asia Pacific Nanomaterials Market Estimates & Forecasts, 2018 - 2030 (USD Million)
- 6.5.2. Asia Pacific Nanomaterials Market Estimates & Forecasts, By Material, 2018 - 2030 (USD Million)
- 6.5.3. Asia Pacific Nanomaterials Market Estimates & Forecasts, By Application, 2018 - 2030 (USD Million)
- 6.5.4. China
- 6.5.4.1. China Nanomaterials Market Estimates & Forecasts, 2018 - 2030 (USD Million)
- 6.5.4.2. China Nanomaterials Market Estimates & Forecasts, By Material, 2018 - 2030 (USD Million)
- 6.5.4.3. China Nanomaterials Market Estimates & Forecasts, By Application, 2018 - 2030 (USD Million)
- 6.5.5. India
- 6.5.5.1. India Nanomaterials Market Estimates & Forecasts, 2018 - 2030 (USD Million)
- 6.5.5.2. India Nanomaterials Market Estimates & Forecasts, By Material, 2018 - 2030 (USD Million)
- 6.5.5.3. India Nanomaterials Market Estimates & Forecasts, By Application, 2018 - 2030 (USD Million)
- 6.5.6. Japan
- 6.5.6.1. Japan Nanomaterials Market Estimates & Forecasts, 2018 - 2030 (USD Million)
- 6.5.6.2. Japan Nanomaterials Market Estimates & Forecasts, By Material, 2018 - 2030 (USD Million)
- 6.5.6.3. Japan Nanomaterials Market Estimates & Forecasts, By Application, 2018 - 2030 (USD Million)
- 6.6. Central & South America
- 6.6.1. Central & South America Nanomaterials Market Estimates & Forecasts, 2018 - 2030 (USD Million)
- 6.6.2. Central & South America Nanomaterials Market Estimates & Forecasts, By Material, 2018 - 2030 (USD Million)
- 6.6.3. Central & South America Nanomaterials Market Estimates & Forecasts, By Application, 2018 - 2030 (USD Million)
- 6.6.4. Brazil
- 6.6.4.1. Brazil Nanomaterials Market Estimates & Forecasts, 2018 - 2030 (USD Million)
- 6.6.4.2. Brazil Nanomaterials Market Estimates & Forecasts, By Material, 2018 - 2030 (USD Million)
- 6.6.4.3. Brazil Nanomaterials Market Estimates & Forecasts, By Application, 2018 - 2030 (USD Million)
- 6.7. Middle East & Africa
- 6.7.1. Middle East & Africa Nanomaterials Market Estimates & Forecasts, 2018 - 2030 (USD Million)
- 6.7.2. Middle East & Africa Nanomaterials Market Estimates & Forecasts, By Material, 2018 - 2030 (USD Million)
- 6.7.3. Middle East & Africa Nanomaterials Market Estimates & Forecasts, By Application, 2018 - 2030 (USD Million)
Chapter 7. Competitive Landscape
- 7.1. Key Players, their Recent Developments, and their Impact on Industry
- 7.2. Key Company/Competition Categorization
- 7.3. Company Market Position Analysis
- 7.4. Company Heat Map Analysis
- 7.5. Strategy Mapping
- 7.6. Company Listing
- 7.6.1. Strem
- 7.6.1.1. Company Overview
- 7.6.1.2. Financial Performance
- 7.6.1.3. Product Benchmarking
- 7.6.1.4. Strategic Initiatives
- 7.6.2. American Elements
- 7.6.2.1. Company Overview
- 7.6.2.2. Financial Performance
- 7.6.2.3. Product Benchmarking
- 7.6.2.4. Strategic Initiatives
- 7.6.3. US Research Nanomaterials, Inc.
- 7.6.3.1. Company Overview
- 7.6.3.2. Financial Performance
- 7.6.3.3. Product Benchmarking
- 7.6.3.4. Strategic Initiatives
- 7.6.4. nanoComposix
- 7.6.4.1. Company Overview
- 7.6.4.2. Financial Performance
- 7.6.4.3. Product Benchmarking
- 7.6.4.4. Strategic Initiatives
- 7.6.5. Frontier Carbon Solutions, LLC.
- 7.6.5.1. Company Overview
- 7.6.5.2. Financial Performance
- 7.6.5.3. Product Benchmarking
- 7.6.5.4. Strategic Initiatives
- 7.6.6. Nanoshel LLC
- 7.6.6.1. Company Overview
- 7.6.6.2. Financial Performance
- 7.6.6.3. Product Benchmarking
- 7.6.6.4. Strategic Initiatives
- 7.6.7. SkySpring Nanomaterials, Inc.
- 7.6.7.1. Company Overview
- 7.6.7.2. Financial Performance
- 7.6.7.3. Product Benchmarking
- 7.6.7.4. Strategic Initiatives
- 7.6.8. Nanophase Technologies Corporation
- 7.6.8.1. Company Overview
- 7.6.8.2. Financial Performance
- 7.6.8.3. Product Benchmarking
- 7.6.8.4. Strategic Initiatives
- 7.6.9. Cytodiagnostics Inc
- 7.6.9.1. Company Overview
- 7.6.9.2. Financial Performance
- 7.6.9.3. Product Benchmarking
- 7.6.9.4. Strategic Initiatives
- 7.6.10. Quantum Materials Corporation
- 7.6.10.1. Company Overview
- 7.6.10.2. Financial Performance
- 7.6.10.3. Product Benchmarking
- 7.6.10.4. Strategic Initiatives
- 7.6.1. Strem

