|
|
市場調査レポート
商品コード
1268658
複合材料の市場規模、シェア、動向分析レポート:製品タイプ別(炭素繊維、ガラス繊維)、製造プロセス別(レイアップ、フィラメント、射出成形、引抜)、最終用途別、地域別、セグメント別予測、2023~2030年Composites Market Size, Share & Trends Analysis Report By Product Type (Carbon Fiber, Glass Fiber), By Manufacturing Process (Layup, Filament, Injection Molding, Pultrusion), By End-use, By Region And Segment Forecasts, 2023 - 2030 |
||||||
|
|
|||||||
|
● お客様のご希望に応じて、既存データの加工や未掲載情報(例:国別セグメント)の追加などの対応が可能です。 詳細はお問い合わせください。 |
|||||||


| 複合材料の市場規模、シェア、動向分析レポート:製品タイプ別(炭素繊維、ガラス繊維)、製造プロセス別(レイアップ、フィラメント、射出成形、引抜)、最終用途別、地域別、セグメント別予測、2023~2030年 |
|
出版日: 2023年04月11日
発行: Grand View Research
ページ情報: 英文 167 Pages
納期: 2~10営業日
|
- 全表示
- 概要
- 図表
- 目次
コンポジット市場の成長と動向:
Grand View Research, Inc.の最新レポートによると、世界のコンポジット市場規模は2030年までに1,639億7,000万米ドルに達し、予測期間中に7.2%のCAGRを記録すると予想されています。
燃料価格の上昇と厳しい政府規制により、自動車メーカーは軽量化された部品に重点を置くようになったため、複合材料の需要は大きく伸びると予想され、予測期間中の市場需要をさらに促進させるでしょう。
複合材料は、自動車や航空機の部品製造において重要な役割を担っています。燃料消費量とCO2排出量に関する懸念の高まりにより、メーカーは金属部品の代替品として炭素繊維複合材料を使用するようになりました。製造サイクルタイムを最小化する技術革新は、自動車分野でのコンポジットの利用を促進すると予想されます。
コンポジットのコストが高いため、その適用範囲はプレミアムセグメントの自動車に限られています。しかし、主な企業は、高価格帯と同様の機械的特性を持つ低価格帯のコンポジットグレードを開発するために、大規模な研究開発活動を実施しています。このため、予測期間中、自動車産業における同製品の需要に拍車がかかると予想されます。
航空宇宙は、世界のコンポジット市場において最も成長が著しい分野の一つです。航空宇宙産業では、航空機、ロケット、人工衛星、ミサイルなどに高性能な素材が求められます。航空宇宙産業におけるコンポジットの消費は、軽量かつ高剛性であることから増加しています。米国と欧州は航空宇宙・防衛分野の主要市場であり、ボーイング社やエアバス社などの航空機メーカーが需要を牽引しています。
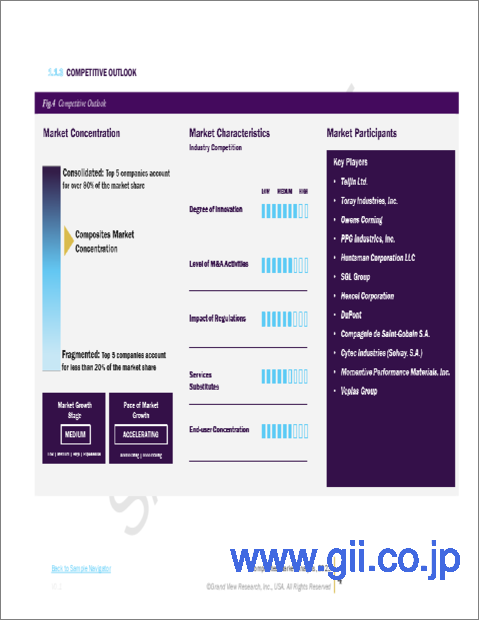
大手企業は、世界の複合材料市場において強力な販売網と製品ブランドを確立しています。帝人株式会社、東レ株式会社、Owens Corning社、PPG Industries Inc.などの企業が、世界市場で大きなシェアを獲得しています。コンポジット市場で進行中の研究開発活動は、市場関係者にいくつかの成長と拡大の機会を与え、ひいてはコンポジット市場全体にプラスの影響を与えると予測されます。
主なメーカーは、統合、買収、合弁事業、生産能力の拡大、新製品開発、主要製品ブランドのプロモーション、研究開発への多額の投資など、さまざまな戦略の実施を通じて、最適な事業成長と市場での確固たる地位の獲得を目指しています。
コンポジット市場レポートハイライト
- ガラス繊維セグメントは2022年に最大の市場シェアを占め、さらに、これらの複合材料の強度と耐久性によりパイプ製造用途への浸透が進んだことを理由に、CAGR 6.4%で成長すると予想されます。さらに、ガラス繊維は、建築・建設、自動車、産業、エネルギー、消費財などの分野で応用されるいくつかの薄板で構成されています。
- レイアップ工程は、2030年までにCAGR 9.0%で成長すると予測されています。この市場は、より簡単な技術的応用と、より安価な機械の要求により、再び成長すると予測されます。このプロセスは、樹脂と硬化剤のマトリックスを使用して、複合繊維の複数の層を順番に配置するものです。
- 自動車・輸送分野は、2022年に197億米ドルの収益シェアを獲得し、コンポジット市場を独占しました。これは、部品が大幅に軽量化され、燃費が向上するため、輸送分野での燃料節約などの利点があるためと考えられています。
- アジア太平洋地域のコンポジット需要は、航空旅客数の増加、自動車生産の増加、中国、インド、日本、韓国を含むアジア太平洋地域の様々な政府が設定した意欲的な電気・電子生産能力増強目標により、世界市場の中で最大となっています。
- 費用対効果の高い軽量複合材料製品を製造するために、技術革新、研究開発、パートナーシップ、M&Aなどさまざまな取り組みが、主要な市場関係者別行われています。著名なプレーヤーは、コンポジット製造に使用される技術の特許を取得しています。
目次
第1章 調査手法と範囲
- 市場セグメンテーションと範囲
- 調査手法
- 調査範囲と前提条件
- 情報調達
- 購入したデータベース
- GVRの内部データベース
- 二次情報
- 第三者の視点
- 1次調査
- 情報分析
- データ分析モデル
- 市場の形成とデータの可視化
- データソースのリスト
第2章 エグゼクティブサマリー
- 市場の見通し
- セグメント別の見通し
- 競争力の見通し
第3章 複合市場の変数、動向、および範囲
- 市場系統の見通し
- 複合材料市場-バリューチェーン分析
- 原材料分析
- 樹脂
- 補強材
- 副原料
- 原材料分析
- 技術概要
- 規制の枠組み
- アナリストの視点
- 米国環境保護庁
- 連邦規則集
- 米国運輸省(連邦航空局)
- 市場力学
- 市場促進要因の分析
- 自動車産業における軽量材料の需要の増加
- 産業分野における複合材料の利用の拡大
- 市場抑制要因分析
- 製造コストと加工コストが高い
- 原油価格の高騰
- 市場機会分析
- 市場課題の分析
- 市場促進要因の分析
- 業界分析- ポーターズ
- 競争企業間の敵対関係
- サプライヤーパワー
- 買い手の交渉力
- 代替品の脅威
- 新規参入業者の脅威
- PESTLE分析
- 政治的
- 経済的
- 社交
- 技術的
- 法的
- 環境
第4章 複合材料市場:製品タイプの推定・動向分析
- 複合材料市場:製品タイプの重要なポイント
- 複合材料市場:製品変動分析、2022年および2030年
- カーボンファイバー
- グラスファイバー
- その他
第5章 複合材料市場:製造プロセスの推定と分析
- 複合材料市場:製造プロセスの重要なポイント
- 複合材料市場:製造プロセスの変動分析、2022年および2030年
- レイアッププロセス
- フィラメントワインディング工程
- 射出成形プロセス
- 引抜成形プロセス
- 圧縮成形プロセス
- 樹脂トランスファー成形プロセス
- その他
第6章 複合材料市場:最終用途の推定・動向分析
- 複合材料市場:最終用途の重要なポイント
- 複合材料市場:最終用途の変動分析、2022年および2030年
- 自動車と輸送
- 風力エネルギー
- 電気・電子
- 建設とインフラストラクチャー
- パイプとタンク
- マリン
- その他
第7章 複合材料市場:地域の推定・動向分析
- 複合材料市場:地域別の重要なポイント
- 複合材料市場:地域変動分析、2022年および2030年
- 北米
- 米国
- カナダ
- メキシコ
- 欧州
- ドイツ
- 英国
- フランス
- イタリア
- スペイン
- アジア太平洋地域
- 中国
- 日本
- インド
- 韓国
- 中南米
- ブラジル
- アルゼンチン
- 中東とアフリカ
第8章 競合情勢
- 主要市場参入企業別最近の動向と影響分析
- 会社/競合の分類
- ベンダー情勢
- 公開会社
- 企業の市場での位置づけ
- 非公開会社
- 主要新興企業リスト
- 企業リスト(概要、財務、製品ポートフォリオ、戦略)
- Teijin Ltd.
- 会社概要
- 財務実績
- 製品のベンチマーク
- 戦略的取り組み
- Toray Industries, Inc.
- Owens Corning
- PPG Industries, Inc.
- Huntsman Corporation LLC
- SGL Group
- Hexcel Corporation
- DuPont
- Compagnie de Saint-Gobain SA
- Weyerhaeuser Company
- Momentive Performance Materials, Inc.
- Cytec Industries(Solvay. SA)
- China Jushi Co., Ltd.
- Veplas Group
- Kineco Limited
- Teijin Ltd.
List of Tables
- Table 1 Composites market estimates and forecasts, by product, 2018 - 2030 (Kilotons)
- Table 2 Composites market estimates and forecasts, by product, 2018 - 2030 (USD Billion)
- Table 3 Composites market estimates and forecasts, by manufacturing process, 2018 - 2030 (Kilotons)
- Table 4 Composites market estimates and forecasts, by manufacturing process, 2018 - 2030 (USD Billion)
- Table 5 Composites market estimates and forecasts, by end use, 2018 - 2030 (Kilotons)
- Table 6 Composites market estimates and forecasts, by end use, 2018 - 2030 (USD Billion)
List of Figures
- Fig. 1 Market Segmentation & Scope
- Fig. 2 Information Procurement
- Fig. 3 Primary Research Pattern
- Fig. 4 Primary Research Process
- Fig. 5 Market Research Approaches - Bottom Up Approach
- Fig. 6 Market Research Approaches - Top Down Approach
- Fig. 7 Market Research Approaches - Combined Approach
- Fig. 8 Market Outlook
- Fig. 9 Segmental Outlook
- Fig. 10 Segmental Outlook
- Fig. 11 Competitive Outlook
- Fig. 12 Penetration & Growth Prospect Mapping
- Fig. 13 Composites Market - Value Chain Analysis
- Fig. 14 Market Driver Analysis
- Fig. 15 World Motor Vehicle Production by Region (Million Units)
- Fig. 16 Market Restraint Analysis
- Fig. 17 Pricing - Composites v/s Other Materials (USD/Kg)
- Fig. 18 Global Crude Oil Prices (USD/ Barrel)
- Fig. 19 Global Consumer Spending on Electric Vehicle Purchase (USD Billion)
- Fig. 21 Composites Market: Product Type Key Takeaways
- Fig. 22 Composites Market: Product Movement Analysis, 2022 & 2030
- Fig. 23 Carbon fiber composites market estimates and forecasts, 2018 - 2030 (Kilotons) (USD Billion)
- Fig. 24 Glass fiber composites market estimates and forecasts, 2018 - 2030 (Kilotons) (USD Billion)
- Fig. 25 Other fiber composites market estimates and forecasts, 2018 - 2030 (Kilotons) (USD Billion)
- Fig. 26 Composites Market: Manufacturing Process Key Takeaways
- Fig. 27 Composites Market: Manufacturing Process Movement Analysis, 2022 & 2030
- Fig. 28 Composites market estimates and forecasts, by layup process, 2018 - 2030 (Kilotons) (USD Billion)
- Fig. 29 Composites market estimates and forecasts, by filament winding process, 2018 - 2030 (Kilotons) (USD Billion)
- Fig. 30 Composites market estimates and forecasts, by injection molding process, 2018 - 2030 (Kilotons) (USD Billion)
- Fig. 31 Composites market estimates and forecasts, by pultrusion process, 2018 - 2030 (Kilotons) (USD Billion)
- Fig. 32 Composites market estimates and forecasts, by compression molding process, 2018 - 2030 (Kilotons) (USD Billion)
- Fig. 33 Composites market estimates and forecasts, by resin transfer molding process, 2018 - 2030 (Kilotons) (USD Billion)
- Fig. 34 Composites market estimates and forecasts, by other manufacturing process, 2018 - 2030 (Kilotons) (USD Billion)
- Fig. 35 Composites Market: End-use Key Takeaways
- Fig. 36 Composites Market: End-use Movement Analysis, 2022 & 2030
- Fig. 37 Composites market estimates and forecasts in automotive & transportation, 2018 - 2030 (Kilotons) (USD Billion)
- Fig. 38 Composites market estimates and forecasts in wind energy, 2018 - 2030 (Kilotons) (USD Billion)
- Fig. 39 Composites market estimates and forecasts in electrical & electronics, 2018 - 2030 (Kilotons) (USD Billion)
- Fig. 40 Composites market estimates and forecasts in construction & infrastructure, 2018 - 2030 (Kilotons) (USD Billion)
- Fig. 41 Composites market estimates and forecasts in pipes & tanks, 2018 - 2030 (Kilotons) (USD Billion)
- Fig. 42 Composites market estimates and forecasts in marine, 2018 - 2030 (Kilotons) (USD Billion)
- Fig. 43 Composites market estimates and forecasts in other end-use, 2018 - 2030 (Kilotons) (USD Billion)
- Fig. 44 Composites Market: Regional Key Takeaways
- Fig. 45 Composites Market: Region Movement Analysis, 2022 & 2030
- Fig. 46 North America composites market estimates and forecasts, 2018 - 2030 (Kilotons) (USD Billion)
- Fig. 47 U.S. Composites market estimates and forecasts, 2018 - 2030 (Kilotons) (USD Billion)
- Fig. 48 Canada composites market estimates and forecasts, 2018 - 2030 (Kilotons) (USD Billion)
- Fig. 49 Mexico composites market estimates and forecasts, 2018 - 2030 (Kilotons) (USD Billion)
- Fig. 50 Europe composites market estimates and forecasts, 2018 - 2030 (Kilotons) (USD Billion)
- Fig. 51 Germany composites market estimates and forecasts, 2018 - 2030 (Kilotons) (USD Billion)
- Fig. 52 U.K. composites market estimates and forecasts, 2018 - 2030 (Kilotons) (USD Billion)
- Fig. 53 France composites market estimates and forecasts, 2018 - 2030 (Kilotons) (USD Billion)
- Fig. 54 Italy composites market estimates and forecasts, 2018 - 2030 (Kilotons) (USD Billion)
- Fig. 55 Spain composites market estimates and forecasts, 2018 - 2030 (Kilotons) (USD Billion)
- Fig. 56 Asia Pacific composites market estimates and forecasts, 2018 - 2030 (Kilotons) (USD Billion)
- Fig. 57 China composites market estimates and forecasts, 2018 - 2030 (Kilotons) (USD Billion)
- Fig. 58 Japan composites market estimates and forecasts, 2018 - 2030 (Kilotons) (USD Billion)
- Fig. 59 India composites market estimates and forecasts, 2018 - 2030 (Kilotons) (USD Billion)
- Fig. 60 South Korea composites market estimates and forecasts, 2018 - 2030 (Kilotons) (USD Billion)
- Fig. 61 Central & South America composites market estimates and forecasts, 2018 - 2030 (Kilotons) (USD Billion)
- Fig. 62 Brazil composites market estimates and forecasts, 2018 - 2030 (Kilotons) (USD Billion)
- Fig. 63 Argentina composites market estimates and forecasts, 2018 - 2030 (Kilotons) (USD Billion)
- Fig. 64 Middle East & Africa composites market estimates and forecasts, 2018 - 2030 (Kilotons) (USD Billion)
- Fig. 65 Company/Competition Categorization
- Fig. 66 Company Market Positioning
Composites Market Growth and Trends:
The global composites market size is expected to reach USD 163.97 billion by 2030, registering a CAGR of 7.2% over the forecast period,according to a new report by Grand View Research, Inc. The demand for composites is expected to witness significant growth owing to the rising fuel prices and stringent government regulations have shifted automobile manufacturers focus on light-weighted components which would further propel the market demand over the forecast period.
Composite products play an essential role in the manufacturing of automotive and aircraft parts. The growing concerns regarding fuel consumption and CO2 emission levels have prompted the manufacturers to use carbon fiber composite materials as substitutes for metal components. Technological innovations to minimize the manufacturing cycle time is expected to propel the usage of composites in the automotive sector.
The high cost of composites has limited their application scope to premium segment cars. However, key players are conducting extensive R&D activities to develop low-cost composite grades with similar mechanical properties as that of the high-cost variants. This is expected to spur the demand for the product in the automotive industry over the forecast period.
Aerospace is one of the fastest-growing sectors in the global composites market. High-performance materials are required to be used in aircraft, rockets, satellites, and missiles in the aerospace industry. The consumption of composites in the aerospace industry is increasing owing to their lightweight and high rigidity. The U.S. and Europe are the key markets in the aerospace & defense sector with the demand being driven by aircraft manufacturers such as Boeing and Airbus.
Major players have established a strong distribution network and product brands in the global composites market. Companies such as Teijin Limited, Toray Industries, Owens Corning, and PPG Industries Inc. acquired a large share of the market globally. The ongoing research & development activities in the composites market present several growth and expansion opportunities to market players, which in turn are projected to positively influence the overall composites market.
Manufacturers are aiming to achieve optimum business growth and a strong market position through the implementation of various strategies such as integration, through acquisition, joint ventures, production capacity expansion, new product development, promotion of key product brands, and significant investments in research & development.
Composites Market Report Highlights:
- The glass fiber segment accounted for the largest market share in 2022 and is further expected to grow at a CAGR of 6.4% on account of increased penetration in pipe manufacturing applications owing to the strength and durability of these composites. Additionally, glass fiber comprises several thin that find application in building & construction, automotive, industrial, energy, and consumer goods
- The layup process segment is forecasted to grow at a CAGR of 9.0% by 2030. The market is again forecast to grow due to easier technology applications and the requirement of less expensive machinery. The process involves placing multiple layers of composite fiber in a sequence by using a matrix of resin and hardener
- The automotive & transportation segment dominated the composites market with a revenue share of USD 19.70 billion in 2022. This is attributed to its advantages such as fuel saving to the transportation sector as the components are significantly lighter in weight that allows ascending fuel efficiency
- The demand for composites in Asia Pacific was the largest in the global market due to the increase in air passenger traffic, rise in automotive vehicle production, and ambitious electrical & electronics production capacity addition targets set by various governments in the Asia Pacific including China, India, Japan, and South Korea
- Various initiatives such as technology innovations, research & development, partnerships, and merger & acquisitions to manufacture cost-effective and lightweight composite products have been undertaken by the key market players. Prominent players have patented technologies used for composites manufacturing
Table of Contents
Chapter 1. Methodology and Scope
- 1.1 Market Segmentation & Scope
- 1.2 Research Methodology
- 1.3 Research Scope and Assumptions
- 1.4 Information Procurement
- 1.4.1 Purchased Database
- 1.4.2 GVR'S Internal Database
- 1.4.3 Secondary Sources
- 1.4.4 Third Party Perspective
- 1.4.5 Primary Research
- 1.5 Information Analysis
- 1.5.1 Data Analysis Models
- 1.6 Market Formulation and Data Visualization
- 1.7 List of data sources
Chapter 2. Executive Summary
- 2.1. Market Outlook
- 2.2. Segmental Outlook
- 2.3. Competitive Outlook
Chapter 3. Composites Market Variables, Trends, and Scope
- 3.1 Market Lineage Outlook
- 3.2 Composites Market - Value Chain Analysis
- 3.2.1 Raw Material Analysis
- 3.2.1.1 Resins
- 3.2.1.2 Reinforcements
- 3.2.1.3 Auxiliary raw materials
- 3.2.1 Raw Material Analysis
- 3.3 Technology Overview
- 3.4 Regulatory Framework
- 3.4.1 Analyst Perspective
- 3.4.2 United State Environmental Protection Agency
- 3.4.3 Code of Federal Regulations
- 3.4.4 U.S. Depart of Transportation (Federal Aviation Administration)
- 3.5 Market Dynamics
- 3.5.1 Market Driver Analysis
- 3.5.1.1 Increasing demand for lightweight materials in automotive industry
- 3.5.1.2 Growing utilization of composites in industrial sectors
- 3.5.2 Market Restraint Analysis
- 3.5.2.1 High manufacturing and processing cost
- 3.5.2.2 Escalating crude oil prices
- 3.5.2.3 Market Opportunity Analysis
- 3.5.2.4 Market Challenge Analysis
- 3.5.1 Market Driver Analysis
- 3.6 Industry Analysis - Porter's
- 3.6.1 Competitive Rivalry
- 3.6.2 Supplier Power
- 3.6.3 Buyer Power
- 3.6.4 Threat of Substitutes
- 3.6.5 Threat of New Entrants
- 3.7 PESTLE Analysis
- 3.7.1 Political
- 3.7.2 Economic
- 3.7.3 Social
- 3.7.4 Technological
- 3.7.5 Legal
- 3.7.6 Environmental
Chapter 4. Composites Market: Product Type Estimates & Trend Analysis
- 4.1 Composites Market: Product Type Key Takeaways
- 4.2 Composites Market: Product Movement Analysis, 2022 & 2030
- 4.3 Carbon Fiber
- 4.4 Glass Fiber
- 4.5 Others
Chapter 5. Composites Market: Manufacturing Process Estimates & Analysis
- 5.1 Composites Market: Manufacturing Process Key Takeaways
- 5.2 Composites Market: Manufacturing Process Movement Analysis, 2022 & 2030
- 5.3 Layup Process
- 5.4 Filament Winding Process
- 5.5 Injection Molding Process
- 5.6 Pultrusion Process
- 5.7 Compression Molding Process
- 5.8 Resin Transfer Molding Process
- 5.9 Others
Chapter 6. Composites Market: End-Use Estimates & Analysis
- 6.1 Composites Market: End-Use Key Takeaways
- 6.2 Composites Market: End-use Movement Analysis, 2022 & 2030
- 6.3 Automotive & Transportation
- 6.4 Wind Energy
- 6.5 Electrical & Electronics
- 6.6 Construction & Infrastructure
- 6.7 Pipes & Tanks
- 6.8 Marine
- 6.9 Others
Chapter 7. Composites Market: Regional Estimates & Trend Analysis
- 7.1 Composites Market: Regional Key Takeaways
- 7.2 Composites Market: Region Movement Analysis, 2022 & 2030
- 7.3 North America
- 7.3.1 North America Composites Market Estimates and Forecasts, 2018 - 2030 (Kilotons) (USD Billion)
- 7.3.2 U.S.
- 7.3.2.1 U.S. composites market estimates and forecasts, 2018 - 2030 (Kilotons) (USD Billion)
- 7.3.3 Canada
- 7.3.3.1 Canada composites market estimates and forecasts, 2018 - 2030 (Kilotons) (USD Billion)
- 7.3.4 Mexico
- 7.3.4.1 Mexico composites market estimates and forecasts, 2018 - 2030 (Kilotons) (USD Billion)
- 7.4 Europe
- 7.4.1 Europe Composites Market Estimates and Forecasts, 2018 - 2030 (Kilotons) (USD Billion)
- 7.4.2 Germany
- 7.4.2.1 Germany composites market estimates and forecasts, 2018 - 2030 (Kilotons) (USD Billion)
- 7.4.3 UK
- 7.4.3.1 UK composites market estimates and forecasts, 2018 - 2030 (Kilotons) (USD Billion)
- 7.4.4 France
- 7.4.4.1 France composites market estimates and forecasts, 2018 - 2030 (Kilotons) (USD Billion)
- 7.4.5 Italy
- 7.4.5.1 Italy composites market estimates and forecasts, 2018 - 2030 (Kilotons) (USD Billion)
- 7.4.6 Spain
- 7.4.6.1 Spain composites market estimates and forecasts, 2018 - 2030 (Kilotons) (USD Billion)
- 7.5 Asia Pacific
- 7.5.1 Asia Pacific Composites Market Estimates and Forecasts, 2018 - 2030 (Kilotons) (USD Billion)
- 7.5.2 China
- 7.5.2.1 China composites market estimates and forecasts, 2018 - 2030 (Kilotons) (USD Billion)
- 7.5.3 Japan
- 7.5.3.1 Japan composites market estimates and forecasts, 2018 - 2030 (Kilotons) (USD Billion)
- 7.5.4 India
- 7.5.4.1 India composites market estimates and forecasts, 2018 - 2030 (Kilotons) (USD Billion)
- 7.5.5 South Korea
- 7.5.5.1 South Korea composites market estimates and forecasts, 2018 - 2030 (Kilotons) (USD Billion)
- 7.6 Central & South America
- 7.6.1 Central & South America Composites Market Estimates and Forecasts, 2018 - 2030 (Kilotons) (USD Billion)
- 7.6.2 Brazil
- 7.6.2.1 Brazil composites market estimates and forecasts, 2018 - 2030 (Kilotons) (USD Billion)
- 7.6.3 Argentina
- 7.6.3.1 Argentina composites market estimates and forecasts, 2018 - 2030 (Kilotons) (USD Billion)
- 7.7 Middle East & Africa
- 7.7.1 Middle East & Africa Composites Market Estimates and Forecasts, 2018 - 2030 (Kilotons) (USD Billion)
Chapter 8. Competitive Landscape
- 8.1 Recent Developments & Impact Analysis, By Key Market Participants
- 8.2 Company/Competition Categorization
- 8.3 Vendor Landscape
- 8.3.1 List of Raw Materials
- 8.3.2 List of Manufacturers
- 8.3.3 List of Suppliers/Distributors
- 8.3.4 List of End Users
- 8.4 Public Companies
- 8.4.1 Company Market Positioning
- 8.5 Private Companies
- 8.5.1 List of Key Emerging Companies
- 8.6 Company Listings (Overview, Financials, Product Portfolio, Strategy)
- 8.6.1 Teijin Ltd.
- 8.6.1.1 Company Overview
- 8.6.1.2 Financial Performance
- 8.6.1.3 Product Benchmarking
- 8.6.1.4 Strategic Initiatives
- 8.6.2 Toray Industries, Inc.
- 8.6.3 Owens Corning
- 8.6.4 PPG Industries, Inc.
- 8.6.5 Huntsman Corporation LLC
- 8.6.6 SGL Group
- 8.6.7 Hexcel Corporation
- 8.6.8 DuPont
- 8.6.9 Compagnie de Saint-Gobain S.A.
- 8.6.10 Weyerhaeuser Company
- 8.6.11 Momentive Performance Materials, Inc.
- 8.6.12 Cytec Industries (Solvay. S.A.)
- 8.6.13 China Jushi Co., Ltd.
- 8.6.14 Veplas Group
- 8.6.15 Kineco Limited
- 8.6.1 Teijin Ltd.