|
|
市場調査レポート
商品コード
1301146
医用画像の市場規模、シェア、動向分析レポート:製品別、最終用途別、地域別、セグメント予測、2023年~2030年Medical Imaging Market Size, Share & Trends Analysis Report by Product (X-ray Devices, Computed Tomography, Ultrasound, MRI, Nuclear Imaging), By End-use, By Region, And Segment Forecasts, 2023 - 2030 |
||||||
|
|
|||||||
|
● お客様のご希望に応じて、既存データの加工や未掲載情報(例:国別セグメント)の追加などの対応が可能です。 詳細はお問い合わせください。 |
|||||||


| 医用画像の市場規模、シェア、動向分析レポート:製品別、最終用途別、地域別、セグメント予測、2023年~2030年 |
|
出版日: 2023年06月27日
発行: Grand View Research
ページ情報: 英文 200 Pages
納期: 2~10営業日
|
- 全表示
- 概要
- 図表
- 目次
医用画像市場の成長と動向
GrandView Research, Inc.の最新レポートによると、世界の医用画像市場規模は2030年までに474億米ドルに達する見込みです。
2023年から2030年までのCAGRは4.8%で拡大する見込み。新興諸国における先進的な診断システムに対する需要の高まりや、市場プレイヤーの提携動向の高まりは、市場を牽引する主な要因の一つです。
新興諸国ではここ数年、画像診断の件数が急増しています。これらの地域では画像診断システムの設置密度が低いため、予測期間中に大きな成長が見込まれます。これらの国々における政府の好意的な政策や活況を呈する医療ツーリズムは、未開拓の市場に世界の市場プレイヤーを引きつけると期待されています。複数の画像モダリティの統合が市場成長に重要な役割を果たすと予想されます。これらのシステムは正確な診断能力を持ち、手頃な価格で入手できます。画像診断モダリティと手術室の統合は、世界レベルで市場に新たな道を開くと予想されます。
ポータブル診断ツールの開発は、外来医療、診療所、救急医療部門における画像診断装置の用途を拡大するために重要です。ハンドヘルド超音波診断装置は、救急医療において重要な迅速かつ安全な画像を提供します。神経疾患の早期発見を目的としたMRI技術の可能性を探る現在進行中の試験や研究は、良好な結果を示しています。新しい高周波コイルの開発により、予測期間中にこれらの用途が拡大すると予想されます。
医用画像市場レポートハイライト
- 超音波製品セグメントは2022年に31.6%の最大市場シェアを獲得。同セグメントは予測期間を通じて市場を独占すると予測される
- コンピュータ断層撮影(CT)セグメントは予測期間中最も速いCAGRで成長する見込み
- これは、ハイブリッド画像モダリティの開発やAIの統合など、急速な技術進歩別ものです。
- 最終用途に基づくと、発展途上国におけるヘルスケアサービス産業の開花により、病院セグメントが2022年に47.1%の最大シェアを獲得しました。
- 北米が世界市場をリードし、2022年に32.9%の最大収益シェアを占めました。
- 同地域の成長は、多数の業界プレイヤーの存在と新製品発表の頻度の高さ別。
目次
第1章 調査手法と範囲
- 市場セグメンテーションと範囲
- 製品
- 最終用途
- 領域
- 推定・予測のタイムライン
- 調査手法
- 情報調達
- 購入したデータベース
- GVRの内部データベース
- 二次情報
- 1次調査
- 1次調査の詳細
- 情報またはデータ分析
- データ分析モデル
- 市場の形成と検証
- モデル詳細
- 商品フロー解析(モデル1)
- 出来高価格分析(モデル2)
- 二次情報のリスト
- 一次情報のリスト
- 目的
第2章 エグゼクティブサマリー
- 市場の見通し
- セグメントの見通し
- 競合考察
第3章 医用画像市場の変数、動向、範囲
- 市場系統の見通し
- 親市場の見通し
- 関連/アンシラリー市場見通し
- 普及と成長の見通しマッピング
- 市場力学
- 市場促進要因分析
- 市場抑制要因分析
- 業界の課題
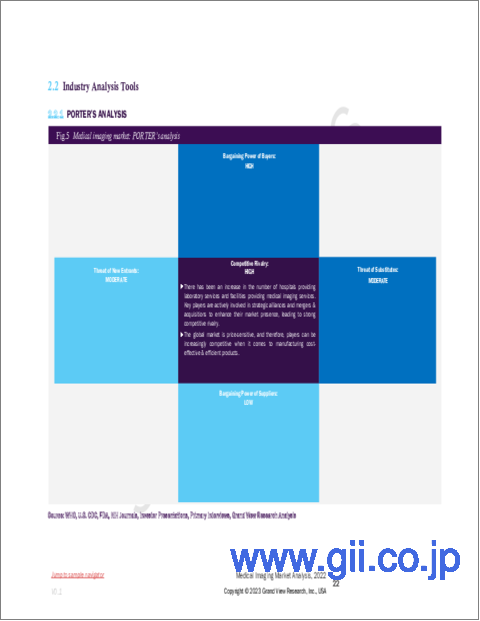
- 医用画像市場分析ツール
- 業界分析- ポーターの分析
- PESTEL分析
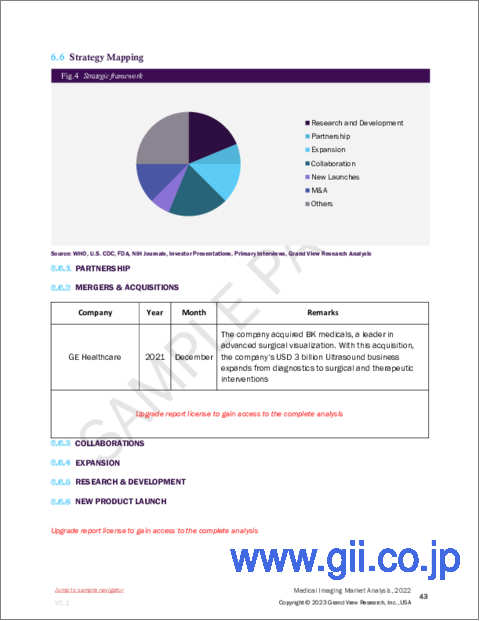
- 主要取引と戦略的提携の分析
- 市場参入戦略
第4章 医用画像市場:製品の推定・動向分析
- 定義と範囲
- 製品市場シェア、2022年および2030年
- セグメントダッシュボード
- 製品別の世界の医用画像市場の見通し
- 以下の市場規模と予測および動向分析、2018年から2030年まで
- X線装置
- 超音波
- コンピュータ断層撮影
- 磁気共鳴画像
- 核イメージング
第5章 医用画像市場:最終用途の推定・動向分析
- 定義と範囲
- 最終用途市場シェア、2022年および2030年
- セグメントダッシュボード
- 最終用途別の世界の医用画像市場の見通し
- 以下の市場規模と予測および動向分析、2018年から2030年まで
- 病院
- 画像診断センター
- 外来画像センター
- その他
第6章 医用画像市場:地域の推定・動向分析
- 地域市場シェア分析、2022年および2030年
- 地域市場ダッシュボード
- 世界の地域市場のスナップショット
- 地域市場シェアと主要企業、2022年
- SWOT分析、要因別(政治・法律、経済・技術)
- 北米
- 欧州
- アジア太平洋地域
- ラテンアメリカ
- 中東とアフリカ
- 市場規模、予測、量および動向分析、2020年から2028年
- 北米
- 市場推計・予測、2018~2030年(収益)
- 米国
- カナダ
- 欧州
- 英国
- ドイツ
- フランス
- イタリア
- スペイン
- デンマーク
- スウェーデン
- ノルウェー
- アジア太平洋地域
- 日本
- 中国
- インド
- タイ
- 韓国
- ラテンアメリカ
- ブラジル
- メキシコ
- アルゼンチン
- MEA
- 南アフリカ
- サウジアラビア
- アラブ首長国連邦
- クウェート
第7章 競合情勢
- 主要市場参入企業による最近の動向と影響分析
- 会社/競合の分類
- イノベーター
- ベンダー情勢
- 主なディストリビューターとチャネルパートナーのリスト
- 主な顧客
- 主要企業の市場シェア分析、2021
- Koninklijke Philips NV
- GE Healthcare
- Siemens Healthcare
- Canon Medical Systems
- Mindray Medical International
- Esaote
- Hologic, Inc
- Samsung Medison Co.Ltd
- Koning Corporation
- Perkin Elmer Inc.
- FUJIFILM VisualSonics Inc.
- Cubresa Inc.
List of Tables
- Table 1 List of Abbreviation
- Table 2 North America medical imaging market, by region, 2018 - 2030 (USD Million)
- Table 3 North America x-ray market, by modality, 2018 - 2030 (USD Million)
- Table 4 North America ultrasound market, by portability, 2018 - 2030 (USD Million)
- Table 5 North America CT market, by technology, 2018 - 2030 (USD Million)
- Table 6 North America MRI market, by architecture, 2018 - 2030 (USD Million)
- Table 7 North America nuclear imaging market, by product, 2018 - 2030 (USD Million)
- Table 8 North America medical imaging market, by End use, 2018 - 2030 (USD Million)
- Table 9 U.S. medical imaging market, by product, 2018 - 2030 (USD Million)
- Table 10 U.S. x-ray market, by modality, 2018 - 2030 (USD Million)
- Table 11 U.S. ultrasound market, by portability, 2018 - 2030 (USD Million)
- Table 12 U.S. CT market, by technology, 2018 - 2030 (USD Million)
- Table 13 U.S. MRI market, by architecture, 2018 - 2030 (USD Million)
- Table 14 U.S. nuclear imaging market, by product, 2018 - 2030 (USD Million)
- Table 15 U.S. medical imaging market, by End use, 2018 - 2030 (USD Million)
- Table 16 Canada medical imaging market, by product, 2018 - 2030 (USD Million)
- Table 17 Canada x-ray market, by modality, 2018 - 2030 (USD Million)
- Table 18 Canada ultrasound market, by portability, 2018 - 2030 (USD Million)
- Table 19 Canada CT market, by technology, 2018 - 2030 (USD Million)
- Table 20 Canada MRI market, by architecture, 2018 - 2030 (USD Million)
- Table 21 Canada nuclear imaging market, by product, 2018 - 2030 (USD Million)
- Table 22 Canada medical imaging market, by End use, 2018 - 2030 (USD Million)
- Table 23 North America medical imaging market, by region, 2018 - 2030 (USD Million)
- Table 24 Europe x-ray market, by modality, 2018 - 2030 (USD Million)
- Table 25 Europe ultrasound market, by portability, 2018 - 2030 (USD Million)
- Table 26 Europe CT market, by technology, 2018 - 2030 (USD Million)
- Table 27 Europe MRI market, by architecture, 2018 - 2030 (USD Million)
- Table 28 Europe nuclear imaging market, by product, 2018 - 2030 (USD Million)
- Table 29 Europe medical imaging market, by End use, 2018 - 2030 (USD Million)
- Table 30 UK medical imaging market, by product, 2018 - 2030 (USD Million)
- Table 31 UK x-ray market, by modality, 2018 - 2030 (USD Million)
- Table 32 UK ultrasound market, by portability, 2018 - 2030 (USD Million)
- Table 33 UK CT market, by technology, 2018 - 2030 (USD Million)
- Table 34 UK MRI market, by architecture, 2018 - 2030 (USD Million)
- Table 35 UK nuclear imaging market, by product, 2018 - 2030 (USD Million)
- Table 36 UK medical imaging market, by End use, 2018 - 2030 (USD Million)
- Table 37 Germany medical imaging market, by product, 2018 - 2030 (USD Million)
- Table 38 Germany x-ray market, by modality, 2018 - 2030 (USD Million)
- Table 39 Germany ultrasound market, by portability, 2018 - 2030 (USD Million)
- Table 40 Germany CT market, by technology, 2018 - 2030 (USD Million)
- Table 41 Germany MRI market, by architecture, 2018 - 2030 (USD Million)
- Table 42 Germany nuclear imaging market, by product, 2018 - 2030 (USD Million)
- Table 43 Germany medical imaging market, by End use, 2018 - 2030 (USD Million)
- Table 44 France medical imaging market, by product, 2018 - 2030 (USD Million)
- Table 45 France x-ray market, by modality, 2018 - 2030 (USD Million)
- Table 46 France ultrasound market, by portability, 2018 - 2030 (USD Million)
- Table 47 France CT market, by technology, 2018 - 2030 (USD Million)
- Table 48 France MRI market, by architecture, 2018 - 2030 (USD Million)
- Table 49 France nuclear imaging market, by product, 2018 - 2030 (USD Million)
- Table 50 France medical imaging market, by End use, 2018 - 2030 (USD Million)
- Table 51 Italy medical imaging market, by product, 2018 - 2030 (USD Million)
- Table 52 Italy x-ray market, by modality, 2018 - 2030 (USD Million)
- Table 53 Italy ultrasound market, by portability, 2018 - 2030 (USD Million)
- Table 54 Italy CT market, by technology, 2018 - 2030 (USD Million)
- Table 55 Italy MRI market, by architecture, 2018 - 2030 (USD Million)
- Table 56 Italy nuclear imaging market, by product, 2018 - 2030 (USD Million)
- Table 57 Italy medical imaging market, by End use, 2018 - 2030 (USD Million)
- Table 58 Spain medical imaging market, by product, 2018 - 2030 (USD Million)
- Table 59 Spain x-ray market, by modality, 2018 - 2030 (USD Million)
- Table 60 Spain ultrasound market, by portability, 2018 - 2030 (USD Million)
- Table 61 Spain CT market, by technology, 2018 - 2030 (USD Million)
- Table 62 Spain MRI market, by architecture, 2018 - 2030 (USD Million)
- Table 63 Spain nuclear imaging market, by product, 2018 - 2030 (USD Million)
- Table 64 Spain medical imaging market, by End use, 2018 - 2030 (USD Million)
- Table 65 Denmark medical imaging market, by product, 2018 - 2030 (USD Million)
- Table 66 Denmark x-ray market, by modality, 2018 - 2030 (USD Million)
- Table 67 Denmark ultrasound market, by portability, 2018 - 2030 (USD Million)
- Table 68 Denmark CT market, by technology, 2018 - 2030 (USD Million)
- Table 69 Denmark MRI market, by architecture, 2018 - 2030 (USD Million)
- Table 70 Denmark nuclear imaging market, by product, 2018 - 2030 (USD Million)
- Table 71 Denmark medical imaging market, by End use, 2018 - 2030 (USD Million)
- Table 72 Sweden medical imaging market, by product, 2018 - 2030 (USD Million)
- Table 73 Sweden x-ray market, by modality, 2018 - 2030 (USD Million)
- Table 74 Sweden ultrasound market, by portability, 2018 - 2030 (USD Million)
- Table 75 Sweden CT market, by technology, 2018 - 2030 (USD Million)
- Table 76 Sweden MRI market, by architecture, 2018 - 2030 (USD Million)
- Table 77 Sweden nuclear imaging market, by product, 2018 - 2030 (USD Million)
- Table 78 Sweden medical imaging market, by End use, 2018 - 2030 (USD Million)
- Table 79 Norway medical imaging market, by product, 2018 - 2030 (USD Million)
- Table 80 Norway x-ray market, by modality, 2018 - 2030 (USD Million)
- Table 81 Norway ultrasound market, by portability, 2018 - 2030 (USD Million)
- Table 82 Norway CT market, by technology, 2018 - 2030 (USD Million)
- Table 83 Norway MRI market, by architecture, 2018 - 2030 (USD Million)
- Table 84 Norway nuclear imaging market, by product, 2018 - 2030 (USD Million)
- Table 85 Norway medical imaging market, by End use, 2018 - 2030 (USD Million)
- Table 86 APAC x-ray market, by modality, 2018 - 2030 (USD Million)
- Table 87 APAC ultrasound market, by portability, 2018 - 2030 (USD Million)
- Table 88 APAC CT market, by technology, 2018 - 2030 (USD Million)
- Table 89 APAC MRI market, by architecture, 2018 - 2030 (USD Million)
- Table 90 APAC nuclear imaging market, by product, 2018 - 2030 (USD Million)
- Table 91 APAC medical imaging market, by End use, 2018 - 2030 (USD Million)
- Table 92 Japan medical imaging market, by product, 2018 - 2030 (USD Million)
- Table 93 Japan x-ray market, by modality, 2018 - 2030 (USD Million)
- Table 94 Japan ultrasound market, by portability, 2018 - 2030 (USD Million)
- Table 95 Japan CT market, by technology, 2018 - 2030 (USD Million)
- Table 96 Japan MRI market, by architecture, 2018 - 2030 (USD Million)
- Table 97 Japan nuclear imaging market, by product, 2018 - 2030 (USD Million)
- Table 98 Japan medical imaging market, by End use, 2018 - 2030 (USD Million)
- Table 99 China medical imaging market, by product, 2018 - 2030 (USD Million)
- Table 100 China x-ray market, by modality, 2018 - 2030 (USD Million)
- Table 101 China ultrasound market, by portability, 2018 - 2030 (USD Million)
- Table 102 China CT market, by technology, 2018 - 2030 (USD Million)
- Table 103 China MRI market, by architecture, 2018 - 2030 (USD Million)
- Table 104 China nuclear imaging market, by product, 2018 - 2030 (USD Million)
- Table 105 China medical imaging market, by End use, 2018 - 2030 (USD Million)
- Table 106 India medical imaging market, by product, 2018 - 2030 (USD Million)
- Table 107 India x-ray market, by modality, 2018 - 2030 (USD Million)
- Table 108 India ultrasound market, by portability, 2018 - 2030 (USD Million)
- Table 109 India CT market, by technology, 2018 - 2030 (USD Million)
- Table 110 India MRI market, by architecture, 2018 - 2030 (USD Million)
- Table 111 India nuclear imaging market, by product, 2018 - 2030 (USD Million)
- Table 112 India medical imaging market, by End use, 2018 - 2030 (USD Million)
- Table 113 Australia medical imaging market, by product, 2018 - 2030 (USD Million)
- Table 114 Australia x-ray market, by modality, 2018 - 2030 (USD Million)
- Table 115 Australia ultrasound market, by portability, 2018 - 2030 (USD Million)
- Table 116 Australia CT market, by technology, 2018 - 2030 (USD Million)
- Table 117 Australia MRI market, by architecture, 2018 - 2030 (USD Million)
- Table 118 Australia nuclear imaging market, by product, 2018 - 2030 (USD Million)
- Table 119 Australia medical imaging market, by End use, 2018 - 2030 (USD Million)
- Table 120 South Korea medical imaging market, by product, 2018 - 2030 (USD Million)
- Table 121 South Korea x-ray market, by modality, 2018 - 2030 (USD Million)
- Table 122 South Korea ultrasound market, by portability, 2018 - 2030 (USD Million)
- Table 123 South Korea CT market, by technology, 2018 - 2030 (USD Million)
- Table 124 South Korea MRI market, by architecture, 2018 - 2030 (USD Million)
- Table 125 South Korea nuclear imaging market, by product, 2018 - 2030 (USD Million)
- Table 126 South Korea medical imaging market, by End use, 2018 - 2030 (USD Million)
- Table 127 Thailand medical imaging market, by product, 2018 - 2030 (USD Million)
- Table 128 Thailand x-ray market, by modality, 2018 - 2030 (USD Million)
- Table 129 Thailand ultrasound market, by portability, 2018 - 2030 (USD Million)
- Table 130 Thailand CT market, by technology, 2018 - 2030 (USD Million)
- Table 131 Thailand MRI market, by architecture, 2018 - 2030 (USD Million)
- Table 132 Thailand nuclear imaging market, by product, 2018 - 2030 (USD Million)
- Table 133 Thailand medical imaging market, by End use, 2018 - 2030 (USD Million)
- Table 134 Latin America x-ray market, by modality, 2018 - 2030 (USD Million)
- Table 135 Latin America ultrasound market, by portability, 2018 - 2030 (USD Million)
- Table 136 Latin America CT market, by technology, 2018 - 2030 (USD Million)
- Table 137 Latin America MRI market, by architecture, 2018 - 2030 (USD Million)
- Table 138 Latin America nuclear imaging market, by product, 2018 - 2030 (USD Million)
- Table 139 Latin America medical imaging market, by End use, 2018 - 2030 (USD Million)
- Table 140 Brazil medical imaging market, by product, 2018 - 2030 (USD Million)
- Table 141 Brazil x-ray market, by modality, 2018 - 2030 (USD Million)
- Table 142 Brazil ultrasound market, by portability, 2018 - 2030 (USD Million)
- Table 143 Brazil CT market, by technology, 2018 - 2030 (USD Million)
- Table 144 Brazil MRI market, by architecture, 2018 - 2030 (USD Million)
- Table 145 Brazil nuclear imaging market, by product, 2018 - 2030 (USD Million)
- Table 146 Brazil medical imaging market, by End use, 2018 - 2030 (USD Million)
- Table 147 Mexico medical imaging market, by product, 2018 - 2030 (USD Million)
- Table 148 Mexico x-ray market, by modality, 2018 - 2030 (USD Million)
- Table 149 Mexico ultrasound market, by portability, 2018 - 2030 (USD Million)
- Table 150 Mexico CT market, by technology, 2018 - 2030 (USD Million)
- Table 151 Mexico MRI market, by architecture, 2018 - 2030 (USD Million)
- Table 152 Mexico nuclear imaging market, by product, 2018 - 2030 (USD Million)
- Table 153 Mexico medical imaging market, by End use, 2018 - 2030 (USD Million)
- Table 154 Argentina medical imaging market, by product, 2018 - 2030 (USD Million)
- Table 155 Argentina x-ray market, by modality, 2018 - 2030 (USD Million)
- Table 156 Argentina ultrasound market, by portability, 2018 - 2030 (USD Million)
- Table 157 Argentina CT market, by technology, 2018 - 2030 (USD Million)
- Table 158 Argentina MRI market, by architecture, 2018 - 2030 (USD Million)
- Table 159 Argentina nuclear imaging market, by product, 2018 - 2030 (USD Million)
- Table 160 Argentina medical imaging market, by End use, 2018 - 2030 (USD Million)
- Table 161 MEA x-ray market, by modality, 2018 - 2030 (USD Million)
- Table 162 MEA ultrasound market, by portability, 2018 - 2030 (USD Million)
- Table 163 MEA CT market, by technology, 2018 - 2030 (USD Million)
- Table 164 MEA MRI market, by architecture, 2018 - 2030 (USD Million)
- Table 165 MEA nuclear imaging market, by product, 2018 - 2030 (USD Million)
- Table 166 MEA medical imaging market, by End use, 2018 - 2030 (USD Million)
- Table 167 South Africa medical imaging market, by product, 2018 - 2030 (USD Million)
- Table 168 South Africa x-ray market, by modality, 2018 - 2030 (USD Million)
- Table 169 South Africa ultrasound market, by portability, 2018 - 2030 (USD Million)
- Table 170 South Africa CT market, by technology, 2018 - 2030 (USD Million)
- Table 171 South Africa MRI market, by architecture, 2018 - 2030 (USD Million)
- Table 172 South Africa nuclear imaging market, by product, 2018 - 2030 (USD Million)
- Table 173 South Africa medical imaging market, by End use, 2018 - 2030 (USD Million)
- Table 174 Saudi Arabia medical imaging market, by product, 2018 - 2030 (USD Million)
- Table 175 Saudi Arabia x-ray market, by modality, 2018 - 2030 (USD Million)
- Table 176 Saudi Arabia ultrasound market, by portability, 2018 - 2030 (USD Million)
- Table 177 Saudi Arabia CT market, by technology, 2018 - 2030 (USD Million)
- Table 178 Saudi Arabia MRI market, by architecture, 2018 - 2030 (USD Million)
- Table 179 Saudi Arabia nuclear imaging market, by product, 2018 - 2030 (USD Million)
- Table 180 Saudi Arabia medical imaging market, by End use, 2018 - 2030 (USD Million)
- Table 181 UAE medical imaging market, by product, 2018 - 2030 (USD Million)
- Table 182 UAE x-ray market, by modality, 2018 - 2030 (USD Million)
- Table 183 UAE ultrasound market, by portability, 2018 - 2030 (USD Million)
- Table 184 UAE CT market, by technology, 2018 - 2030 (USD Million)
- Table 185 UAE MRI market, by architecture, 2018 - 2030 (USD Million)
- Table 186 UAE nuclear imaging market, by product, 2018 - 2030 (USD Million)
- Table 187 UAE medical imaging market, by End use, 2018 - 2030 (USD Million)
- Table 188 Kuwait medical imaging market, by product, 2018 - 2030 (USD Million)
- Table 189 Kuwait x-ray market, by modality, 2018 - 2030 (USD Million)
- Table 190 Kuwait ultrasound market, by portability, 2018 - 2030 (USD Million)
- Table 191 Kuwait CT market, by technology, 2018 - 2030 (USD Million)
- Table 192 Kuwait MRI market, by architecture, 2018 - 2030 (USD Million)
- Table 193 Kuwait nuclear imaging market, by product, 2018 - 2030 (USD Million)
- Table 194 Kuwait medical imaging market, by End use, 2018 - 2030 (USD Million)
List of Figures
- Fig. 1 Market research process
- Fig. 2 Data triangulation techniques
- Fig. 3 Primary research pattern
- Fig. 4 Primary interviews in North America
- Fig. 5 Primary interviews in Europe
- Fig. 6 Primary interviews in APAC
- Fig. 7 Primary interviews in Latin America
- Fig. 8 Primary interviews in MEA
- Fig. 9 Market research approaches
- Fig. 10 Value-chain-based sizing & forecasting
- Fig. 11 QFD modeling for market share assessment
- Fig. 12 Market formulation & validation
- Fig. 13 Medical imaging market: Market outlook
- Fig. 14 Diagnostic imaging competitive insights
- Fig. 15 Parent market outlook
- Fig. 16 Related/ancillary market outlook
- Fig. 17 Penetration and growth prospect mapping
- Fig. 18 Industry value chain analysis
- Fig. 19 Medical imaging market driver impact
- Fig. 20 Medical imaging market restraint impact
- Fig. 21 Medical imaging market strategic initiatives analysis
- Fig. 22 Medical imaging market: Product movement analysis
- Fig. 23 Medical imaging market: Product outlook and key takeaways
- Fig. 24 X-ray market estimates and forecast, 2018 - 2030
- Fig. 25 Radiography market estimates and forecast, 2018 - 2030
- Fig. 26 Fluoroscopy market estimates and forecast, 2018 - 2030
- Fig. 27 Mammography market estimates and forecast, 2018 - 2030
- Fig. 28 Ultrasound market estimates and forecast, 2018 - 2030
- Fig. 29 Handheld market estimates and forecast, 2018 - 2030
- Fig. 30 Cart/Trolley Based market estimates and forecast, 2018 - 2030
- Fig. 31 Computed Tomography market estimates and forecast, 2018 - 2030
- Fig. 32 High end slice market estimates and forecast, 2018 - 2030
- Fig. 33 Mid end slice market estimates and forecast, 2018 - 2030
- Fig. 34 Low end slice market estimates and forecast, 2018 - 2030
- Fig. 35 Cone beam market estimates and forecast, 2018 - 2030
- Fig. 36 Magnetic Resonance Imaging market estimates and forecast, 2018 - 2030
- Fig. 37 Architecture market estimates and forecast, 2018 - 2030
- Fig. 38 Closed System market estimates and forecast, 2018 - 2030
- Fig. 39 Open System market estimates and forecast, 2018 - 2030
- Fig. 40 Nuclear Imaging market estimates and forecast, 2018 - 2030
- Fig. 41 SPECT market estimates and forecast, 2018 - 2030
- Fig. 42 PET market estimates and forecast, 2018 - 2030
- Fig. 43 Medical imaging market: End-use outlook and key takeaways
- Fig. 44 Hospitals market estimates and forecast, 2018 - 2030
- Fig. 45 Diagnostic imaging centers market estimates and forecast,2018 - 2030
- Fig. 46 Others market estimates and forecast,2018 - 2030
- Fig. 47 Global medical imaging market: Regional movement analysis
- Fig. 48 Global medical imaging market: Regional outlook and key takeaways
- Fig. 49 Global medical imaging market share and leading players
- Fig. 50 North America market share and leading players
- Fig. 51 Europe market share and leading players
- Fig. 52 Asia Pacific market share and leading players
- Fig. 53 Latin America market share and leading players
- Fig. 54 Middle East & Africa market share and leading players
- Fig. 55 North America: SWOT
- Fig. 56 Europe SWOT
- Fig. 57 Asia Pacific SWOT
- Fig. 58 Latin America SWOT
- Fig. 59 MEA SWOT
- Fig. 60 North America, by country
- Fig. 61 North America
- Fig. 62 North America market estimates and forecast, 2018 - 2030
- Fig. 63 U.S.
- Fig. 64 U.S. market estimates and forecast, 2018 - 2030
- Fig. 65 Canada
- Fig. 66 Canada market estimates and forecast, 2018 - 2030
- Fig. 67 Europe
- Fig. 68 Europe. market estimates and forecast, 2018 - 2030
- Fig. 69 U.K.
- Fig. 70 U.K. market estimates and forecast, 2018 - 2030
- Fig. 71 Germany
- Fig. 72 Germany market estimates and forecast, 2018 - 2030
- Fig. 73 France
- Fig. 74 France market estimates and forecast, 2018 - 2030
- Fig. 75 Italy
- Fig. 76 Italy market estimates and forecast, 2018 - 2030
- Fig. 77 Spain
- Fig. 78 Spain market estimates and forecast, 2018 - 2030
- Fig. 79 Denmark
- Fig. 80 Denmark market estimates and forecast, 2018 - 2030
- Fig. 81 Sweden
- Fig. 82 Sweden market estimates and forecast, 2018 - 2030
- Fig. 83 Norway
- Fig. 84 Norway market estimates and forecast, 2018 - 2030
- Fig. 85 Asia Pacific
- Fig. 86 Asia Pacific market estimates and forecast, 2018 - 2030
- Fig. 87 China
- Fig. 88 China market estimates and forecast, 2018 - 2030
- Fig. 89 Japan
- Fig. 90 Japan market estimates and forecast, 2018 - 2030
- Fig. 91 India
- Fig. 92 India market estimates and forecast, 2018 - 2030
- Fig. 93 Thailand
- Fig. 94 Thailand market estimates and forecast, 2018 - 2030
- Fig. 95 South Korea
- Fig. 96 South Korea market estimates and forecast, 2018 - 2030
- Fig. 97 Latin America
- Fig. 98 Latin America market estimates and forecast, 2018 - 2030
- Fig. 99 Brazil
- Fig. 100 Brazil market estimates and forecast, 2018 - 2030
- Fig. 101 Mexico
- Fig. 102 Mexico market estimates and forecast, 2018 - 2030
- Fig. 103 Argentina
- Fig. 104 Argentina market estimates and forecast, 2018 - 2030
- Fig. 105 Middle East and Africa
- Fig. 106 Middle East and Africa market estimates and forecast, 2018 - 2030
- Fig. 107 South Africa
- Fig. 108 South Africa market estimates and forecast, 2018 - 2030
- Fig. 109 Saudi Arabia
- Fig. 110 Saudi Arabia market estimates and forecast, 2018 - 2030
- Fig. 111 UAE
- Fig. 112 UAE market estimates and forecast, 2018 - 2030
- Fig. 113 Kuwait
- Fig. 114 Kuwait market estimates and forecast, 2018 - 2030
- Fig. 115 Participant Categorization- Medical imaging market
- Fig. 116 Market share of key market players- Medical imaging market
Medical Imaging Market Growth & Trends
The global medical imaging market size is expected to reach USD 47.4 billion by 2030, according to a new report by Grand View Research, Inc. It is expected to expand at a CAGR of 4.8% from 2023 to 2030. Increasing demand for advanced diagnostic systems in developing countries and growing trends of market player collaborations are some of the key factors driving the market.
Developing countries have shown a surge in the volume of imaging procedures in the past few years. The low density of installed imaging systems in these regions is expected to provide significant growth potential during the forecast period. Favorable government policies and booming medical tourism in these countries are expected to attract global market players in the untapped market. The integration of multiple imaging modalities is expected to play an important role in market growth. These systems have accurate diagnostic capabilities and are available at affordable prices. The integration of imaging modalities with surgical suites is anticipated to open a new avenue for the market at the global level.
The development of portable diagnostic tools is important to expand the applications of imaging devices in ambulatory care, clinics, and emergency care departments. Handheld ultrasound devices provide quick and safer images that are critical in emergency care. Ongoing trials and studies to explore the potential of MRI technology for the early detection of neurological conditions are showing positive results. The development of new radiofrequency coils is anticipated to expand these applications during the forecast period.
Medical Imaging Market Report Highlights
- The ultrasound product segment captured the largest market share of 31.6% in 2022. The segment is expected to dominate the market throughout the forecast period
- The Computed Tomography (CT) segment is expected to grow at the fastest CAGR during the forecast period
- This is due to the rapid technological advancements, such as the development of hybrid imaging modalities and the integration of AI
- Based on end-uses, the hospital segment captured the largest share of 47.1% in 2022 due to the blooming healthcare service industry in developing countries
- North America led the global market and accounted for the largest revenue share of 32.9% in 2022
- The region's growth is credited to the presence of a large number of industry players and the high frequency of new product launches
Table of Contents
Chapter 1. Methodology and Scope
- 1.1. Market Segmentation & Scope
- 1.1.1. Product
- 1.1.2. End use
- 1.1.3. Region
- 1.1.4. Estimates and forecast timeline
- 1.2. Research Methodology
- 1.3. Information Procurement
- 1.3.1. Purchased database
- 1.3.2. GVR's internal database
- 1.3.3. Secondary sources
- 1.3.4. Primary research
- 1.3.5. Details of primary research
- 1.3.5.1. Data for primary interviews in North America
- 1.3.5.2. Data for primary interviews in Europe
- 1.3.5.3. Data for primary interviews in Asia Pacific
- 1.3.5.4. Data for primary interviews in Latin America
- 1.3.5.5. Data for Primary interviews in MEA
- 1.4. Information or Data Analysis
- 1.4.1. Data analysis models
- 1.5. Market Formulation & Validation
- 1.6. Model Details
- 1.6.1. Commodity flow analysis (Model 1)
- 1.6.1.1. Approach 1: Commodity flow approach
- 1.6.2. Volume price analysis (Model 2)
- 1.6.2.1. Approach 2: Volume price analysis
- 1.6.1. Commodity flow analysis (Model 1)
- 1.7. List of Secondary Sources
- 1.8. List of Primary Sources
- 1.9. Objectives
Chapter 2. Executive Summary
- 2.1. Market Outlook
- 2.2. Segment Outlook
- 2.3. Competitive Insights
Chapter 3. Medical Imaging Market Variables, Trends & Scope
- 3.1. Market Lineage Outlook
- 3.1.1. Parent market outlook
- 3.1.2. Related/ancillary market outlook
- 3.2. Penetration & Growth Prospect Mapping
- 3.3. Market Dynamics
- 3.3.1. Market driver analysis
- 3.3.1.1. Growing prevalence of cancer and cardiac diseases
- 3.3.1.2. Favorable government initiatives
- 3.3.1.3. Trends of preventive healthcare and disease screening programs
- 3.3.1.4. Strategic collaborations
- 3.3.1.5. Technological advancements
- 3.3.2. Market restraint analysis
- 3.3.2.1. High cost
- 3.3.2.2. Increasing use of refurbished products
- 3.3.2.3. Lack of regulations in developing countries
- 3.3.2.4. Lack of trained radiologists
- 3.3.3. Industry challenges
- 3.3.3.1. Product recall
- 3.3.3.2. Safety concerns
- 3.3.1. Market driver analysis
- 3.4. Medical Imaging Market Analysis Tools
- 3.4.1. Industry analysis - Porter's
- 3.4.1.1. Supplier power
- 3.4.1.2. Buyer power
- 3.4.1.3. Substitution threat
- 3.4.1.4. Threat of new entrant
- 3.4.1.5. Competitive rivalry
- 3.4.2. PESTEL analysis
- 3.4.2.1. Political landscape
- 3.4.2.2. Technological landscape
- 3.4.2.3. Economic landscape
- 3.4.3. Major deals & strategic alliances analysis
- 3.4.4. Market entry strategies
- 3.4.1. Industry analysis - Porter's
Chapter 4. Medical Imaging Market: Product Estimates & Trend Analysis
- 4.1. Definitions and Scope
- 4.1.1. X-ray devices
- 4.1.2. Computed Tomography
- 4.1.3. MRI equipment
- 4.1.4. Ultrasound
- 4.1.5. Nuclear Imaging systems
- 4.2. Product Market Share, 2022 & 2030
- 4.3. Segment Dashboard
- 4.4. Global Medical Imaging Market by Product Outlook
- 4.5. Market Size & Forecasts and Trend Analysis, 2018 to 2030 for the following
- 4.5.1. X-ray devices
- 4.5.1.1. X-ray devices market estimates and forecasts, 2018 - 2030 (Revenue, USD Million)
- 4.5.1.2. X-ray devices market estimates and forecasts, by modality Revenue, USD Million 2018 - 2030
- 4.5.1.2.1. Radiography
- 4.5.1.2.1.1. Market estimates and forecasts, 2018 - 2030 (Revenue, USD Million)
- 4.5.1.2.2. Fluoroscopy
- 4.5.1.2.2.1. Market estimates and forecasts, 2018 - 2030 (Revenue, USD Million)
- 4.5.1.2.3. Mammography
- 4.5.1.2.3.1. Market estimates and forecasts, 2018 - 2030 (Revenue, USD Million)
- 4.5.2. Ultrasound
- 4.5.2.1. Ultrasound market estimates and forecasts, 2018 - 2030 (Revenue, USD Million)
- 4.5.2.2. Ultrasound market estimates and forecasts, by portability Revenue, USD Million 2018 - 2030
- 4.5.2.2.1. Handheld
- 4.5.2.2.1.1. Market estimates and forecasts, 2018 - 2030 (Revenue, USD Million)
- 4.5.2.2.2. Cart/trolley based
- 4.5.2.2.2.1. Market estimates and forecasts, 2018 - 2030 (Revenue, USD Million)
- 4.5.3. Computed Tomography
- 4.5.3.1. Computed Tomography market estimates and forecasts, 2018 - 2030 (Revenue, USD Million)
- 4.5.3.2. Computed Tomography market estimates and forecasts, by technology, Revenue, 2018 - 2030 (USD Million)
- 4.5.3.2.1. High end slice
- 4.5.3.2.1.1. Market estimates and forecasts, 2018 - 2030 (Revenue, USD Million)
- 4.5.3.2.2. Mid end slice
- 4.5.3.2.2.1. Market estimates and forecasts, 2018 - 2030 (Revenue, USD Million)
- 4.5.3.2.3. Low end slice
- 4.5.3.2.3.1. Market estimates and forecasts, 2018 - 2030 (Revenue, USD Million)
- 4.5.3.2.4. Cone beam
- 4.5.3.2.4.1. Market estimates and forecasts, 2018 - 2030 (Revenue, USD Million)
- 4.5.4. Magnetic Resonance Imaging
- 4.5.4.1. MRI market estimates and forecasts, 2018 - 2030 (Revenue, USD Million)
- 4.5.4.2. MRI market estimates and forecasts, by architecture, Revenue, 2018 - 2030 (USD Million)
- 4.5.4.2.1. Closed
- 4.5.4.2.1.1. Market estimates and forecasts, 2018 - 2030 (Revenue, USD Million)
- 4.5.4.2.2. Open
- 4.5.4.2.2.1. Market estimates and forecasts, 2018 - 2030 (Revenue, USD Million)
- 4.5.5. Nuclear Imaging
- 4.5.5.1. Nuclear imaging market estimates and forecasts, 2018 - 2030 (Revenue, USD Million)
- 4.5.5.2. Nuclear imaging market estimates and forecasts, by product, Revenue, 2018 - 2030 (USD Million)
- 4.5.5.2.1. SPECT
- 4.5.5.2.1.1. Market estimates and forecasts, 2018 - 2030 (Revenue, USD Million)
- 4.5.5.2.2. PET
- 4.5.5.2.2.1. Market estimates and forecasts, 2018 - 2030 (Revenue, USD Million)
- 4.5.1. X-ray devices
Chapter 5. Medical Imaging Market: End-use Estimates & Trend Analysis
- 5.1. Definitions and Scope
- 5.1.1. Hospitals
- 5.1.2. Diagnostic imaging centers
- 5.1.3. Ambulatory imaging centers
- 5.1.4. Others
- 5.2. End-use Market Share, 2022 & 2030
- 5.3. Segment Dashboard
- 5.4. Global Medical Imaging Market by End-use Outlook
- 5.5. Market Size & Forecasts and Trend Analysis, 2018 to 2030 for the following
- 5.5.1. Hospitals
- 5.5.1.1. Market estimates and forecasts, USD Million, 2018 to 2030
- 5.5.2. Diagnostic Imaging Centers
- 5.5.2.1. Market estimates and forecasts, USD Million, 2018 to 2030
- 5.5.3. Ambulatory Imaging Centers
- 5.5.3.1. Market estimates and forecasts, USD Million, 2018 to 2030
- 5.5.4. Others
- 5.5.4.1. Market estimates and forecasts, USD Million, 2018 to 2030
- 5.5.1. Hospitals
Chapter 6. Medical Imaging Market: Regional Estimates & Trend Analysis
- 6.1. Regional Market Share Analysis, 2022 & 2030
- 6.2. Regional Market Dashboard
- 6.3. Global Regional Market Snapshot
- 6.4. Regional Market Share and Leading Players, 2022
- 6.4.1. North America
- 6.4.2. Europe
- 6.4.3. Asia Pacific
- 6.4.4. Latin America
- 6.4.5. Middle East and Africa
- 6.5. SWOT Analysis, by Factor (Political & Legal, Economic and Technological)
- 6.5.1. North America
- 6.5.2. Europe
- 6.5.3. Asia Pacific
- 6.5.4. Latin America
- 6.5.5. Middle East and Africa
- 6.6. Market Size, & Forecasts, Volume and Trend Analysis, 2020 to 2028
- 6.7. North America
- 6.7.1. Market estimates and forecast, 2018 - 2030 (Revenue, USD Million)
- 6.7.2. U.S.
- 6.7.2.1. Key country dynamics
- 6.7.2.2. Competitive Scenario
- 6.7.2.3. Regulatory framework
- 6.7.2.4. Reimbursement scenario
- 6.7.2.5. Market estimates and forecasts, 2018 - 2030
- 6.7.3. Canada
- 6.7.3.1. Key country dynamics
- 6.7.3.2. Competitive Scenario
- 6.7.3.3. Regulatory framework
- 6.7.3.4. Reimbursement scenario
- 6.7.3.5. Market estimates and forecasts, 2018 - 2030
- 6.8. Europe
- 6.8.1. U.K.
- 6.8.1.1. Key country dynamics
- 6.8.1.2. Competitive Scenario
- 6.8.1.3. Regulatory framework
- 6.8.1.4. Reimbursement scenario
- 6.8.1.5. Market estimates and forecasts, 2018 - 2030
- 6.8.2. Germany
- 6.8.2.1. Key country dynamics
- 6.8.2.2. Competitive Scenario
- 6.8.2.3. Regulatory framework
- 6.8.2.4. Reimbursement scenario
- 6.8.2.5. Market estimates and forecasts, 2018 - 2030
- 6.8.3. France
- 6.8.3.1. Key country dynamics
- 6.8.3.2. Competitive Scenario
- 6.8.3.3. Regulatory framework
- 6.8.3.4. Reimbursement scenario
- 6.8.3.5. Market estimates and forecasts, 2018 - 2030
- 6.8.4. Italy
- 6.8.4.1. Key country dynamics
- 6.8.4.2. Competitive Scenario
- 6.8.4.3. Regulatory framework
- 6.8.4.4. Reimbursement scenario
- 6.8.4.5. Market estimates and forecasts, 2018 - 2030
- 6.8.5. Spain
- 6.8.5.1. Key country dynamics
- 6.8.5.2. Competitive Scenario
- 6.8.5.3. Regulatory framework
- 6.8.5.4. Reimbursement scenario
- 6.8.5.5. Market estimates and forecasts, 2018 - 2030
- 6.8.6. Denmark
- 6.8.6.1. Key country dynamics
- 6.8.6.2. Competitive Scenario
- 6.8.6.3. Regulatory framework
- 6.8.6.4. Reimbursement scenario
- 6.8.6.5. Market estimates and forecasts, 2018 - 2030
- 6.8.7. Sweden
- 6.8.7.1. Key country dynamics
- 6.8.7.2. Competitive Scenario
- 6.8.7.3. Regulatory framework
- 6.8.7.4. Reimbursement scenario
- 6.8.7.5. Market estimates and forecasts, 2018 - 2030
- 6.8.8. Norway
- 6.8.8.1. Key country dynamics
- 6.8.8.2. Competitive Scenario
- 6.8.8.3. Regulatory framework
- 6.8.8.4. Reimbursement scenario
- 6.8.8.5. Market estimates and forecasts, 2018 - 2030
- 6.8.1. U.K.
- 6.9. Asia Pacific
- 6.9.1. Japan
- 6.9.1.1. Key country dynamics
- 6.9.1.2. Competitive Scenario
- 6.9.1.3. Regulatory framework
- 6.9.1.4. Reimbursement scenario
- 6.9.1.5. Market estimates and forecasts, 2018 - 2030
- 6.9.2. China
- 6.9.2.1. Key country dynamics
- 6.9.2.2. Competitive Scenario
- 6.9.2.3. Regulatory framework
- 6.9.2.4. Reimbursement scenario
- 6.9.2.5. Market estimates and forecasts, 2018 - 2030
- 6.9.3. India
- 6.9.3.1. Key country dynamics
- 6.9.3.2. Competitive Scenario
- 6.9.3.3. Regulatory framework
- 6.9.3.4. Reimbursement scenario
- 6.9.3.5. Market estimates and forecasts, 2018 - 2030
- 6.9.4. Thailand
- 6.9.4.1. Key country dynamics
- 6.9.4.2. Competitive Scenario
- 6.9.4.3. Regulatory framework
- 6.9.4.4. Reimbursement scenario
- 6.9.4.5. Market estimates and forecasts, 2018 - 2030
- 6.9.5. South Korea
- 6.9.5.1. Key country dynamics
- 6.9.5.2. Competitive Scenario
- 6.9.5.3. Regulatory framework
- 6.9.5.4. Reimbursement scenario
- 6.9.5.5. Market estimates and forecasts, 2018 - 2030
- 6.9.1. Japan
- 6.10. Latin America
- 6.10.1. Brazil
- 6.10.1.1. Key country dynamics
- 6.10.1.2. Competitive Scenario
- 6.10.1.3. Regulatory framework
- 6.10.1.4. Reimbursement scenario
- 6.10.1.5. Market estimates and forecasts, 2018 - 2030
- 6.10.2. Mexico
- 6.10.2.1. Key country dynamics
- 6.10.2.2. Competitive Scenario
- 6.10.2.3. Regulatory framework
- 6.10.2.4. Reimbursement scenario
- 6.10.2.5. Market estimates and forecasts, 2018 - 2030
- 6.10.3. Argentina
- 6.10.3.1. Key country dynamics
- 6.10.3.2. Competitive Scenario
- 6.10.3.3. Regulatory framework
- 6.10.3.4. Reimbursement scenario
- 6.10.3.5. Market estimates and forecasts, 2018 - 2030
- 6.10.1. Brazil
- 6.11. MEA
- 6.11.1. South Africa
- 6.11.1.1. Key country dynamics
- 6.11.1.2. Competitive Scenario
- 6.11.1.3. Regulatory framework
- 6.11.1.4. Reimbursement scenario
- 6.11.1.5. Market estimates and forecasts, 2018 - 2030
- 6.11.2. Saudi Arabia
- 6.11.2.1. Key country dynamics
- 6.11.2.2. Competitive Scenario
- 6.11.2.3. Regulatory framework
- 6.11.2.4. Reimbursement scenario
- 6.11.2.5. Market estimates and forecasts, 2018 - 2030
- 6.11.3. UAE
- 6.11.3.1. Key country dynamics
- 6.11.3.2. Competitive Scenario
- 6.11.3.3. Regulatory framework
- 6.11.3.4. Reimbursement scenario
- 6.11.3.5. Market estimates and forecasts, 2018 - 2030
- 6.11.4. Kuwait
- 6.11.4.1. Key country dynamics
- 6.11.4.2. Competitive Scenario
- 6.11.4.3. Regulatory framework
- 6.11.4.4. Reimbursement scenario
- 6.11.4.5. Market estimates and forecasts, 2018 - 2030
- 6.11.1. South Africa
Chapter 7. Competitive Landscape
- 7.1. Recent Developments & Impact Analysis, By Key Market Participants
- 7.2. Company/Competition Categorization
- 7.2.1. Innovators
- 7.3. Vendor Landscape
- 7.3.1. List of key distributors and channel partners
- 7.3.2. Key customers
- 7.3.3. Key company market share analysis, 2021
- 7.3.4. Koninklijke Philips N.V.
- 7.3.4.1. Company overview
- 7.3.4.2. Financial performance
- 7.3.4.3. Product benchmarking
- 7.3.4.4. Strategic initiatives
- 7.3.5. GE Healthcare
- 7.3.5.1. Company overview
- 7.3.5.2. Financial performance
- 7.3.5.3. Product benchmarking
- 7.3.5.4. Strategic initiatives
- 7.3.6. Siemens Healthcare
- 7.3.6.1. Company overview
- 7.3.6.2. Financial performance
- 7.3.6.3. Product benchmarking
- 7.3.6.4. Strategic initiatives
- 7.3.7. Canon Medical Systems
- 7.3.7.1. Company overview
- 7.3.7.2. Financial performance
- 7.3.7.3. Product benchmarking
- 7.3.7.4. Strategic initiatives
- 7.3.8. Mindray Medical International
- 7.3.8.1. Company overview
- 7.3.8.2. Financial performance
- 7.3.8.3. Product benchmarking
- 7.3.8.4. Strategic initiatives
- 7.3.9. Esaote
- 7.3.9.1. Company overview
- 7.3.9.2. Financial performance
- 7.3.9.3. Product benchmarking
- 7.3.9.4. Strategic initiatives
- 7.3.10. Hologic, Inc
- 7.3.10.1. Company overview
- 7.3.10.2. Financial performance
- 7.3.10.3. Product benchmarking
- 7.3.10.4. Strategic initiatives
- 7.3.11. Samsung Medison Co.Ltd
- 7.3.11.1. Company overview
- 7.3.11.2. Financial performance
- 7.3.11.3. Product benchmarking
- 7.3.11.4. Strategic initiatives
- 7.3.12. Koning Corporation
- 7.3.12.1. Company overview
- 7.3.12.2. Financial performance
- 7.3.12.3. Product benchmarking
- 7.3.12.4. Strategic initiatives
- 7.3.13. Perkin Elmer Inc.
- 7.3.13.1. Company overview
- 7.3.13.2. Financial performance
- 7.3.13.3. Product benchmarking
- 7.3.13.4. Strategic initiatives
- 7.3.14. FUJIFILM VisualSonics Inc.
- 7.3.14.1. Company overview
- 7.3.14.2. Financial performance
- 7.3.14.3. Product benchmarking
- 7.3.14.4. Strategic initiatives
- 7.3.15. Cubresa Inc.
- 7.3.15.1. Company overview
- 7.3.15.2. Financial performance
- 7.3.15.3. Product benchmarking
- 7.3.15.4. Strategic initiatives