|
|
市場調査レポート
商品コード
1092625
コンピュータ支援エンジニアリング(CAE)市場の規模、シェア、動向分析レポート:タイプ別、展開モデル別、エンドユーザー別、セグメント別予測、2022年~2030年Computer Aided Engineering Market Size, Share, & Trends Analysis Report By Type (FEA, CFD, Multibody Dynamics), By Deployment Model, By End-use, And Segment Forecasts, 2022 - 2030 |
||||||
|
|
|||||||
|
● お客様のご希望に応じて、既存データの加工や未掲載情報(例:国別セグメント)の追加などの対応が可能です。 詳細はお問い合わせください。 |
|||||||


| コンピュータ支援エンジニアリング(CAE)市場の規模、シェア、動向分析レポート:タイプ別、展開モデル別、エンドユーザー別、セグメント別予測、2022年~2030年 |
|
出版日: 2022年05月17日
発行: Grand View Research
ページ情報: 英文 120 Pages
納期: 2~10営業日
|
- 全表示
- 概要
- 図表
- 目次
世界のコンピュータ支援エンジニアリング(CAE)の市場規模は、8.8%のCAGRで拡大し、2030年までに191億9,000万米ドルに達すると予測されています。
ウェアラブル産業の急速な成長により、エレクトロニクス産業におけるCAEソフトウェアの利用が増加するものと思われます。スマートフォン市場が成熟期にあるため、市場の主要企業は新たな収益源を模索しています。その結果、ウェアラブル技術への需要が予測期間中に増加しています。
当レポートでは、世界のコンピュータ支援エンジニアリング(CAE)市場について調査し、市場の現状とともに、タイプ別、展開モデル別、エンドユーザー別、地域別動向、および市場に参入する企業のプロファイルなどを提供しています。
目次
第1章 調査手法と範囲
第2章 エグゼクティブサマリー
第3章 業界の見通し
- 市場セグメンテーションと範囲
- 市場規模と成長見通し
- バリューチェーン分析
- 市場力学
- 主要なエンドユーザーリスト
- 主な機会
- 主要企業分析、2021年
- 業界分析-ポーターの分析
- PESTEL分析
第4章 コンピュータ支援エンジニアリング(CAE)市場:タイプ別推定と動向分析
- CAE市場:タイプ分析
- FEA
- CFD
- マルチボディダイナミクス
- 最適化とシミュレーション
第5章 コンピュータ支援エンジニアリング(CAE)市場:展開モデル別推定と動向分析
- CAE市場:展開モデル分析
- オンプレミス
- クラウドベース
第6章 コンピュータ支援エンジニアリング(CAE)市場:最終用途別推定と動向分析
- CAE市場:最終用途分析
- 自動車
- 防衛・航空宇宙
- エレクトロニクス
- 医療機器
- 産業機器
- その他
第7章 コンピュータ支援エンジニアリング(CAE)市場:地域別推定と動向分析
- 地域別市場シェア、2021年および2030年
- 北米
- 欧州
- アジア太平洋
- 南米
- 中東・アフリカ(MEA)
第8章 競合情勢
- ANSYS, Inc.
- Altair Engineering
- Autodesk, Inc.
- Bentley Systems, Inc.
- Dassault Systemes
- ESI Group
- Exa Corporation
- Mentor Graphics Corporation(A subsidiary of Siemens AG)
- MSC Software Corporation(A subsidiary of Hexagon AB)
- Siemens AG
第9章 競合分析
List of Tables
- Table 1 CAE- Industry snapshot & critical success factor, 2017 - 2030
- Table 2 Global CAE market, 2017 - 2030 (USD Million)
- Table 3 Global CAE market estimates and forecasts by type, 2017 - 2030 (USD Million)
- Table 4 Global CAE market estimates and forecasts by deployment model, 2017 - 2030 (USD Million)
- Table 5 Global CAE market estimates and forecasts by application, 2017 - 2030 (USD Million)
- Table 6 Global CAE market estimates and forecasts by region, 2017 - 2030 (USD Million)
- Table 7 Key company analysis
- Table 8 CAE market by FEA type, 2017 - 2030 (USD Million)
- Table 9 Global FEA type market by region, 2017 - 2030 (USD Million)
- Table 10 CAE market by CFD type, 2017 - 2030 (USD Million)
- Table 11 Global CFD market type by region, 2017 - 2030 (USD Million)
- Table 12 CAE market by multibody dynamics type, 2017 - 2030 (USD Million)
- Table 13 Global multibody dynamics type market by region, 2017 - 2030 (USD Million)
- Table 14 CAE market by optimization & simulation type, 2017 - 2030 (USD Million)
- Table 15 Global optimization & simulation type market by region, 2017 - 2030 (USD Million)
- Table 16 CAE market by on-premise deployment model, 2017 - 2030 (USD Million)
- Table 17 Global on-premise deployment model market by region, 2017 - 2030 (USD Million)
- Table 18 CAE market by cloud-based deployment model, 2017 - 2030 (USD Million)
- Table 19 Global cloud-based deployment model market by region, 2017 - 2030 (USD Million)
- Table 20 CAE market by automotive end-use, 2017 - 2030 (USD Million)
- Table 21 Global automotive end-use market by region, 2017 - 2030 (USD Million)
- Table 22 CAE market by defense & aerospace end-use, 2017 - 2030 (USD Million)
- Table 23 Global defense & aerospace end-use market by region, 2017 - 2030 (USD Million)
- Table 24 CAE market by electronics end-use, 2017 - 2030 (USD Million)
- Table 25 Global electronics end-use market by region, 2017 - 2030 (USD Million)
- Table 26 CAE market by medical devices end-use, 2017 - 2030 (USD Million)
- Table 27 Global medical devices end-use market by region, 2017 - 2030 (USD Million)
- Table 28 CAE market by industrial equipment end-use, 2017 - 2030 (USD Million)
- Table 29 Global industrial equipment end-use market by region, 2017 - 2030 (USD Million)
- Table 30 CAE market by others, 2017 - 2030 (USD Million)
- Table 31 Global others end-use market by region, 2017 - 2030 (USD Million)
- Table 32 North America CAE market, 2017 - 2030 (USD Million)
- Table 33 North America CAE market by type, 2017 - 2030 (USD Million)
- Table 34 North America CAE market by deployment model, 2017 - 2030 (USD Million)
- Table 35 North America CAE market by end-use, 2017 - 2030 (USD Million)
- Table 36 U.S. CAE market, 2017 - 2030 (USD Million)
- Table 37 U.S. CAE market by type, 2017 - 2030 (USD Million)
- Table 38 U.S. CAE market by deployment model, 2017 - 2030 (USD Million)
- Table 39 U.S. CAE market by end-use, 2017 - 2030 (USD Million)
- Table 40 Canada CAE market, 2017 - 2030 (USD Million)
- Table 41 Canada CAE market by type, 2017 - 2030 (USD Million)
- Table 42 Canada CAE market by deployment model, 2017 - 2030 (USD Million)
- Table 43 Canada CAE market by end-use, 2017 - 2030 (USD Million)
- Table 44 Mexico CAE market, 2017 - 2030 (USD Million)
- Table 45 Mexico CAE market by type, 2017 - 2030 (USD Million)
- Table 46 Mexico CAE market by deployment model, 2017 - 2030 (USD Million)
- Table 47 Mexico CAE market by end-use, 2017 - 2030 (USD Million)
- Table 48 Europe CAE market, 2017 - 2030 (USD Million)
- Table 49 Europe CAE market by type, 2017 - 2030 (USD Million)
- Table 50 Europe CAE market by deployment model, 2017 - 2030 (USD Million)
- Table 51 Europe CAE market by end-use, 2017 - 2030 (USD Million)
- Table 52 Germany CAE market, 2017 - 2030 (USD Million)
- Table 53 Germany CAE market by type, 2017 - 2030 (USD Million)
- Table 54 Germany CAE market by deployment model, 2017 - 2030 (USD Million)
- Table 55 Germany CAE market by end-use, 2017 - 2030 (USD Million)
- Table 56 U.K. CAE market, 2017 - 2030 (USD Million)
- Table 57 U.K. CAE market by type, 2017 - 2030 (USD Million)
- Table 58 U.K. CAE market by deployment model, 2017 - 2030 (USD Million)
- Table 59 U.K. CAE market by end-use, 2017 - 2030 (USD Million)
- Table 60 France CAE market, 2017 - 2030 (USD Million)
- Table 61 France CAE market by type, 2017 - 2030 (USD Million)
- Table 62 France CAE market by deployment model, 2017 - 2030 (USD Million)
- Table 63 France CAE market by end-use, 2017 - 2030 (USD Million)
- Table 64 Italy CAE market, 2017 - 2030 (USD Million)
- Table 65 Italy CAE market by type, 2017 - 2030 (USD Million)
- Table 66 Italy CAE market by deployment model, 2017 - 2030 (USD Million)
- Table 67 Italy CAE market by end-use, 2017 - 2030 (USD Million)
- Table 68 Spain CAE market, 2017 - 2030 (USD Million)
- Table 69 Spain CAE market by type, 2017 - 2030 (USD Million)
- Table 70 Spain CAE market by deployment model, 2017 - 2030 (USD Million)
- Table 71 Spain CAE market by end-use, 2017 - 2030 (USD Million)
- Table 72 Russia CAE market, 2017 - 2030 (USD Million)
- Table 73 Russia CAE market by type, 2017 - 2030 (USD Million)
- Table 74 Russia CAE market by deployment model, 2017 - 2030 (USD Million)
- Table 75 Russia CAE market by end-use, 2017 - 2030 (USD Million)
- Table 76 Asia-Pacific CAE market, 2017 - 2030 (USD Million)
- Table 77 Asia-Pacific CAE market by type, 2017 - 2030 (USD Million)
- Table 78 Asia-Pacific CAE market by deployment model, 2017 - 2030 (USD Million)
- Table 78 Asia-Pacific CAE market by end-use, 2017 - 2030 (USD Million)
- Table 79 China CAE market, 2017 - 2030 (USD Million)
- Table 80 China CAE market by type, 2017 - 2030 (USD Million)
- Table 81 China CAE market by deployment model, 2017 - 2030 (USD Million)
- Table 82 China CAE market by end-use, 2017 - 2030 (USD Million)
- Table 83 India CAE market, 2017 - 2030 (USD Million)
- Table 84 India CAE market by type, 2017 - 2030 (USD Million)
- Table 85 India CAE market by deployment model, 2017 - 2030 (USD Million)
- Table 86 India CAE market by end-use, 2017 - 2030 (USD Million)
- Table 87 Japan CAE market, 2017 - 2030 (USD Million)
- Table 88 Japan CAE market by type, 2017 - 2030 (USD Million)
- Table 89 Japan CAE market by deployment model, 2017 - 2030 (USD Million)
- Table 90 Japan CAE market by end-use, 2017 - 2030 (USD Million)
- Table 91 Singapore CAE market, 2017 - 2030 (USD Million)
- Table 92 Singapore CAE market by type, 2017 - 2030 (USD Million)
- Table 93 Singapore CAE market by deployment model, 2017 - 2030 (USD Million)
- Table 94 Singapore CAE market by end-use, 2017 - 2030 (USD Million)
- Table 95 South Korea CAE market, 2017 - 2030 (USD Million)
- Table 96 South Korea CAE market by type, 2017 - 2030 (USD Million)
- Table 97 South Korea CAE market by deployment model, 2017 - 2030 (USD Million)
- Table 98 South Korea CAE market by end-use, 2017 - 2030 (USD Million)
- Table 99 South America CAE market, 2017 - 2030 (USD Million)
- Table 100 South America CAE market by type, 2017 - 2030 (USD Million)
- Table 101 South America CAE market by deployment model, 2017 - 2030 (USD Million)
- Table 102 South America CAE market by end-use, 2017 - 2030 (USD Million)
- Table 103 Brazil CAE market, 2017 - 2030 (USD Million)
- Table 104 Brazil CAE market by type, 2017 - 2030 (USD Million)
- Table 105 Brazil CAE market by deployment model, 2017 - 2030 (USD Million)
- Table 106 Brazil CAE market by end-use, 2017 - 2030 (USD Million)
- Table 107 MEA CAE market, 2017 - 2030 (USD Million)
- Table 108 MEA CAE market by type, 2017 - 2030 (USD Million)
- Table 109 MEA CAE market by deployment model, 2017 - 2030 (USD Million)
- Table 110 MEA CAE market by end-use, 2017 - 2030 (USD Million)
List of Figures
- Fig. 1 Market segmentation &scope
- Fig. 2 CAE market size and growth prospects (Revenue in USD Million) 2017 - 2030
- Fig. 3 CAE- Value chain analysis
- Fig. 4 Market dynamics
- Fig. 5 Key opportunities prioritized
- Fig. 6 Porter's five forces analysis
- Fig. 7 CAE- PESTEL analysis
- Fig. 8 CAE market: Type analysis
- Fig. 9 CAE market: Deployment model analysis
- Fig. 10 CAE market: End-use analysis
- Fig. 11 Regional marketplace: Key takeaways
- Fig. 12 Regional outlook, 2021 & 2030
- Fig. 13 North America market place: Key takeaways
- Fig. 14 Europe market place: Key takeaways
- Fig. 15 Asia Pacific market place: Key takeaways
- Fig. 16 South America market place: Key takeaways
- Fig. 17 MEA market place: Key takeaways
Computer Aided Engineering Market Growth & Trends:
The global computer aided engineering market size is anticipated to reach USD 19.19 billion by 2030, registering a CAGR of 8.8%, according to a new report by Grand View Research, Inc. Rapid growth of the wearable industry is likely to increase the use of CAE software in the electronics industry. The major players in the market are in search of new sources of revenue as the smartphone market is in the maturity stage. As a result, the demand for wearable technology has increased the demand during the forecast period.
The growing penetration of IoT, tablets, and smartphones is expected to boost the CAE market growth. Owing to the growth of IoT, wearable devices, used in the fields of medicine, fitness, transportation, education, entertainment, and gaming, are increasing; paving way for the growth of the CAE market. Miniaturization of electronic devices and sensors and persuasive connectivity with lowered costs have immensely contributed to the growth of wearable technology devices.
Government regulations, mandating applications, such as collision avoidance, parking assistance systems, wireless communication technology, and interactive infotainment systems, in the upcoming car technologies to increase driver safety, are anticipated to raise the demand for CAE software. Additionally, technological advancements in the automotive sector, including driverless cars and semi-autonomous cars, are further anticipated to boost the industry demand.
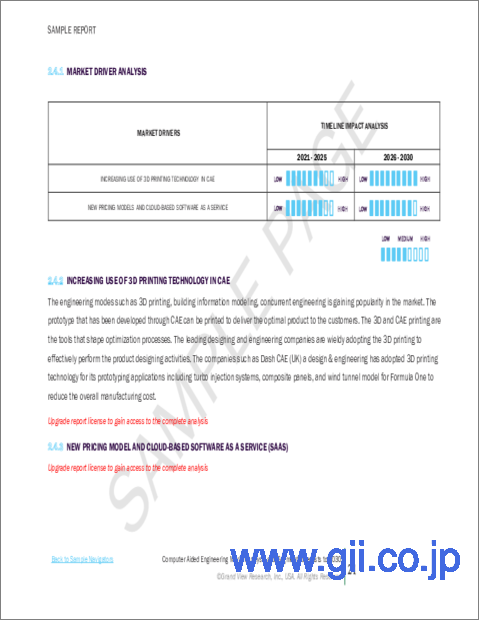
The emerging new engineering modes such as 3D printing, building information modeling, and concurrent engineering is likely to influence the market. 3D printing is a form of additive manufacturing that allows users to print any object as a 3-D image. The technology helps in reducing production costs and developing new methods of production. Ease of use and unlimited customization capabilities are the key factors driving the 3D printing market which is further expected to positively impact the computer aided engineering market demand.
The prevailing open-source software is anticipated to restrain the market growth over the projected period. They are available for free on the web; however, the vendors charge for support, customization, and maintenance services. Linux has been leading the open architecture software market. Open-source software has been a boon for small software vendors, due to which, the large enterprises have been facing negative impacts. The major drivers of open-source technology are the minor flaws and bugs that can be tested and fixed immediately.
Computer Aided Engineering Market Highlights:
- The intellectual property protection of software is crucial, as most of the modern manufacturing organizations rely on computer technology
- The computational fluid dynamics segment is anticipated to witness a high growth rate during the forecast period
- Testing and simulation are the important aspects of a design cycle that help the end-users in achieving profitability and faster time-to-market
- The On-premise segment dominated the market in terms of revenue in 2021 and is anticipated to remain dominant over the projected period
- Simulation software is used to analyze the effect of casing materials on IC performance, thermal management, and electrical signal performance
- The increasing adoption of lithium-ion batteries in consumer electronics applications will also enhance the industry demand during the projected period
- Asia Pacific and South America are poised to emerge as lucrative regional markets over the forecast period with high compounded annual growth rates
Table of Contents
Chapter 1 Methodology and Scope
- 1.1 Research Methodology
- 1.2 Research Scope & Assumptions
- 1.3 List of Data Sources
Chapter 2 Executive Summary
- 2.1 CAE- Industry Snapshot &Key Buying Criteria, 2017 - 2030
Chapter 3 Industry Outlook
- 3.1 Market Segmentation & Scope
- 3.2 CAE Market Size and Growth Prospects
- 3.3 CAE-Value Chain Analysis
- 3.4 Market Dynamics
- 3.4.1 Market driver analysis
- 3.4.1.1 Emergence of 3D printing
- 3.4.1.2 New pricing model and Cloud-based software-as-a-service(SaaS)
- 3.4.2 Market restraint analysis
- 3.4.2.1 Open source software
- 3.4.3 Market opportunity analysis
- 3.4.3.1 Physics-based Simulations with Machine Learning
- 3.4.3.2 Proliferation of Digital Twins for Processes and Objects
- 3.4.1 Market driver analysis
- 3.5 List of Key End-users
- 3.6 Key Opportunities-Prioritized
- 3.7 CAE-Key Company Analysis, 2021
- 3.7.1 Key company analysis, 2021
- 3.8 Industry Analysis-Porter's
- 3.9 CAE-PESTEL Analysis
Chapter 4 CAE: Type Estimates & Trend Analysis
- 4.1 CAE Market: Type Analysis
- 4.1.1 FEA
- 4.1.1.1 Market estimates and forecasts, 2017 - 2030 (USD Million)
- 4.1.2 CFD
- 4.1.2.1 Market estimates and forecasts, 2017 - 2030 (USD Million)
- 4.1.3 Multibody dynamics
- 4.1.3.1 Market estimates and forecasts, 2017 - 2030 (USD Million)
- 4.1.4 Optimization & simulation
- 4.1.4.1 Market estimates and forecasts, 2017 - 2030 (USD Million)
- 4.1.1 FEA
Chapter 5 CAE: Deployment Model Estimates & Trend Analysis
- 5.1 CAE Market: Deployment Model Analysis
- 5.1.1 On-premise
- 5.1.1.1 Market estimates and forecasts, 2017 - 2030 (USD Million)
- 5.1.2 Cloud-based
- 5.1.2.1 Market estimates and forecasts, 2017 - 2030 (USD Million)
- 5.1.1 On-premise
Chapter 6 CAE: End-use Estimates & Trend Analysis
- 6.1 CAE Market: End-use Analysis
- 6.1.1 Automotive
- 6.1.1.1 Market estimates and forecasts, 2017 - 2030 (USD Million)
- 6.1.2 Defense & aerospace
- 6.1.2.1 Market estimates and forecasts, 2017 - 2030 (USD Million)
- 6.1.3 Electronics
- 6.1.3.1 Market estimates and forecasts, 2017 - 2030 (USD Million)
- 6.1.4 Medical devices
- 6.1.4.1 Market estimates and forecasts, 2017 - 2030 (USD Million)
- 6.1.5 Industrial equipment
- 6.1.5.1 Market estimates and forecasts, 2017 - 2030 (USD Million)
- 6.1.6 Others
- 6.1.6.1 Market estimates and forecasts, 2017 - 2030 (USD Million)
- 6.1.1 Automotive
Chapter 7 CAE: Regional Estimates & Trend Analysis
- 7.1 CAE Market Share by Region, 2021 & 2030
- 7.2 North America
- 7.2.1 Market estimates and forecasts, by type, 2017 - 2030 (USD Million)
- 7.2.2 Market estimates and forecasts, by deployment model, 2017 - 2030 (USD Million)
- 7.2.3 Market estimates and forecasts, by end-use, 2017 - 2030 (USD Million)
- 7.2.4 U.S.
- 7.2.4.1 Market estimates and forecasts, by type, 2017 - 2030 (USD Million)
- 7.2.4.2 Market estimates and forecasts, by deployment model, 2017 - 2030 (USD Million)
- 7.2.4.3 Market estimates and forecasts, by end-use, 2017 - 2030 (USD Million)
- 7.2.5 Canada
- 7.2.5.1 Market estimates and forecasts, by type, 2017 - 2030 (USD Million)
- 7.2.5.2 Market estimates and forecasts, by deployment model, 2017 - 2030 (USD Million)
- 7.2.5.3 Market estimates and forecasts, by end-use, 2017 - 2030 (USD Million)
- 7.2.6 Mexico
- 7.2.6.1 Market estimates and forecasts, by type, 2017 - 2030 (USD Million)
- 7.2.6.2 Market estimates and forecasts, by deployment model, 2017 - 2030 (USD Million)
- 7.2.6.3 Market estimates and forecasts, by end-use, 2017 - 2030 (USD Million)
- 7.3 Europe
- 7.3.1 Market estimates and forecasts, by type, 2017 - 2030 (USD Million)
- 7.3.2 Market estimates and forecasts, by deployment model, 2017 - 2030 (USD Million)
- 7.3.3 Market estimates and forecasts, by end-use, 2017 - 2030 (USD Million)
- 7.3.4 Germany
- 7.3.4.1 Market estimates and forecasts, by type, 2017 - 2030 (USD Million)
- 7.3.4.2 Market estimates and forecasts, by deployment model, 2017 - 2030 (USD Million)
- 7.3.4.3 Market estimates and forecasts, by end-use, 2017 - 2030 (USD Million)
- 7.3.5 U.K.
- 7.3.5.1 Market estimates and forecasts, by type, 2017 - 2030 (USD Million)
- 7.3.5.2 Market estimates and forecasts, by deployment model, 2017 - 2030 (USD Million)
- 7.3.5.3 Market estimates and forecasts, by end-use, 2017 - 2030 (USD Million)
- 7.3.6 France
- 7.3.6.1 Market estimates and forecasts, by type, 2017 - 2030 (USD Million)
- 7.3.6.2 Market estimates and forecasts, by deployment model, 2017 - 2030 (USD Million)
- 7.3.6.3 Market estimates and forecasts, by end-use, 2017 - 2030 (USD Million)
- 7.3.7 Italy
- 7.3.7.1 Market estimates and forecasts, by type, 2017 - 2030 (USD Million)
- 7.3.7.2 Market estimates and forecasts, by deployment model, 2017 - 2030 (USD Million)
- 7.3.7.3 Market estimates and forecasts, by end-use, 2017 - 2030 (USD Million)
- 7.3.8 Spain
- 7.3.8.1 Market estimates and forecasts, by type, 2017 - 2030 (USD Million)
- 7.3.8.2 Market estimates and forecasts, by deployment model, 2017 - 2030 (USD Million)
- 7.3.8.3 Market estimates and forecasts, by end-use, 2017 - 2030 (USD Million)
- 7.3.9 Russia
- 7.3.9.1 Market estimates and forecasts, by type, 2017 - 2030 (USD Million)
- 7.3.9.2 Market estimates and forecasts, by deployment model, 2017 - 2030 (USD Million)
- 7.3.9.3 Market estimates and forecasts, by end-use, 2017 - 2030 (USD Million)
- 7.4 Asia Pacific
- 7.4.1 Market estimates and forecasts, by type, 2017 - 2030 (USD Million)
- 7.4.2 Market estimates and forecasts, by deployment model, 2017 - 2030 (USD Million)
- 7.4.3 Market estimates and forecasts, by end-use, 2017 - 2030 (USD Million)
- 7.4.4 China
- 7.4.4.1 Market estimates and forecasts, by type, 2017 - 2030 (USD Million)
- 7.4.4.2 Market estimates and forecasts, by deployment model, 2017 - 2030 (USD Million)
- 7.4.4.3 Market estimates and forecasts, by end-use, 2017 - 2030 (USD Million)
- 7.4.5 India
- 7.4.5.1 Market estimates and forecasts, by type, 2017 - 2030 (USD Million)
- 7.4.5.2 Market estimates and forecasts, by deployment model, 2017 - 2030 (USD Million)
- 7.4.5.3 Market estimates and forecasts, by end-use, 2017 - 2030 (USD Million)
- 7.4.6 Japan
- 7.4.6.1 Market estimates and forecasts, by type, 2017 - 2030 (USD Million)
- 7.4.6.2 Market estimates and forecasts, by deployment model, 2017 - 2030 (USD Million)
- 7.4.6.3 Market estimates and forecasts, by end-use, 2017 - 2030 (USD Million)
- 7.4.7 Singapore
- 7.4.7.1 Market estimates and forecasts, by type, 2017 - 2030 (USD Million)
- 7.4.7.2 Market estimates and forecasts, by deployment model, 2017 - 2030 (USD Million)
- 7.4.7.3 Market estimates and forecasts, by end-use, 2017 - 2030 (USD Million)
- 7.4.8 South Korea
- 7.4.8.1 Market estimates and forecasts, by type, 2017 - 2030 (USD Million)
- 7.4.8.2 Market estimates and forecasts, by deployment model, 2017 - 2030 (USD Million)
- 7.4.8.3 Market estimates and forecasts, by end-use, 2017 - 2030 (USD Million)
- 7.5 South America
- 7.5.1 Market estimates and forecasts, by type, 2017 - 2030 (USD Million)
- 7.5.2 Market estimates and forecasts, by deployment model, 2017 - 2030 (USD Million)
- 7.5.3 Market estimates and forecasts, by end-use, 2017 - 2030 (USD Million)
- 7.5.4 Brazil
- 7.5.4.1 Market estimates and forecasts, by type, 2017 - 2030 (USD Million)
- 7.5.4.2 Market estimates and forecasts, by deployment model, 2017 - 2030 (USD Million)
- 7.5.4.3 Market estimates and forecasts, by end-use, 2017 - 2030 (USD Million)
- 7.6 Middle East and Africa (MEA)
- 7.6.1 Market estimates and forecasts, by type, 2017 - 2030 (USD Million)
- 7.6.2 Market estimates and forecasts, by deployment model, 2017 - 2030 (USD Million)
- 7.6.3 Market estimates and forecasts, by end-use, 2017 - 2030 (USD Million)
Chapter 8 Competitive Landscape
- 8.1 ANSYS, Inc.
- 8.1.1 Company overview
- 8.1.2 Financial performance
- 8.1.3 Product benchmarking
- 8.1.4 Recent developments
- 8.2 Altair Engineering
- 8.2.1 Company overview
- 8.2.2 Product benchmarking
- 8.2.3 Recent developments
- 8.3 Autodesk, Inc.
- 8.3.1 Company overview
- 8.3.2 Financial performance
- 8.3.3 Product benchmarking
- 8.3.4 Recent developments
- 8.4 Bentley Systems, Inc.
- 8.4.1 Company overview
- 8.4.2 Product benchmarking
- 8.4.3 Recent developments
- 8.5 Dassault Systemes
- 8.5.1 Company Overview
- 8.5.2 Financial performance
- 8.5.3 Product Benchmarking
- 8.5.4 Strategic Initiatives
- 8.6 ESI Group
- 8.6.1 Company overview
- 8.6.2 Financial performance
- 8.6.3 Product benchmarking
- 8.6.4 Recent developments
- 8.7 Exa Corporation
- 8.7.1 Company overview
- 8.7.2 Financial performance
- 8.7.3 Product benchmarking
- 8.7.4 Recent developments
- 8.8 Mentor Graphics Corporation (A subsidiary of Siemens AG)
- 8.8.1 Company overview
- 8.8.2 Financial performance
- 8.8.3 Product benchmarking
- 8.8.4 Recent developments
- 8.9 MSC Software Corporation (A subsidiary of Hexagon AB)
- 8.9.1 Company overview
- 8.9.2 Product benchmarking
- 8.9.3 Recent developments
- 8.10 Siemens AG
- 8.10.1 Company overview
- 8.10.2 Financial performance
- 8.10.3 Product benchmarking
- 8.10.4 Recent developments
Chapter 9 Competitive Analysis
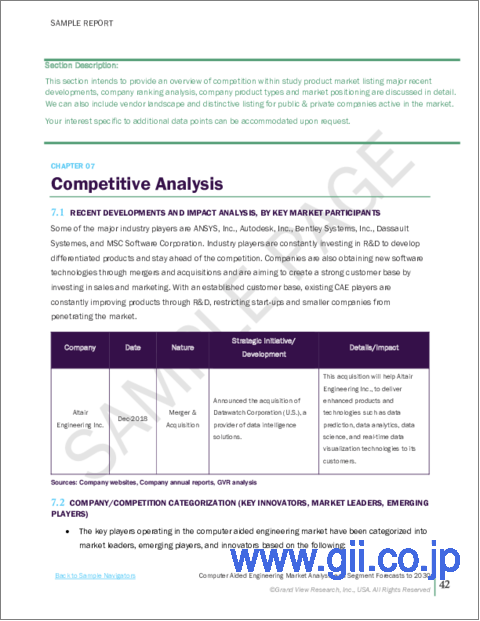
- 9.1 Recent developments & impact analysis, by key market participants
- 9.2 Company competition categorization
- 9.3 Key company market share analysis, 2021
- 9.4 Company ranking analysis