|
|
市場調査レポート
商品コード
1224637
補完代替医療の市場規模、シェア、動向分析レポート:介入別(植物療法、マインドヒーリング、ボディヒーリング、外部エネルギー、センサリーヒーリング)、流通方法別、地域別、セグメント予測、2023年~2030年Complementary And Alternative Medicine Market Size, Share & Trends Analysis Report By Intervention (Botanicals, Mind Healing, Body Healing, External Energy, Sensory Healing), By Distribution Method, By Region, And Segment Forecasts, 2023 - 2030 |
||||||
|
|
|||||||
|
● お客様のご希望に応じて、既存データの加工や未掲載情報(例:国別セグメント)の追加などの対応が可能です。 詳細はお問い合わせください。 |
|||||||


| 補完代替医療の市場規模、シェア、動向分析レポート:介入別(植物療法、マインドヒーリング、ボディヒーリング、外部エネルギー、センサリーヒーリング)、流通方法別、地域別、セグメント予測、2023年~2030年 |
|
出版日: 2023年01月20日
発行: Grand View Research
ページ情報: 英文 180 Pages
納期: 2~10営業日
|
- 全表示
- 概要
- 図表
- 目次
補完代替医療市場の成長と動向
グランドビューリサーチ社の最新レポートによると、世界の補完代替医療市場規模は2030年までに6942億2000万米ドルに達し、2023年から2030年までCAGR25.1%で拡大すると予想されています。神経疾患やがんの有病率の上昇は、世界の補完代替医療産業の成長を促進する主な要因の1つとなっています。
さらに、政府の取り組みや活動の拡大が、世界の補完代替医療産業の成長と発展に寄与しています。世界的に、各国政府は製造・販売プロセスに有利な規則や法律を制定しており、これが世界の産業拡大の原動力となっています。
補完代替医療(CAM)は、伝統的あるいは標準的な医療介入とは異なります。ハーブ、ホメオパシー療法、鍼治療、マッサージ療法、予防医療などを用います。さらに、補完&代替医療は、痛み、疲労、がん、吐き気などの様々な病気の治療に広く利用され、さらに市場の成長を後押ししている自然代替療法の利点の国民の理解を増加させています。
例えば、2019年12月、Modern Acupunctureはフロリダに新しいクリニックを開設し、フロリダで2番目、米国で54番目のModern Acupunctureの拠点となりましたが、これはクリニックの鍼灸サービスを全国に広げ、市場での地位を強化するという同社のビジョンに沿ったものです。
COVID-19の効果的な治療や予防を提供するための多大な努力にもかかわらず、多くの人々が感染し続けています。これは、ウイルスが変化し続け、その結果、ワクチンの効率が低下していることが原因であると思われます。その結果、長期的な免疫強化がSARS-CoV-2感染対策として有望視されているのです。
薬用植物やその他の補完代替療法は、さまざまな健康問題の治療にうまく利用されています。いくつかの研究では、カッピング療法、天然物、指圧がSARS-CoV-2に対して有効であることが示されています。それゆえ、市場にポジティブなインパクトを与えることになります。
治療需要の高まりと継続的なイノベーションに対応して新製品が投入された結果、市場は大きく拡大しました。例えば、2019年、OptumはDaVita Medical Groupを買収しました。この投資は、医師、ヘルスケアプロバイダー、理学療法士、カイロプラクターだけでなく、小児向けの新規治療法の進歩に向けられることになります。
さらに、ほとんどの先進国および発展途上国の人口の約3分の2が、代替療法または補完療法を利用していると報告されています。さらに、先端技術研究への投資の増加や新興国の拡大により、予測期間を通して市場に有利な見通しを与えることが期待されています。
補完代替医療市場のハイライト
介入別では、伝統的代替医療または植物由来製品が2022年に34.19%のシェアを獲得し、市場を独占しています。植物由来製品は、代替治療の主要な形態の一つであり、ハーブ、オイル、その他の治療用サプリメントを組み込んだ治療介入と相まって、天然およびハーブ治療サプリメントを含んでいます。
販売方法別では、2022年に直販部門がより大きなシェアを占めました。メディカルツーリズムの急成長により、直販療法が市場を独占すると予想されます。治療施設の整備や代替医療の支援など、政府の資金援助がこの発展を後押ししている
2022年、欧州がより大きなシェアを占めました。CAMは欧州全域で絶大な人気を得ており、鍼治療など、近代的な薬物療法にあまり依存しない幅広い処置が含まれています。そのため、業界の成長を後押ししている
目次
第1章 調査手法と範囲
- 情報調達
- 情報またはデータ分析
- 市場範囲とセグメントの定義
- 市場モデル
- 市場調査、企業の市場シェア別
- 地域分析
第2章 エグゼクティブサマリー
- 市場のスナップショット
- セグメントのスナップショット
- 競合情勢のスナップショット
第3章 市場変数、動向、および範囲
- 市場セグメンテーションと範囲
- 市場系列の見通し
- 親市場の見通し
- 関連/補助的な市場の見通し
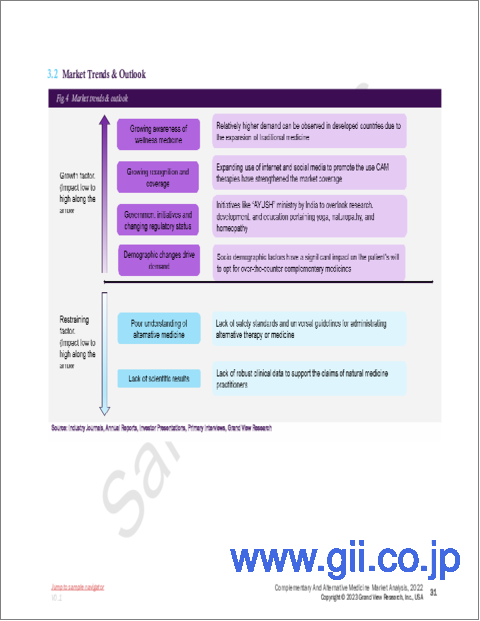
- 市場動向と展望
- 市場力学
- 健康医学への意識の高まり
- 認知度と報道範囲の拡大
- 政府の取り組みと規制状況の変化
- 人口動態の変化が需要を促進
- 市場抑制要因分析
- 科学的結果の欠如
- 代替医療への理解が乏しい
- 2022年の浸透と成長の見通しマッピング
- 事業環境分析
- SWOT分析;要因別(政治と法律、経済と技術)
- ポーターのファイブフォース分析
- COVID-19影響分析
第4章 介入ビジネス分析
- 補完代替医療市場:介入の変動分析
- 伝統的な代替医療/植物
- アーユルヴェーダ
- アピセラピー
- バッチフラワーセラピー
- 自然療法医学
- 伝統的な中国医学
- 伝統韓方医学
- 日本の伝統医学
- 伝統的なモンゴル医学
- 伝統的なチベット医学
- ザンフー理論
- マインドヒーリング
- 自動提案
- ヒプノセラピー
- 神経言語プログラミング
- 自己催眠
- スピリチュアルマインドトリートメント
- 超越瞑想
- ボディヒーリング
- 指圧
- 鍼
- アレクサンダー・テクニーク
- 耳介療法
- 自律訓練法
- カイロプラクティック
- カッピング療法
- キネシオロジー
- 骨筋学
- オステオパシー
- ピラティス
- 気功
- リフレクソロジー
- ヨガ
- 外部エネルギー
- 磁気療法
- 生体磁気療法
- 磁気共鳴療法
- レイキ
- セラピューティックタッチ
- チャクラヒーリング
- 感覚の癒し
- アロマテラピー
- 音楽療法
- 超音波穿刺
- サウンドセラピー
第5章 流通方式のビジネス分析
- 補完代替医療市場:流通方式の変動分析
- 直販
- Eセールス
- 距離対応
第6章 地域ビジネス分析
- 地域別の補完代替医療市場シェア、2022年および2030年
- 北米
- SWOT分析
- 米国
- 主要な国のダイナミクス
- 対象疾患の有病率
- 競合シナリオ
- 規制の枠組み
- 償還シナリオ
- カナダ
- 主要な国のダイナミクス
- 対象疾患の有病率
- 競合シナリオ
- 規制の枠組み
- 償還シナリオ
- 欧州
- SWOT分析
- ドイツ
- 主要な国のダイナミクス
- 対象疾患の有病率
- 競合シナリオ
- 規制の枠組み
- 償還シナリオ
- 英国
- 主要な国のダイナミクス
- 対象疾患の有病率
- 競合シナリオ
- 規制の枠組み
- 償還シナリオ
- フランス
- 主要な国のダイナミクス
- 対象疾患の有病率
- 競合シナリオ
- 規制の枠組み
- 償還シナリオ
- イタリア
- 主要な国のダイナミクス
- 対象疾患の有病率
- 競合シナリオ
- 規制の枠組み
- 償還シナリオ
- スペイン
- 主要な国のダイナミクス
- 対象疾患の有病率
- 競合シナリオ
- 規制の枠組み
- 償還シナリオ
- デンマーク
- 主要な国のダイナミクス
- 対象疾患の有病率
- 競合シナリオ
- 規制の枠組み
- 償還シナリオ
- スウェーデン
- 主要な国のダイナミクス
- 対象疾患の有病率
- 競合シナリオ
- 規制の枠組み
- 償還シナリオ
- ノルウェー
- 主要な国のダイナミクス
- 対象疾患の有病率
- 競合シナリオ
- 規制の枠組み
- 償還シナリオ
- アジア太平洋地域
- SWOT分析
- 日本
- 主要な国のダイナミクス
- 対象疾患の有病率
- 競合シナリオ
- 規制の枠組み
- 償還シナリオ
- 中国
- 主要な国のダイナミクス
- 対象疾患の有病率
- 競合シナリオ
- 規制の枠組み
- 償還シナリオ
- インド
- 主要な国のダイナミクス
- 対象疾患の有病率
- 競合シナリオ
- 規制の枠組み
- 償還シナリオ
- 韓国
- 主要な国のダイナミクス
- 対象疾患の有病率
- 競合シナリオ
- 規制の枠組み
- 償還シナリオ
- オーストラリア
- 主要な国のダイナミクス
- 対象疾患の有病率
- 競合シナリオ
- 規制の枠組み
- 償還シナリオ
- タイ
- 主要な国のダイナミクス
- 対象疾患の有病率
- 競合シナリオ
- 規制の枠組み
- 償還シナリオ
- ラテンアメリカ
- SWOT分析
- ブラジル
- 主要な国のダイナミクス
- 対象疾患の有病率
- 競合シナリオ
- 規制の枠組み
- 償還シナリオ
- メキシコ
- 主要な国のダイナミクス
- 対象疾患の有病率
- 競合シナリオ
- 規制の枠組み
- 償還シナリオ
- アルゼンチン
- 主要な国のダイナミクス
- 対象疾患の有病率
- 競合シナリオ
- 規制の枠組み
- 償還シナリオ
- MEA
- SWOT分析
- 南アフリカ
- 主要な国のダイナミクス
- 対象疾患の有病率
- 競合シナリオ
- 規制の枠組み
- 償還シナリオ
- サウジアラビア
- 主要な国のダイナミクス
- 対象疾患の有病率
- 競合シナリオ
- 規制の枠組み
- 償還シナリオ
- アラブ首長国連邦
- 主要な国のダイナミクス
- 対象疾患の有病率
- 競合シナリオ
- 規制の枠組み
- 償還シナリオ
- クウェート
- 主要な国のダイナミクス
- 対象疾患の有病率
- 競合シナリオ
- 規制の枠組み
- 償還シナリオ
第7章 競合情勢
- 参入企業の概要
- 財務実績
- 参入企業の分類
- 市場のリーダー
- 補完代替医療の市場シェア分析、2022年
- 企業プロファイル
- Abbott
- PerkinElmer, Inc
- BioView
- Agilent Technologies, Inc
- Merck KGaA
- Bio-Rad Laboratories, Inc
- Oxford Gene Technology IP Limited
- Leica Biosystems Nussloch GmbH
- F. Hoffman-La Roche Limited
- NeoGenomics Laboratories, Inc
- Advanced Cell Diagnostics, Inc
- 戦略マッピング
- 拡張
- 取得
- コラボレーション
- 製品/サービスの発売
- パートナーシップ
- その他
List of Tables
- Table 1 List of secondary sources
- Table 2 List of abbreviations
- Table 3 Global Complementary and alternative medicine market by intervention, 2018 - 2030 (USD Million)
- Table 4 Global Complementary and alternative medicine market by distribution method, 2018 - 2030 (USD Million)
- Table 5 North America Complementary and alternative medicine market by intervention, 2018 - 2030 (USD Million)
- Table 6 North America Complementary and alternative medicine market by distribution method, 2018 - 2030 (USD Million)
- Table 7 North America Complementary and alternative medicine market by Country, 2018 - 2030 (USD Million)
- Table 8 U.S. Complementary and alternative medicine market By intervention, 2018 - 2030 (USD Million)
- Table 9 U.S. Complementary and alternative medicine market by distribution method, 2018 - 2030 (USD Million)
- Table 10 Canada Complementary and alternative medicine market By intervention, 2018 - 2030 (USD Million)
- Table 11 Canada Complementary and alternative medicine market by distribution method, 2018 - 2030 (USD Million)
- Table 12 Europe Complementary and alternative medicine market by intervention, 2018 - 2030 (USD Million)
- Table 13 Europe Complementary and alternative medicine market by distribution method, 2018 - 2030 (USD Million)
- Table 14 Europe Complementary and alternative medicine market by Country, 2018 - 2030 (USD Million)
- Table 15 U.K. Complementary and alternative medicine market by intervention, 2018 - 2030 (USD Million)
- Table 16 U.K. Complementary and alternative medicine market by distribution method, 2018 - 2030 (USD Million)
- Table 17 Germany Complementary and alternative medicine market by intervention, 2018 - 2030 (USD Million)
- Table 18 Germany Complementary and alternative medicine market by distribution method, 2018 - 2030 (USD Million)
- Table 19 France Complementary and alternative medicine market by intervention, 2018 - 2030 (USD Million)
- Table 20 France Complementary and alternative medicine market by distribution method, 2018 - 2030 (USD Million)
- Table 21 Italy Complementary and alternative medicine market by intervention, 2018 - 2030 (USD Million)
- Table 22 Italy Complementary and alternative medicine market by distribution method, 2018 - 2030 (USD Million)
- Table 23 Spain Complementary and alternative medicine market by intervention, 2018 - 2030 (USD Million)
- Table 24 Spain Complementary and alternative medicine market by distribution method, 2018 - 2030 (USD Million)
- Table 25 Denmark Complementary and alternative medicine market by intervention, 2018 - 2030 (USD Million)
- Table 26 Denmark Complementary and alternative medicine market by distribution method, 2018 - 2030 (USD Million)
- Table 27 Sweden Complementary and alternative medicine market by intervention, 2018 - 2030 (USD Million)
- Table 28 Sweden Complementary and alternative medicine market by distribution method, 2018 - 2030 (USD Million)
- Table 29 Norway Complementary and alternative medicine market by intervention, 2018 - 2030 (USD Million)
- Table 30 Norway Complementary and alternative medicine market by distribution method, 2018 - 2030 (USD Million)
- Table 31 Asia Pacific Complementary and alternative medicine market by intervention, 2018 - 2030 (USD Million)
- Table 32 Asia Pacific Complementary and alternative medicine market by distribution method, 2018 - 2030 (USD Million)
- Table 33 Asia Pacific Complementary and alternative medicine market by Country, 2018 - 2030 (USD Million)
- Table 34 China Complementary and alternative medicine market by intervention, 2018 - 2030 (USD Million)
- Table 35 China Complementary and alternative medicine market by distribution method, 2018 - 2030 (USD Million)
- Table 36 Japan Complementary and alternative medicine market by intervention, 2018 - 2030 (USD Million)
- Table 37 Japan Complementary and alternative medicine market by distribution method, 2018 - 2030 (USD Million)
- Table 38 India Complementary and alternative medicine market by intervention, 2018 - 2030 (USD Million)
- Table 39 India Complementary and alternative medicine market by distribution method, 2018 - 2030 (USD Million)
- Table 40 Australia Complementary and alternative medicine market by intervention, 2018 - 2030 (USD Million)
- Table 41 Australia Complementary and alternative medicine market by distribution method, 2018 - 2030 (USD Million)
- Table 42 Thailand Complementary and alternative medicine market by intervention, 2018 - 2030 (USD Million)
- Table 43 Thailand Complementary and alternative medicine market by distribution method, 2018 - 2030 (USD Million)
- Table 44 South Korea Complementary and alternative medicine market by intervention, 2018 - 2030 (USD Million)
- Table 45 South Korea Complementary and alternative medicine market by distribution method, 2018 - 2030 (USD Million)
- Table 46 Latin America Complementary and alternative medicine market by intervention, 2018 - 2030 (USD Million)
- Table 47 Latin America Complementary and alternative medicine market by distribution method, 2018 - 2030 (USD Million)
- Table 48 Latin America Complementary and alternative medicine market by Country, 2018 - 2030 (USD Million)
- Table 49 Brazil Complementary and alternative medicine market by intervention, 2018 - 2030 (USD Million)
- Table 50 Brazil Complementary and alternative medicine market by distribution method, 2018 - 2030 (USD Million)
- Table 51 Mexico Complementary and alternative medicine market by intervention, 2018 - 2030 (USD Million)
- Table 52 Mexico Complementary and alternative medicine market by distribution method, 2018 - 2030 (USD Million)
- Table 53 Argentina Complementary and alternative medicine market by intervention, 2018 - 2030 (USD Million)
- Table 54 Argentina Complementary and alternative medicine market by distribution method, 2018 - 2030 (USD Million)
- Table 55 Middle East & Africa Complementary and alternative medicine market By intervention, 2018 - 2030 (USD Million)
- Table 56 Middle East & Africa Complementary and alternative medicine market by distribution method, 2018 - 2030 (USD Million)
- Table 57 Middle East & Africa Complementary and alternative medicine market by Country, 2018 - 2030 (USD Million)
- Table 58 South Africa Complementary and alternative medicine market by intervention, 2018 - 2030 (USD Million)
- Table 59 South Africa Complementary and alternative medicine market by distribution method, 2018 - 2030 (USD Million)
- Table 60 Saudi Arabia Complementary and alternative medicine market by intervention, 2018 - 2030 (USD Million)
- Table 61 Saudi Arabia Complementary and alternative medicine market by distribution method, 2018 - 2030 (USD Million)
- Table 62 UAE Complementary and alternative medicine market by intervention, 2018 - 2030 (USD Million)
- Table 63 UAE Complementary and alternative medicine market by distribution method, 2018 - 2030 (USD Million)
- Table 64 Kuwait Complementary and alternative medicine market by intervention, 2018 - 2030 (USD Million)
- Table 65 Kuwait Complementary and alternative medicine market by distribution method, 2018 - 2030 (USD Million)
- Table 66 Participant's overview
- Table 67 Financial performance
- Table 68 Key companies undergoing expansions
- Table 69 Key companies undergoing acquisitions
- Table 70 Key companies undergoing collaborations
- Table 71 Key companies launching new products/services
- Table 72 Key companies undergoing partnerships
- Table 73 Key companies undertaking other strategies
List of Figures
- Fig. 1 Market research process
- Fig. 2 Data triangulation techniques
- Fig. 3 Primary research pattern
- Fig. 4 Market research approaches
- Fig. 5 Value-chain-based sizing & forecasting
- Fig. 6 QFD modeling for market share assessment
- Fig. 7 Market formulation & validation
- Fig. 8 Market summary, 2022 (USD Million)
- Fig. 9 Market segmentation & scope
- Fig. 10 Market driver impact
- Fig. 11 Market restraint impact
- Fig. 12 Penetration & growth prospect mapping
- Fig. 13 Porter's analysis
- Fig. 14 SWOT analysis
- Fig. 15 Complementary and alternative medicine market: Intervention outlook and key takeaways
- Fig. 16 Complementary and alternative medicine market: Intervention movement analysis
- Fig. 17 Global traditional alternative medicine/botanicals complementary and alternative medicine market, 2018 - 2030 (USD Billion)
- Fig. 18 Global traditional alternative medicine/botanicals complementary and alternative medicine market, 2018 - 2030 (USD Billion)
- Fig. 19 Global Ayurveda complementary and alternative medicine market, 2018 - 2030 (USD Billion)
- Fig. 20 Global apitherapy complementary and alternative medicine market, 2018 - 2030 (USD Billion)
- Fig. 21 Global Bach flower therapy complementary and alternative medicine market, 2018 - 2030 (USD Billion)
- Fig. 22 Global naturopathic medicine complementary and alternative medicine market, 2018 - 2030 (USD Billion)
- Fig. 23 Global traditional Chinese medicine complementary and alternative medicine market, 2018 - 2030 (USD Billion)
- Fig. 24 Global traditional Korean medicine complementary and alternative medicine market, 2018 - 2030 (USD Billion)
- Fig. 25 Global traditional Japanese medicine complementary and alternative medicine market, 2018 - 2030 (USD Billion)
- Fig. 26 Global traditional Mongolian medicine complementary and alternative medicine market, 2018 - 2030 (USD Billion)
- Fig. 27 Global traditional Tibetan medicine complementary and alternative medicine market, 2018 - 2030 (USD Billion)
- Fig. 28 Global Zang Fu theory complementary and alternative medicine market, 2018 - 2030 (USD Billion)
- Fig. 29 Global mind healing complementary and alternative medicine market, 2018 - 2030 (USD Billion)
- Fig. 30 Global autosuggestion complementary and alternative medicine market, 2018 - 2030 (USD Billion)
- Fig. 31 Global hypnotherapy complementary and alternative medicine market, 2018 - 2030 (USD Billion)
- Fig. 32 Global neuro-linguistic programming complementary and alternative medicine market, 2018 - 2030 (USD Billion)
- Fig. 33 Global self-hypnosis complementary and alternative medicine market, 2018 - 2030 (USD Billion)
- Fig. 34 Global spiritual mind treatment complementary and alternative medicine market, 2018 - 2030 (USD Billion)
- Fig. 35 Global transcendental meditation complementary and alternative medicine market, 2018 - 2030 (USD Billion)
- Fig. 36 Global body healing complementary and alternative medicine market, 2018 - 2030 (USD Billion)
- Fig. 37 Global acupressure complementary and alternative medicine market, 2018 - 2030 (USD Billion)
- Fig. 38 Global acupuncture complementary and alternative medicine market, 2018 - 2030 (USD Billion)
- Fig. 39 Global Alexander technique complementary and alternative medicine market, 2018 - 2030 (USD Billion)
- Fig. 40 Global auriculotherapy complementary and alternative medicine market, 2018 - 2030 (USD Billion)
- Fig. 41 Global autogenic training complementary and alternative medicine market, 2018 - 2030 (USD Billion)
- Fig. 42 Global chiropractic treatment complementary and alternative medicine market, 2018 - 2030 (USD Billion)
- Fig. 43 Global cupping therapy complementary and alternative medicine market, 2018 - 2030 (USD Billion)
- Fig. 44 Global kinesiology complementary and alternative medicine market, 2018 - 2030 (USD Billion)
- Fig. 45 Global osteomyology complementary and alternative medicine market, 2018 - 2030 (USD Billion)
- Fig. 46 Global osteopathy complementary and alternative medicine market, 2018 - 2030 (USD Billion)
- Fig. 47 Global Pilates complementary and alternative medicine market, 2018 - 2030 (USD Billion)
- Fig. 48 Global qigong complementary and alternative medicine market, 2018 - 2030 (USD Billion)
- Fig. 49 Global reflexology complementary and alternative medicine market, 2018 - 2030 (USD Billion)
- Fig. 50 Global yoga complementary and alternative medicine market, 2018 - 2030 (USD Billion)
- Fig. 51 Global external energy complementary and alternative medicine market, 2018 - 2030 (USD Billion)
- Fig. 52 Global magnetic therapy complementary and alternative medicine market, 2018 - 2030 (USD Billion)
- Fig. 53 Global bio-magnetic therapy complementary and alternative medicine market, 2018 - 2030 (USD Billion)
- Fig. 54 Global magnetic resonance therapy complementary and alternative medicine market, 2018 - 2030 (USD Billion)
- Fig. 55 Global radionics complementary and alternative medicine market, 2018 - 2030 (USD Billion)
- Fig. 56 Global reiki complementary and alternative medicine market, 2018 - 2030 (USD Billion)
- Fig. 57 Global therapeutic touch complementary and alternative medicine market, 2018 - 2030 (USD Billion)
- Fig. 58 Global chakra healing complementary and alternative medicine market, 2018 - 2030 (USD Billion)
- Fig. 59 Global sensory healing complementary and alternative medicine market, 2018 - 2030 (USD Billion)
- Fig. 60 Global aromatherapy complementary and alternative medicine market, 2018 - 2030 (USD Billion)
- Fig. 61 Global music therapy complementary and alternative medicine market, 2018 - 2030 (USD Billion)
- Fig. 62 Global sonopuncture complementary and alternative medicine market, 2018 - 2030 (USD Billion)
- Fig. 63 Global sound therapy complementary and alternative medicine market, 2018 - 2030 (USD Billion)
- Fig. 64 Top five energy healing complementary and alternative medicine therapies that are most effective
- Fig. 65 Industry participants expected to propel the regional hypnotherapy CAM demand
- Fig. 66 Complementary and alternative medicine market: Distribution method outlook key takeaways
- Fig. 67 Complementary and alternative medicine market: Distribution method market movement analysis
- Fig. 68 Global direct sales complementary and alternative medicine market, 2018 - 2030 (USD Billion)
- Fig. 69 Global E-sales complementary and alternative medicine market, 2018 - 2030 (USD Billion)
- Fig. 70 Global distance correspondence complementary and alternative medicine market, 2018 - 2030 (USD Billion)
- Fig. 71 Complementary and alternative medicine regional marketplace: Key takeaways
- Fig. 72 Complementary and alternative medicine market regional outlook, 2021 & 2030
- Fig. 73 Complementary and alternative medicine market: Regional outlook and key takeaways
- Fig. 74 North America: SWOT Analysis
- Fig. 75 North America Complementary and alternative medicine market, 2018-2030 (USD Million)
- Fig. 76 U.S. key country dynamics
- Fig. 77 U.S. Complementary and alternative medicine market, 2018-2030 (USD Million)
- Fig. 78 Canada key country dynamics
- Fig. 79 Canada Complementary and alternative medicine market, 2018-2030 (USD Million)
- Fig. 80 Europe: SWOT Analysis
- Fig. 81 Europe Complementary and alternative medicine market estimates and forecast, 2018 - 2030 (USD Million)
- Fig. 82 Germany key country dynamics
- Fig. 83 Germany Complementary and alternative medicine market estimates and forecast, 2018 - 2030 (USD Million)
- Fig. 84 France key country dynamics
- Fig. 85 France Complementary and alternative medicine market estimates and forecast, 2018 - 2030 (USD Million)
- Fig. 86 U.K. key country dynamics
- Fig. 87 U.K. Complementary and alternative medicine market estimates and forecast, 2018 - 2030 (USD Million)
- Fig. 88 Italy key country dynamics
- Fig. 89 Italy Complementary and alternative medicine market estimates and forecast, 2018 - 2030 (USD Million)
- Fig. 90 Spain key country dynamics
- Fig. 91 Spain Complementary and alternative medicine market estimates and forecast, 2018 - 2030 (USD Million)
- Fig. 92 Denmark key country dynamics
- Fig. 93 Denmark Complementary and alternative medicine market estimates and forecast, 2018 - 2030 (USD Million)
- Fig. 94 Sweden key country dynamics
- Fig. 95 Sweden Complementary and alternative medicine market estimates and forecast, 2018 - 2030 (USD Million)
- Fig. 96 Norway key country dynamics
- Fig. 97 Norway Complementary and alternative medicine market estimates and forecast, 2018 - 2030 (USD Million)
- Fig. 98 Rest of Europe key country dynamics
- Fig. 99 Rest of Europe Complementary and alternative medicine market estimates and forecast, 2018 - 2030 (USD Million)
- Fig. 100 Asia-Pacific: SWOT Analysis
- Fig. 101 Asia-Pacific Complementary and alternative medicine market estimates and forecast, 2018 - 2030 (USD Million)
- Fig. 102 China key country dynamics
- Fig. 103 China Complementary and alternative medicine market estimates and forecast, 2018 - 2030 (USD Million)
- Fig. 104 India key country dynamics
- Fig. 105 India Complementary and alternative medicine market estimates and forecast, 2018 - 2030 (USD Million)
- Fig. 106 South Korea key country dynamics
- Fig. 107 South Korea Complementary and alternative medicine market estimates and forecast, 2018 - 2030 (USD Million)
- Fig. 108 Japan key country dynamics
- Fig. 109 Japan Complementary and alternative medicine market estimates and forecast, 2018 - 2030 (USD Million)
- Fig. 110 Australia key country dynamics
- Fig. 111 Australia Complementary and alternative medicine market estimates and forecast, 2018 - 2030 (USD Million)
- Fig. 112 Thailand key country dynamics
- Fig. 113 Thailand Complementary and alternative medicine market estimates and forecast, 2018 - 2030 (USD Million)
- Fig. 114 Rest of APAC key country dynamics
- Fig. 115 Rest of APAC Complementary and alternative medicine market estimates and forecast, 2018 - 2030 (USD Million)
- Fig. 116 Latin America: SWOT Analysis
- Fig. 117 Latin America Complementary and alternative medicine market estimates and forecast, 2018 - 2030 (USD Million)
- Fig. 118 Brazil key country dynamics
- Fig. 119 Brazil Complementary and alternative medicine market estimates and forecast, 2018 - 2030 (USD Million)
- Fig. 120 Mexico key country dynamics
- Fig. 121 Mexico Complementary and alternative medicine market estimates and forecast, 2018 - 2030 (USD Million)
- Fig. 122 Argentina key country dynamics
- Fig. 123 Argentina Complementary and alternative medicine market estimates and forecast, 2018 - 2030 (USD Million)
- Fig. 124 Rest of LATAM key country dynamics
- Fig. 125 Rest of LATAM Complementary and alternative medicine market estimates and forecast, 2018 - 2030 (USD Million)
- Fig. 126 MEA: SWOT Analysis
- Fig. 127 MEA Complementary and alternative medicine market estimates and forecast, 2018 - 2030 (USD Million)
- Fig. 128 South Africa key country dynamics
- Fig. 129 South Africa Complementary and alternative medicine market estimates and forecast, 2018 - 2030 (USD Million)
- Fig. 130 Saudi Arabia key country dynamics
- Fig. 131 Saudi Arabia Complementary and alternative medicine market estimates and forecast, 2018 - 2030 (USD Million)
- Fig. 132 UAE key country dynamics
- Fig. 133 UAE Complementary and alternative medicine market estimates and forecast, 2018 - 2030 (USD Million)
- Fig. 134 Kuwait key country dynamics
- Fig. 135 Kuwait Complementary and alternative medicine market estimates and forecast, 2018 - 2030 (USD Million)
- Fig. 136 Rest of MEA key country dynamics
- Fig. 137 Rest of MEA Complementary and alternative medicine market estimates and forecast, 2018 - 2030 (USD Million)
- Fig. 138 Heat map analysis
- Fig. 139 Market participant categorization
- Fig. 140 Complementary and alternative medicine market share analysis, 2022
- Fig. 141 Strategy framework
Complementary And Alternative Medicine Market Growth & Trends:
The global complementary and alternative medicine market size is expected to reach USD 694.22 billion by 2030 and is expected to expand at 25.1% CAGR from 2023 to 2030, according to a new report by Grand View Research, Inc. The rising prevalence of neurological illnesses and cancer is one of the major factors driving the growth of the global complementary & alternative medicine industry.
Furthermore, the expanding government initiatives and activities are contributing to the growth and development of the global complementary & alternative medicine industry. Globally, governments are establishing advantageous rules and legislation for the manufacturing and marketing processes, which is driving the expansion of the global industry.
Complementary & alternative medicine (CAM) differs from traditional or standard medical interventions. It employs herbs, homeopathic remedies, acupuncture, massage therapy, and preventative care. Furthermore, complementary & alternative medicines are widely utilized to treat a variety of illnesses such as pain, exhaustion, cancer, and nausea, and increasing public understanding of the benefits of natural substitute therapies which is further boosting the market growth.
For instance, In December 2019, Modern Acupuncture launched a new clinic in Florida, making it the second Modern Acupuncture location in Florida and the 54th in the U.S. This is in line with the company's vision to spread the clinic's acupuncture services across the country and strengthen its market position.
Despite significant efforts to provide effective COVID-19 therapy and prophylaxis, many people continue to become infected. This could be accounted for by the ongoing virus changes and, as a result, the vaccine's efficiency. As a result, long-term immune enhancement is a promising approach to combating SARS-CoV-2 infection.
Medicinal plants and some other complementary & alternative therapies have been utilized successfully in treating a wide range of health issues. Several studies have shown the efficacy of cupping therapy, natural products, and acupressure against SARS-CoV-2. Hence, it will create a positive impact on the market.
The market has expanded significantly as a result of new products being introduced in response to rising treatment demand and ongoing innovation. For instance, in 2019, Optum acquired DaVita Medical Group. This investment will go toward the advancement of novel therapies for children, as well as physicians, healthcare providers, physiotherapists, and chiropractors.
Furthermore, approximately two-thirds of the populations in most developed and developing countries reported using an alternative or complementary therapy. Furthermore, increased investment in advanced technology research and an expansion of the number of emerging economies are expected to give advantageous prospects for the market throughout the projection period.
Complementary And Alternative Medicine Market Highlights:
- By intervention, traditional alternative medicine or botanicals dominated the market with a share of 34.19% in 2022. Botanicals are among the prominent forms of alternative treatment practices, inclusive of natural and herbal treatment supplements, coupled with therapeutic interventions, incorporating herbs, oils, and other curative supplements
- By distribution method, the direct sales segment held a larger share in 2022. Due to the rapid growth in medical tourism, direct sales therapy is anticipated to dominate the market. Government funding is assisting in this development by upgrading treatment facilities and supporting alternative medicine
- Europe held the larger share in 2022. CAM has gained immense popularity across Europe, including a wide range of procedures less dependent on modern medication, such as acupuncture. Thus, boosting the industry's growth
Table of Contents
Chapter 1. Methodology and Scope
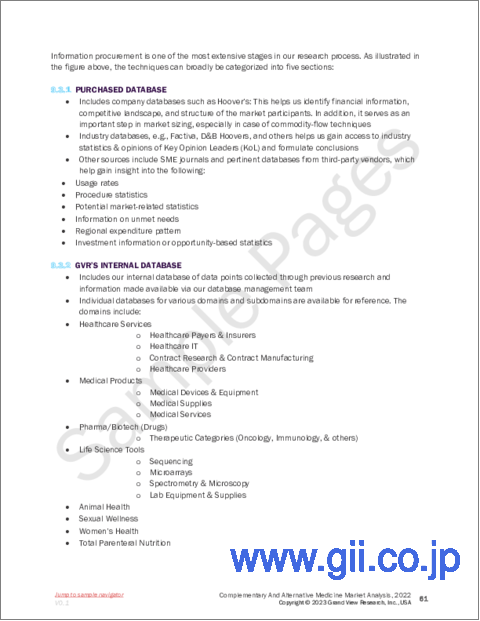
- 1.1. Information Procurement
- 1.2. Information or Data Analysis
- 1.3. Market Scope & Segment Definition
- 1.4. Market Model
- 1.4.1. Market Study, By Company Market Share
- 1.4.2. Regional Analysis
Chapter 2. Executive Summary
- 2.1. Market Snapshot
- 2.2. Segment Snapshot
- 2.3. Competitive Landscape Snapshot
Chapter 3. Market Variables, Trends, & Scope
- 3.1. Market Segmentation and Scope
- 3.2. Market Lineage Outlook
- 3.2.1. Parent Market Outlook
- 3.2.2. Related/Ancillary Market Outlook
- 3.3. Market Trends and Outlook
- 3.4. Market Dynamics
- 3.4.1. Growing awareness of wellness medicine
- 3.4.2. Growing recognition and coverage
- 3.4.3. Government initiatives and changing regulatory status
- 3.4.4. Demographic changes drive demand
- 3.5. Market Restraint Analysis
- 3.5.1. Lack of scientific results
- 3.5.2. Poor understanding of alternative medicine
- 3.6. Penetration and Growth Prospect Mapping 2022
- 3.7. Business Environment Analysis
- 3.7.1. SWOT Analysis; By Factor (Political & Legal, Economic And Technological)
- 3.7.2. Porter's Five Forces Analysis
- 3.8. COVID-19 Impact Analysis
Chapter 4. Intervention Business Analysis
- 4.1. Complementary And Alternative Medicine Market: Intervention Movement Analysis
- 4.2. Traditional Alternative Medicine/Botanicals
- 4.2.1. Traditional Alternative Medicine/Botanicals Market, 2018 - 2030 (USD Million)
- 4.2.1.1. Ayurveda
- 4.2.1.1.1. Ayurveda Market, 2018 - 2030 (USD Million)
- 4.2.1.2. Apitherapy
- 4.2.1.2.1. Apitherapy Market, 2018 - 2030 (USD Million)
- 4.2.1.3. Bach Flower Therapy
- 4.2.1.3.1. Bach Flower Therapy Market, 2018 - 2030 (USD Million)
- 4.2.1.4. Naturopathic Medicine
- 4.2.1.4.1. Naturopathic Medicine Market, 2018 - 2030 (USD Million)
- 4.2.1.5. Traditional Chinese Medicine
- 4.2.1.5.1. Traditional Chinese Medicine Market, 2018 - 2030 (USD Million)
- 4.2.1.6. Traditional Korean Medicine
- 4.2.1.6.1. Traditional Korean Medicine Market, 2018 - 2030 (USD Million)
- 4.2.1.7. Traditional Japanese Medicine
- 4.2.1.7.1. Traditional Japanese Medicine Market, 2018 - 2030 (USD Million)
- 4.2.1.8. Traditional Mongolian Medicine
- 4.2.1.8.1. Traditional Mongolian Medicine Market, 2018 - 2030 (USD Million)
- 4.2.1.9. Traditional Tibetan Medicine
- 4.2.1.9.1. Traditional Tibetan Medicine Market, 2018 - 2030 (USD Million)
- 4.2.1.10. Zang Fu Theory
- 4.2.1.10.1. Zang Fu Theory Market, 2018 - 2030 (USD Million)
- 4.2.1. Traditional Alternative Medicine/Botanicals Market, 2018 - 2030 (USD Million)
- 4.3. Mind Healing
- 4.3.1. Mind Healing Market, 2018 - 2030 (USD Million)
- 4.3.1.1. Autosuggestion
- 4.3.1.1.1. Autosuggestion Market, 2018 - 2030 (USD Million)
- 4.3.1.2. Hypnotherapy
- 4.3.1.2.1. Hypnotherapy Market, 2018 - 2030 (USD Million)
- 4.3.1.3. Neuro-linguistic Programming
- 4.3.1.3.1. Neuro-linguistic Programming Market, 2018 - 2030 (USD Million)
- 4.3.1.4. Self-hypnosis
- 4.3.1.4.1. Self-hypnosis Market, 2018 - 2030 (USD Million)
- 4.3.1.5. Spiritual Mind Treatment
- 4.3.1.5.1. Spiritual Mind Treatment Market, 2018 - 2030 (USD Million)
- 4.3.1.6. Transcendental Meditation
- 4.3.1.6.1. Transcendental Meditation Market, 2018 - 2030 (USD Million)
- 4.3.1. Mind Healing Market, 2018 - 2030 (USD Million)
- 4.4. Body Healing
- 4.4.1. Body Healing Market, 2018 - 2030 (USD Million)
- 4.4.1.1. Acupressure
- 4.4.1.1.1. Acupressure Market, 2018 - 2030 (USD Million)
- 4.4.1.2. Acupuncture
- 4.4.1.2.1. Acupuncture Market, 2018 - 2030 (USD Million)
- 4.4.1.3. Alexander Technique
- 4.4.1.3.1. Alexander Technique Market, 2018 - 2030 (USD Million)
- 4.4.1.4. Auriculotherapy
- 4.4.1.4.1. Auriculotherapy Market, 2018 - 2030 (USD Million)
- 4.4.1.5. Autogenic Training
- 4.4.1.5.1. Autogenic Training Market, 2018 - 2030 (USD Million)
- 4.4.1.6. Chiropractic
- 4.4.1.6.1. Chiropractic Market, 2018 - 2030 (USD Million)
- 4.4.1.7. Cupping Therapy
- 4.4.1.7.1. Cupping Therapy Market, 2018 - 2030 (USD Million)
- 4.4.1.8. Kinesiology
- 4.4.1.8.1. Kinesiology Market, 2018 - 2030 (USD Million)
- 4.4.1.9. Osteomyology
- 4.4.1.9.1. Osteomyology Market, 2018 - 2030 (USD Million)
- 4.4.1.10. Osteopathy
- 4.4.1.10.1. Osteopathy Market, 2018 - 2030 (USD Million)
- 4.4.1.11. Pilates
- 4.4.1.11.1. Pilates Market, 2018 - 2030 (USD Million)
- 4.4.1.12. Qigong
- 4.4.1.12.1. Qigong Market, 2018 - 2030 (USD Million)
- 4.4.1.13. Reflexology
- 4.4.1.13.1. Reflexology Market, 2018 - 2030 (USD Million)
- 4.4.1.14. Yoga
- 4.4.1.14.1. Yoga Market, 2018 - 2030 (USD Million)
- 4.4.1. Body Healing Market, 2018 - 2030 (USD Million)
- 4.5. External Energy
- 4.5.1. External Energy Market, 2018 - 2030 (USD Million)
- 4.5.1.1. Magnetic Therapy
- 4.5.1.1.1. Magnetic Therapy Market, 2018 - 2030 (USD Million)
- 4.5.1.1.1.1. Bio-magnetic Therapy
- 4.5.1.1.1.1.1. Bio-magnetic Therapy Market, 2018 - 2030 (USD Million)
- 4.5.1.1.1.2. Magnetic Resonance Therapy
- 4.5.1.1.1.2.1. Magnetic Resonance Therapy Market, 2018 - 2030 (USD Million)
- 4.5.1.2. Reiki
- 4.5.1.2.1. Reiki Market, 2018 - 2030 (USD Million)
- 4.5.1.3. Therapeutic Touch
- 4.5.1.3.1. Therapeutic Touch Market, 2018 - 2030 (USD Million)
- 4.5.1.4. Chakra Healing
- 4.5.1.4.1. Chakra Healing Market, 2018 - 2030 (USD Million)
- 4.5.1.5. Sensory Healing
- 4.5.1.5.1. Sensory Healing Market, 2018 - 2030 (USD Million)
- 4.5.1.5.2. Aromatherapy
- 4.5.1.5.2.1. Aromatherapy Market, 2018 - 2030 (USD Million)
- 4.5.1.5.3. Music therapy
- 4.5.1.5.3.1. Music therapy Market, 2018 - 2030 (USD Million)
- 4.5.1.5.4. Sonopuncture
- 4.5.1.5.4.1. Sonopuncture Market, 2018 - 2030 (USD Million)
- 4.5.1.5.5. Sound Therapy
- 4.5.1.5.5.1. Sound Therapy Market, 2018 - 2030 (USD Million)
- 4.5.1. External Energy Market, 2018 - 2030 (USD Million)
Chapter 5. Distribution Method Business Analysis
- 5.1. Complementary And Alternative Medicine Market: Distribution Method Movement Analysis
- 5.2. Direct Sales
- 5.2.1. Direct Sales Market, 2018 - 2030 (USD Million)
- 5.3. E-Sales
- 5.3.1. E-Sales Market, 2018 - 2030 (USD Million)
- 5.4. Distance Correspondence
- 5.4.1. Distance Correspondence Market, 2018 - 2030 (USD Million)
Chapter 6. Regional Business Analysis
- 6.1. Complementary And Alternative Medicine Market Share By Region, 2022 & 2030
- 6.2. North America
- 6.2.1. SWOT Analysis
- 6.2.2. North America Complementary and Alternative Medicine Market, by Intervention, 2018 - 2030 (USD Million)
- 6.2.3. North America Complementary And Alternative Medicine Market, By Distribution Method, 2018 - 2030 (USD Million)
- 6.2.4. U.S.
- 6.2.4.1. Key Country Dynamics
- 6.2.4.2. Target Disease Prevalence
- 6.2.4.3. Competitive Scenario
- 6.2.4.4. Regulatory Framework
- 6.2.4.5. Reimbursement Scenario
- 6.2.4.6. U.S. Complementary And Alternative Medicine Market 2018 - 2030 (USD Million)
- 6.2.5. Canada
- 6.2.5.1. Key Country Dynamics
- 6.2.5.2. Target Disease Prevalence
- 6.2.5.3. Competitive Scenario
- 6.2.5.4. Regulatory Framework
- 6.2.5.5. Reimbursement Scenario
- 6.2.5.6. Canada Complementary And Alternative Medicine Market 2018 - 2030 (USD Million)
- 6.3. Europe
- 6.3.1. SWOT Analysis
- 6.3.2. Europe Complementary and Alternative Medicine Market, by Intervention, 2018 - 2030 (USD Million)
- 6.3.3. Europe Complementary And Alternative Medicine Market, By Distribution Method, 2018 - 2030 (USD Million)
- 6.3.4. Germany
- 6.3.4.1. Key Country Dynamics
- 6.3.4.2. Target Disease Prevalence
- 6.3.4.3. Competitive Scenario
- 6.3.4.4. Regulatory Framework
- 6.3.4.5. Reimbursement Scenario
- 6.3.4.6. Germany Complementary And Alternative Medicine Market 2018 - 2030 (USD Million)
- 6.3.5. U.K.
- 6.3.5.1. Key Country Dynamics
- 6.3.5.2. Target Disease Prevalence
- 6.3.5.3. Competitive Scenario
- 6.3.5.4. Regulatory Framework
- 6.3.5.5. Reimbursement Scenario
- 6.3.5.6. U.K. Complementary And Alternative Medicine Market 2018 - 2030 (USD Million)
- 6.3.6. France
- 6.3.6.1. Key Country Dynamics
- 6.3.6.2. Target Disease Prevalence
- 6.3.6.3. Competitive Scenario
- 6.3.6.4. Regulatory Framework
- 6.3.6.5. Reimbursement Scenario
- 6.3.6.6. France Complementary And Alternative Medicine Market 2018 - 2030 (USD Million)
- 6.3.7. Italy
- 6.3.7.1. Key Country Dynamics
- 6.3.7.2. Target Disease Prevalence
- 6.3.7.3. Competitive Scenario
- 6.3.7.4. Regulatory Framework
- 6.3.7.5. Reimbursement Scenario
- 6.3.7.6. Italy Complementary And Alternative Medicine Market 2018 - 2030 (USD Million)
- 6.3.8. Spain
- 6.3.8.1. Key Country Dynamics
- 6.3.8.2. Target Disease Prevalence
- 6.3.8.3. Competitive Scenario
- 6.3.8.4. Regulatory Framework
- 6.3.8.5. Reimbursement Scenario
- 6.3.8.6. Spain Complementary And Alternative Medicine Market 2018 - 2030 (USD Million)
- 6.3.9. Denmark
- 6.3.9.1. Key Country Dynamics
- 6.3.9.2. Target Disease Prevalence
- 6.3.9.3. Competitive Scenario
- 6.3.9.4. Regulatory Framework
- 6.3.9.5. Reimbursement Scenario
- 6.3.9.6. Denmark Complementary And Alternative Medicine Market 2018 - 2030 (USD Million)
- 6.3.10. Sweden
- 6.3.10.1. Key Country Dynamics
- 6.3.10.2. Target Disease Prevalence
- 6.3.10.3. Competitive Scenario
- 6.3.10.4. Regulatory Framework
- 6.3.10.5. Reimbursement Scenario
- 6.3.10.6. Sweden Complementary And Alternative Medicine Market 2018 - 2030 (USD Million)
- 6.3.11. Norway
- 6.3.11.1. Key Country Dynamics
- 6.3.11.2. Target Disease Prevalence
- 6.3.11.3. Competitive Scenario
- 6.3.11.4. Regulatory Framework
- 6.3.11.5. Reimbursement Scenario
- 6.3.11.6. Norway Complementary And Alternative Medicine Market 2018 - 2030 (USD Million)
- 6.4. Asia Pacific
- 6.4.1. SWOT Analysis
- 6.4.2. Asia Pacific Complementary and Alternative Medicine Market, by Intervention, 2018 - 2030 (USD Million)
- 6.4.3. Asia Pacific Complementary And Alternative Medicine Market, By Distribution Method, 2018 - 2030 (USD Million)
- 6.4.4. Japan
- 6.4.4.1. Key Country Dynamics
- 6.4.4.2. Target Disease Prevalence
- 6.4.4.3. Competitive Scenario
- 6.4.4.4. Regulatory Framework
- 6.4.4.5. Reimbursement Scenario
- 6.4.4.6. Japan Complementary And Alternative Medicine Market 2018 - 2030 (USD Million)
- 6.4.5. China
- 6.4.5.1. Key Country Dynamics
- 6.4.5.2. Target Disease Prevalence
- 6.4.5.3. Competitive Scenario
- 6.4.5.4. Regulatory Framework
- 6.4.5.5. Reimbursement Scenario
- 6.4.5.6. China Complementary And Alternative Medicine Market 2018 - 2030 (USD Million)
- 6.4.6. India
- 6.4.6.1. Key Country Dynamics
- 6.4.6.2. Target Disease Prevalence
- 6.4.6.3. Competitive Scenario
- 6.4.6.4. Regulatory Framework
- 6.4.6.5. Reimbursement Scenario
- 6.4.6.6. India Complementary And Alternative Medicine Market 2018 - 2030 (USD Million)
- 6.4.7. South Korea
- 6.4.7.1. Key Country Dynamics
- 6.4.7.2. Target Disease Prevalence
- 6.4.7.3. Competitive Scenario
- 6.4.7.4. Regulatory Framework
- 6.4.7.5. Reimbursement Scenario
- 6.4.7.6. South Korea Complementary And Alternative Medicine Market 2018 - 2030 (USD Million)
- 6.4.8. Australia
- 6.4.8.1. Key Country Dynamics
- 6.4.8.2. Target Disease Prevalence
- 6.4.8.3. Competitive Scenario
- 6.4.8.4. Regulatory Framework
- 6.4.8.5. Reimbursement Scenario
- 6.4.8.6. Australia Complementary And Alternative Medicine Market 2018 - 2030 (USD Million)
- 6.4.9. Thailand
- 6.4.9.1. Key Country Dynamics
- 6.4.9.2. Target Disease Prevalence
- 6.4.9.3. Competitive Scenario
- 6.4.9.4. Regulatory Framework
- 6.4.9.5. Reimbursement Scenario
- 6.4.9.6. Thailand Complementary And Alternative Medicine Market 2018 - 2030 (USD Million)
- 6.5. Latin America
- 6.5.1. SWOT Analysis
- 6.5.2. Latin America Complementary and Alternative Medicine Market, by Intervention, 2018 - 2030 (USD Million)
- 6.5.3. Latin America Complementary And Alternative Medicine Market, By Distribution Method, 2018 - 2030 (USD Million)
- 6.5.4. Brazil
- 6.5.4.1. Key Country Dynamics
- 6.5.4.2. Target Disease Prevalence
- 6.5.4.3. Competitive Scenario
- 6.5.4.4. Regulatory Framework
- 6.5.4.5. Reimbursement Scenario
- 6.5.4.6. Brazil Complementary And Alternative Medicine Market 2018 - 2030 (USD Million)
- 6.5.5. Mexico
- 6.5.5.1. Key Country Dynamics
- 6.5.5.2. Target Disease Prevalence
- 6.5.5.3. Competitive Scenario
- 6.5.5.4. Regulatory Framework
- 6.5.5.5. Reimbursement Scenario
- 6.5.5.6. Mexico Complementary And Alternative Medicine Market 2018 - 2030 (USD Million)
- 6.5.6. Argentina
- 6.5.6.1. Key Country Dynamics
- 6.5.6.2. Target Disease Prevalence
- 6.5.6.3. Competitive Scenario
- 6.5.6.4. Regulatory Framework
- 6.5.6.5. Reimbursement Scenario
- 6.5.6.6. Argentina Complementary And Alternative Medicine Market 2018 - 2030 (USD Million)
- 6.6. MEA
- 6.6.1. SWOT Analysis
- 6.6.2. MEA Complementary and Alternative Medicine Market, by Intervention, 2018 - 2030 (USD Million)
- 6.6.3. MEA Complementary And Alternative Medicine Market, By Distribution Method, 2018 - 2030 (USD Million)
- 6.6.4. South Africa
- 6.6.4.1. Key Country Dynamics
- 6.6.4.2. Target Disease Prevalence
- 6.6.4.3. Competitive Scenario
- 6.6.4.4. Regulatory Framework
- 6.6.4.5. Reimbursement Scenario
- 6.6.4.6. South Africa Complementary And Alternative Medicine Market 2018 - 2030 (USD Million)
- 6.6.5. Saudi Arabia
- 6.6.5.1. Key Country Dynamics
- 6.6.5.2. Target Disease Prevalence
- 6.6.5.3. Competitive Scenario
- 6.6.5.4. Regulatory Framework
- 6.6.5.5. Reimbursement Scenario
- 6.6.5.6. Saudi Arabia Complementary And Alternative Medicine Market 2018 - 2030 (USD Million)
- 6.6.6. UAE
- 6.6.6.1. Key Country Dynamics
- 6.6.6.2. Target Disease Prevalence
- 6.6.6.3. Competitive Scenario
- 6.6.6.4. Regulatory Framework
- 6.6.6.5. Reimbursement Scenario
- 6.6.6.6. UAE Complementary And Alternative Medicine Market 2018 - 2030 (USD Million)
- 6.6.7. Kuwait
- 6.6.7.1. Key Country Dynamics
- 6.6.7.2. Target Disease Prevalence
- 6.6.7.3. Competitive Scenario
- 6.6.7.4. Regulatory Framework
- 6.6.7.5. Reimbursement Scenario
- 6.6.7.6. Kuwait Complementary And Alternative Medicine Market 2018 - 2030 (USD Million)
Chapter 7. Competitive Landscape
- 7.1. Participant's overview
- 7.2. Financial performance
- 7.3. Participant categorization
- 7.3.1. Market Leaders
- 7.3.2. Complementary And Alternative Medicine Market Share Analysis, 2022
- 7.3.3. Company Profiles
- 7.3.3.1. Abbott
- 7.3.3.2. PerkinElmer, Inc
- 7.3.3.3. BioView
- 7.3.3.4. Agilent Technologies, Inc
- 7.3.3.5. Merck KGaA
- 7.3.3.6. Bio-Rad Laboratories, Inc
- 7.3.3.7. Oxford Gene Technology IP Limited
- 7.3.3.8. Leica Biosystems Nussloch GmbH
- 7.3.3.9. F. Hoffman-La Roche Limited
- 7.3.3.10. NeoGenomics Laboratories, Inc
- 7.3.3.11. Advanced Cell Diagnostics, Inc
- 7.3.4. Strategy Mapping
- 7.3.4.1. Expansion
- 7.3.4.2. Acquisition
- 7.3.4.3. Collaborations
- 7.3.4.4. Product/Service Launch
- 7.3.4.5. Partnerships
- 7.3.4.6. Others