|
|
市場調査レポート
商品コード
1751529
グラフェン強化プラスチックの市場規模、シェア、動向分析レポート:製品別、最終用途別、地域別、セグメント予測、2025~2030年Graphene-enhanced Plastics Market Size, Share & Trends Analysis Report By Product (Polymer-Based Composites, Metal-Based Composites), By End Use (Automotive, Aerospace & Defense), By Region, And Segment Forecasts, 2025 - 2030 |
||||||

|
|||||||
カスタマイズ可能
|
|||||||

| グラフェン強化プラスチックの市場規模、シェア、動向分析レポート:製品別、最終用途別、地域別、セグメント予測、2025~2030年 |
|
出版日: 2025年05月26日
発行: Grand View Research
ページ情報: 英文 120 Pages
納期: 2~10営業日
|

全表示
- 概要
- 図表
- 目次
グラフェン強化プラスチック市場の成長と動向
Grand View Research, Inc.の最新レポートによると、グラフェン強化プラスチックの世界市場規模は2030年までに7,915万米ドルに達すると予測され、予測期間中のCAGRは21.23%で成長すると予測されています。
同市場は、先端材料産業における新興セグメントであり、多様な最終用途セグメントの材料性能に変革的な影響を与えることで認知されています。
グラフェン(卓越した機械的、熱的、電気的特性で知られる炭素原子の単層)をプラスチックマトリクスに組み込むことで、メーカーは優れた強度、導電性、耐久性を備えた次世代複合材料を開発しています。これらの材料は、自動車や航空宇宙部品から電子機器のケース、産業用工具、包装ソリューションに至るまで、高性能用途で支持を集めています。
市場の成長を促進する主要因は、技術的に先進的産業で多機能で軽量な材料に対する需要が高まっていることです。従来型強化材や充填材と比較して、グラフェンは低充填量で導電性、バリア性能、構造的完全性の魅力的な組み合わせを記載しています。これにより、メーカーは重量や成形性を犠牲にすることなく、厳しい規制や性能基準を満たすことができます。
グラフェンの分散技術やスケーラブルな製造方法における継続的な技術革新は、特に電気自動車、フレキシブルエレクトロニクス、高熱の産業環境などにおいて、コスト削減や新たな業務用途の開拓に役立っています。
さらに、微生物変換、ガス発酵、バイオマス原料の最適化における進歩は、スケーラブルで商業的に実行可能な生産ルートを可能にしています。このような性能、施策との整合性、気候変動への恩恵の組み合わせにより、グラフェン強化プラスチックは、長期的な回復力とサステイナブル成長を優先する産業にとって、ますます戦略的な材料となっています。
市場関係者は、合併、買収、提携など、さまざまな戦略的取り組みに注力しています。例えば、2025年2月、カナダを拠点とするNova Grapheneは、オーストラリアでグラフェン強化ポリマーシートとグリースを共同開発する覚書を締結しました。
グラフェン強化プラスチック市場レポートのハイライト
- 製品別では、ポリマーベース複合材料が2024年に37.50%の最大収益シェアを占めます。
- 最終用途別では、自動車が2024年に41.22%の最大売上シェアを占めます。
- 北米がグラフェン強化プラスチック産業の世界の優位を占めました。北米におけるスマートインフラとコネクテッドデバイスの台頭が、センシング機能と導電機能を統合したグラフェン強化プラスチックの需要を牽引しています。
- 米国は北米地域の主要市場であり、2024年の売上高市場シェアの約65%を占めました。
目次
第1章 調査手法と範囲
第2章 エグゼクティブサマリー
第3章 グラフェン強化プラスチック市場の変数、動向、範囲
- 市場系統の展望
- 親市場の展望
- 浸透と成長の見込みマッピング
- 産業バリューチェーン分析
- 主要バリューチェーン参加者の利益率分析
- 原料の動向
- 原料価格分析
- 技術概要
- 商業生産技術
- 技術進歩のロードマップ、2018~2030年
- 持続可能性の動向
- リサイクルと循環型経済
- 2018~2030年の平均価格動向分析
- 価格設定に影響を与える主要因
- 供給需要ギャップ分析
- 規制の枠組み
- 施策とインセンティブプラン
- 標準とコンプライアンス
- 規制影響分析
- 市場力学
- 市場促進要因分析
- 市場抑制要因分析
- 産業の課題
- ポーターのファイブフォース分析
- サプライヤーの力
- 買い手の力
- 代替の脅威
- 新規参入者からの脅威
- 競争企業間の敵対関係
- PESTEL分析
- 政治
- 経済
- 社会
- 技術
- 環境
- 法的
第4章 グラフェン強化プラスチック市場:製品の展望の展望と予測
- グラフェン強化プラスチック市場:製品変動分析、2024年と2030年
- ポリマーベース複合材料
- 金属ベース複合材料
- セラミックベース複合材料
第5章 グラフェン強化プラスチック市場:最終用途の展望と予測
- グラフェン強化プラスチック市場:最終用途変動分析、2024年と2030年
- 自動車
- 航空宇宙と防衛
- エレクトロニクス
- エネルギー貯蔵と発電
- 建築・建設
- スポーツ&ウェアラブルグッズ
- その他
第6章 グラフェン強化プラスチック市場の地域展望、展望と予測
- 地域スナップショット
- グラフェン強化プラスチック市場:地域変動分析、2024年と2030年
- 北米
- 市場推定・予測、2018~2030年
- 製品別、2018~2030年
- 最終用途別、2018~2030年
- 米国
- カナダ
- メキシコ
- 欧州
- 市場推定・予測、2018~2030年
- 製品別、2018~2030年
- 最終用途別、2018~2030年
- 英国
- ドイツ
- フランス
- イタリア
- スペイン
- アジア太平洋
- 市場推定・予測、2018~2030年
- 製品別、2018~2030年
- 最終用途別、2018~2030年
- 中国
- インド
- 日本
- 韓国
- オーストラリア
- ラテンアメリカ
- 市場推定・予測、2018~2030年
- 製品別、2018~2030年
- 最終用途別、2018~2030年
- ブラジル
- アルゼンチン
- 中東・アフリカ
- 市場推定・予測、2018~2030年
- 製品別、2018~2030年
- 最終用途別、2018~2030年
- サウジアラビア
- 南アフリカ
第7章 競合情勢
- 主要市場参入企業による最近の動向と影響分析
- ベンダー情勢
- 企業分類
- 主要販売代理店とチャネルパートナー一覧
- 潜在顧客/エンドユーザー一覧
- 競合力学
- 企業の市場シェア分析と市場ポジショニング
- 競合ベンチマーキング
- 戦略マッピング
- ヒートマップ分析
- 企業プロファイル/上場企業
- 参入企業概要
List of Tables
- Table 1 List of Abbreviations
- Table 2 Polymer-Based Composites market estimates and forecasts, 2018 - 2030 (USD Million) (Kilotons)
- Table 3 Metal-Based Composites market estimates and forecasts, 2018 - 2030 (USD Million) (Kilotons)
- Table 4 Ceramic-Based Composites) market estimates and forecasts, 2018 - 2030 (USD Million) (Kilotons)
- Table 5 Automotive market estimates and forecasts, 2018 - 2030 (USD Million) (Kilotons)
- Table 6 Aerospace & Defense market estimates and forecasts, 2018 - 2030 (USD Million) (Kilotons)
- Table 7 Electronics market estimates and forecasts, 2018 - 2030 (USD Million) (Kilotons)
- Table 8 Energy Storage & Generation market estimates and forecasts, 2018 - 2030 (USD Million) (Kilotons)
- Table 9 Building & Construction market estimates and forecasts, 2018 - 2030 (USD Million) (Kilotons)
- Table 10 Sports & Wearable Goods market estimates and forecasts, 2018 - 2030 (USD Million) (Kilotons)
- Table 11 Other End Uses market estimates and forecasts, 2018 - 2030 (USD Million) (Kilotons)
- Table 12 North America graphene-enhanced plastics market estimates and forecasts, by product, 2018 - 2030 (USD Million) (Kilotons)
- Table 13 North America graphene-enhanced plastics market estimates and forecasts, by end use, 2018 - 2030 (USD Million) (Kilotons)
- Table 14 U.S. graphene-enhanced plastics market estimates and forecasts, by product, 2018 - 2030 (USD Million) (Kilotons)
- Table 15 U.S. graphene-enhanced plastics market estimates and forecasts, by end use, 2018 - 2030 (USD Million) (Kilotons)
- Table 16 Canada graphene-enhanced plastics market estimates and forecasts, by product, 2018 - 2030 (USD Million) (Kilotons)
- Table 17 Canada graphene-enhanced plastics market estimates and forecasts, by end use, 2018 - 2030 (USD Million) (Kilotons)
- Table 18 Mexico graphene-enhanced plastics market estimates and forecasts, by product, 2018 - 2030 (USD Million) (Kilotons)
- Table 19 Mexico graphene-enhanced plastics market estimates and forecasts, by end use, 2018 - 2030 (USD Million) (Kilotons)
- Table 20 Europe graphene-enhanced plastics market estimates and forecasts, by product, 2018 - 2030 (USD Million) (Kilotons)
- Table 21 Europe graphene-enhanced plastics market estimates and forecasts, by end use, 2018 - 2030 (USD Million) (Kilotons)
- Table 22 Germany graphene-enhanced plastics market estimates and forecasts, by product, 2018 - 2030 (USD Million) (Kilotons)
- Table 23 Germany graphene-enhanced plastics market estimates and forecasts, by end use, 2018 - 2030 (USD Million) (Kilotons)
- Table 24 UK graphene-enhanced plastics market estimates and forecasts, by product, 2018 - 2030 (USD Million) (Kilotons)
- Table 25 UK graphene-enhanced plastics market estimates and forecasts, by end use, 2018 - 2030 (USD Million) (Kilotons)
- Table 26 France graphene-enhanced plastics market estimates and forecasts, by product, 2018 - 2030 (USD Million) (Kilotons)
- Table 27 France graphene-enhanced plastics market estimates and forecasts, by end use, 2018 - 2030 (USD Million) (Kilotons)
- Table 28 Italy graphene-enhanced plastics market estimates and forecasts, by product, 2018 - 2030 (USD Million) (Kilotons)
- Table 29 Italy graphene-enhanced plastics market estimates and forecasts, by end use, 2018 - 2030 (USD Million) (Kilotons)
- Table 30 Spain graphene-enhanced plastics market estimates and forecasts, by product, 2018 - 2030 (USD Million) (Kilotons)
- Table 31 Spain graphene-enhanced plastics market estimates and forecasts, by end use, 2018 - 2030 (USD Million) (Kilotons)
- Table 32 Asia Pacific graphene-enhanced plastics market estimates and forecasts, by product, 2018 - 2030 (USD Million) (Kilotons)
- Table 33 Asia Pacific graphene-enhanced plastics market estimates and forecasts, by end use, 2018 - 2030 (USD Million) (Kilotons)
- Table 34 China graphene-enhanced plastics market estimates and forecasts, by product, 2018 - 2030 (USD Million) (Kilotons)
- Table 35 China graphene-enhanced plastics market estimates and forecasts, by end use, 2018 - 2030 (USD Million) (Kilotons)
- Table 36 India graphene-enhanced plastics market estimates and forecasts, by product, 2018 - 2030 (USD Million) (Kilotons)
- Table 37 India graphene-enhanced plastics market estimates and forecasts, by end use, 2018 - 2030 (USD Million) (Kilotons)
- Table 38 Japan graphene-enhanced plastics market estimates and forecasts, by product, 2018 - 2030 (USD Million) (Kilotons)
- Table 39 Japan graphene-enhanced plastics market estimates and forecasts, by end use, 2018 - 2030 (USD Million) (Kilotons)
- Table 40 South Korea graphene-enhanced plastics market estimates and forecasts, by product, 2018 - 2030 (USD Million) (Kilotons)
- Table 41 South Korea graphene-enhanced plastics market estimates and forecasts, by end use, 2018 - 2030 (USD Million) (Kilotons)
- Table 42 Australia graphene-enhanced plastics market estimates and forecasts, by product, 2018 - 2030 (USD Million) (Kilotons)
- Table 43 Australia graphene-enhanced plastics market estimates and forecasts, by end use, 2018 - 2030 (USD Million) (Kilotons)
- Table 44 Latin America graphene-enhanced plastics market estimates and forecasts, by product, 2018 - 2030 (USD Million) (Kilotons)
- Table 45 Latin America graphene-enhanced plastics market estimates and forecasts, by end use, 2018 - 2030 (USD Million) (Kilotons)
- Table 46 Brazil graphene-enhanced plastics market estimates and forecasts, by product, 2018 - 2030 (USD Million) (Kilotons)
- Table 47 Brazil graphene-enhanced plastics market estimates and forecasts, by end use, 2018 - 2030 (USD Million) (Kilotons)
- Table 48 Argentina graphene-enhanced plastics market estimates and forecasts, by product, 2018 - 2030 (USD Million) (Kilotons)
- Table 49 Argentina graphene-enhanced plastics market estimates and forecasts, by end use, 2018 - 2030 (USD Million) (Kilotons)
- Table 50 Middle East & Africa graphene-enhanced plastics market estimates and forecasts, by product, 2018 - 2030 (USD Million) (Kilotons)
- Table 51 Middle East & Africa graphene-enhanced plastics market estimates and forecasts, by end use, 2018 - 2030 (USD Million) (Kilotons)
- Table 52 Saudi Arabia graphene-enhanced plastics market estimates and forecasts, by product, 2018 - 2030 (USD Million) (Kilotons)
- Table 53 Saudi Arabia graphene-enhanced plastics market estimates and forecasts, by end use, 2018 - 2030 (USD Million) (Kilotons)
- Table 54 South Africa graphene-enhanced plastics market estimates and forecasts, by product, 2018 - 2030 (USD Million) (Kilotons)
- Table 55 South Africa graphene-enhanced plastics market estimates and forecasts, by end use, 2018 - 2030 (USD Million) (Kilotons)
- Table 56 UAE graphene-enhanced plastics market estimates and forecasts, by product, 2018 - 2030 (USD Million) (Kilotons)
- Table 57 UAE graphene-enhanced plastics market estimates and forecasts, by end use, 2018 - 2030 (USD Million) (Kilotons)
List of Figures
- Fig. 1 Market segmentation
- Fig. 2 Information procurement
- Fig. 3 Data Analysis Models
- Fig. 4 Market Formulation and Validation
- Fig. 5 Market snapshot
- Fig. 6 Segmental outlook- Product, and End Uses
- Fig. 7 Competitive outlook
- Fig. 8 Value chain analysis
- Fig. 9 Market dynamics
- Fig. 10 Porter's Analysis
- Fig. 11 PESTEL Analysis
- Fig. 12 Graphene-enhanced Plastics Market, by Product: Key takeaways
- Fig. 13 Graphene-enhanced Plastics Market, by Product: Market share, 2024 & 2030
- Fig. 14 Graphene-enhanced Plastics Market, by End Use: Key Takeaways
- Fig. 15 Graphene-enhanced Plastics Market, by End Use: Market share, 2024 & 2030
- Fig. 16 Graphene-enhanced Plastics Market, by Region: Key takeaways
- Fig. 17 Graphene-enhanced Plastics Market, by Region: Market share, 2024 & 2030
Graphene-Enhanced Plastics Market Growth & Trends:
The global graphene-enhanced plastics market size is anticipated to reach USD 79.15 million by 2030 and is projected to grow at a CAGR of 21.23% during the forecast period, according to a new report by Grand View Research, Inc. The market is an emerging segment within the advanced materials industry, recognized for its transformative impact on material performance across diverse end-use sectors.
By integrating graphene-a single layer of carbon atoms known for its exceptional mechanical, thermal, and electrical properties-into plastic matrices, manufacturers are developing next-generation composites with superior strength, conductivity, and durability. These materials are gaining traction in high-performance applications ranging from automotive and aerospace components to electronics casings, industrial tooling, and packaging solutions, where conventional plastics often fall short in meeting evolving technical demands.
A key driver fueling the growth of the market is the increasing demand for multifunctional, lightweight materials across technologically advanced industries. Compared to traditional reinforcements and fillers, graphene offers a compelling combination of conductivity, barrier performance, and structural integrity at low filler loadings. This enables manufacturers to meet stringent regulatory and performance standards without compromising on weight or formability.
Ongoing innovations in graphene dispersion techniques and scalable production methods are helping lower costs and unlock new commercial applications, particularly in electric vehicles, flexible electronics, and high-heat industrial environments.
Furthermore, advancements in microbial conversion, gas fermentation, and biomass feedstock optimization have enabled scalable, commercially viable production routes. This combination of performance, policy alignment, and climate benefit makes Graphene-enhanced plastics an increasingly strategic material for industries prioritizing long-term resilience and sustainable growth.
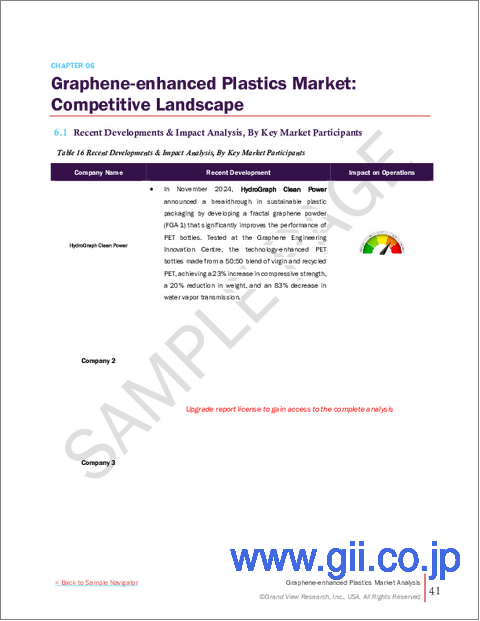
The market players are focusing on various strategic initiatives such as mergers, acquisitions, and collaborations. For instance, in February 2025, Canada-based Nova Graphene signed a memorandum of understanding (MOU) to co-develop graphene-enhanced polymer sheeting and greases in Australia.
Graphene-Enhanced Plastics Market Report Highlights:
- Based on product, polymer-based composites accounted for the largest revenue share of 37.50% in 2024.
- Based on end use, automotive accounted for the largest revenue share of 41.22% in 2024.
- North America dominated the graphene-enhanced plastics industry globally. The rise of smart infrastructure and connected devices in North America is driving demand for graphene-enhanced plastics with integrated sensing and conductive capabilities.
- The U.S. was the leading market in the North America region and captured around 65% of the revenue market share in 2024.
Table of Contents
Chapter 1. Methodology and Scope
- 1.1. Market Segmentation & Scope
- 1.2. Market Definition
- 1.3. Information Procurement
- 1.3.1. Purchased Database
- 1.3.2. GVR's Internal Database
- 1.3.3. Secondary Types & Third-Party Perspectives
- 1.3.4. Primary Research
- 1.4. Information Analysis
- 1.4.1. Data Analysis Models
- 1.5. Market Formulation & Data Visualization
- 1.6. Data Validation & Publishing
Chapter 2. Executive Summary
- 2.1. Market Insights
- 2.2. Segmental Outlook
- 2.3. Competitive Outlook
Chapter 3. Graphene-enhanced Plastics Market Variables, Trends & Scope
- 3.1. Market Lineage Outlook
- 3.1.1. Parent Market Outlook
- 3.2. Penetration & Growth Prospect Mapping
- 3.3. Industry Value Chain Analysis
- 3.3.1. Profit Margin Analysis of Key Value Chain Participants
- 3.3.2. Raw Material Trends
- 3.3.3. Raw Material Price Analysis
- 3.4. Technology Overview
- 3.4.1. Commercial Production Technology
- 3.4.2. Roadmap of Technology Advancement, 2018 to 2030
- 3.5. Sustainability Trends
- 3.5.1. Recycling and Circular Economy
- 3.6. Average Price Trend Analysis, 2018 to 2030 (USD/kg)
- 3.6.1. Key Factors Influencing Pricing
- 3.7. Supply Demand Gap Analysis
- 3.8. Regulatory Framework
- 3.8.1. Policies and Incentive Plans
- 3.8.2. Standards and Compliances
- 3.8.3. Regulatory Impact Analysis
- 3.9. Market Dynamics
- 3.9.1. Market Driver Analysis
- 3.9.2. Market Restraint Analysis
- 3.9.3. Industry Challenges
- 3.10. Porter's Five Forces Analysis
- 3.10.1. Supplier Power
- 3.10.2. Buyer Power
- 3.10.3. Substitution Threat
- 3.10.4. Threat from New Entrants
- 3.10.5. Competitive Rivalry
- 3.11. PESTEL Analysis
- 3.11.1. Political Landscape
- 3.11.2. Economic Landscape
- 3.11.3. Social Landscape
- 3.11.4. Technological Landscape
- 3.11.5. Environmental Landscape
- 3.11.6. Legal Landscape
Chapter 4. Graphene-enhanced Plastics Market: Product Outlook Estimates & Forecasts
- 4.1. Graphene-enhanced Plastics Market: Product Movement Analysis, 2024 & 2030
- 4.1.1. Polymer-Based Composites
- 4.1.1.1. Market estimates and forecast, 2018 - 2030 (USD Million) (Kilotons)
- 4.1.2. Metal-Based Composites
- 4.1.2.1. Market estimates and forecast, 2018 - 2030 (USD Million) (Kilotons)
- 4.1.3. Ceramic-Based Composites
- 4.1.3.1. Market estimates and forecast, 2018 - 2030 (USD Million) (Kilotons)
- 4.1.1. Polymer-Based Composites
Chapter 5. Graphene-enhanced Plastics Market: End Use Outlook Estimates & Forecasts
- 5.1. Graphene-enhanced Plastics Market: End Use Movement Analysis, 2024 & 2030
- 5.1.1. Automotive
- 5.1.1.1. Market estimates and forecast, 2018 - 2030 (USD Million) (Kilotons)
- 5.1.2. Aerospace & Defense
- 5.1.2.1. Market estimates and forecast, 2018 - 2030 (USD Million) (Kilotons)
- 5.1.3. Electronics
- 5.1.3.1. Market estimates and forecast, 2018 - 2030 (USD Million) (Kilotons)
- 5.1.4. Energy Storage & Generation
- 5.1.4.1. Market estimates and forecast, 2018 - 2030 (USD Million) (Kilotons)
- 5.1.5. Building & Construction
- 5.1.5.1. Market estimates and forecast, 2018 - 2030 (USD Million) (Kilotons)
- 5.1.6. Sports & Wearable Goods
- 5.1.6.1. Market estimates and forecast, 2018 - 2030 (USD Million) (Kilotons)
- 5.1.7. Other End Uses
- 5.1.7.1. Market estimates and forecast, 2018 - 2030 (USD Million) (Kilotons)
- 5.1.1. Automotive
Chapter 6. Graphene-enhanced Plastics Market Regional Outlook Estimates & Forecasts
- 6.1. Regional Snapshot
- 6.2. Graphene-enhanced Plastics Market: Regional Movement Analysis, 2024 & 2030
- 6.3. North America
- 6.3.1. Market estimates and forecast, 2018 - 2030 (USD Million) (Kilotons)
- 6.3.2. Market estimates and forecast, by product, 2018 - 2030 (USD Million) (Kilotons)
- 6.3.3. Market estimates and forecast, by end use, 2018 - 2030 (USD Million) (Kilotons)
- 6.3.4. U.S.
- 6.3.4.1. Market estimates and forecast, 2018 - 2030 (USD Million) (Kilotons)
- 6.3.4.2. Market estimates and forecast, by product, 2018 - 2030 (USD Million) (Kilotons)
- 6.3.4.3. Market estimates and forecast, by end use, 2018 - 2030 (USD Million) (Kilotons)
- 6.3.5. Canada
- 6.3.5.1. Market estimates and forecast, 2018 - 2030 (USD Million) (Kilotons)
- 6.3.5.2. Market estimates and forecast, by product, 2018 - 2030 (USD Million) (Kilotons)
- 6.3.5.3. Market estimates and forecast, by end use, 2018 - 2030 (USD Million) (Kilotons)
- 6.3.6. Mexico
- 6.3.6.1. Market estimates and forecast, 2018 - 2030 (USD Million) (Kilotons)
- 6.3.6.2. Market estimates and forecast, by product, 2018 - 2030 (USD Million) (Kilotons)
- 6.3.6.3. Market estimates and forecast, by end use, 2018 - 2030 (USD Million) (Kilotons)
- 6.4. Europe
- 6.4.1. Market estimates and forecast, 2018 - 2030 (USD Million) (Kilotons)
- 6.4.2. Market estimates and forecast, by product, 2018 - 2030 (USD Million) (Kilotons)
- 6.4.3. Market estimates and forecast, by end use, 2018 - 2030 (USD Million) (Kilotons)
- 6.4.4. UK
- 6.4.4.1. Market estimates and forecast, 2018 - 2030 (USD Million) (Kilotons)
- 6.4.4.2. Market estimates and forecast, by product, 2018 - 2030 (USD Million) (Kilotons)
- 6.4.4.3. Market estimates and forecast, by end use, 2018 - 2030 (USD Million) (Kilotons)
- 6.4.5. Germany
- 6.4.5.1. Market estimates and forecast, 2018 - 2030 (USD Million) (Kilotons)
- 6.4.5.2. Market estimates and forecast, by product, 2018 - 2030 (USD Million) (Kilotons)
- 6.4.5.3. Market estimates and forecast, by end use, 2018 - 2030 (USD Million) (Kilotons)
- 6.4.6. France
- 6.4.6.1. Market estimates and forecast, 2018 - 2030 (USD Million) (Kilotons)
- 6.4.6.2. Market estimates and forecast, by product, 2018 - 2030 (USD Million) (Kilotons)
- 6.4.6.3. Market estimates and forecast, by end use, 2018 - 2030 (USD Million) (Kilotons)
- 6.4.7. Italy
- 6.4.7.1. Market estimates and forecast, 2018 - 2030 (USD Million) (Kilotons)
- 6.4.7.2. Market estimates and forecast, by product, 2018 - 2030 (USD Million) (Kilotons)
- 6.4.7.3. Market estimates and forecast, by end use, 2018 - 2030 (USD Million) (Kilotons)
- 6.4.8. Spain
- 6.4.8.1. Market estimates and forecast, 2018 - 2030 (USD Million) (Kilotons)
- 6.4.8.2. Market estimates and forecast, by product, 2018 - 2030 (USD Million) (Kilotons)
- 6.4.8.3. Market estimates and forecast, by end use, 2018 - 2030 (USD Million) (Kilotons)
- 6.5. Asia Pacific
- 6.5.1. Market estimates and forecast, 2018 - 2030 (USD Million) (Kilotons)
- 6.5.2. Market estimates and forecast, by product, 2018 - 2030 (USD Million) (Kilotons)
- 6.5.3. Market estimates and forecast, by end use, 2018 - 2030 (USD Million) (Kilotons)
- 6.5.4. China
- 6.5.4.1. Market estimates and forecast, 2018 - 2030 (USD Million) (Kilotons)
- 6.5.4.2. Market estimates and forecast, by product, 2018 - 2030 (USD Million) (Kilotons)
- 6.5.4.3. Market estimates and forecast, by end use, 2018 - 2030 (USD Million) (Kilotons)
- 6.5.5. India
- 6.5.5.1. Market estimates and forecast, 2018 - 2030 (USD Million) (Kilotons)
- 6.5.5.2. Market estimates and forecast, by product, 2018 - 2030 (USD Million) (Kilotons)
- 6.5.5.3. Market estimates and forecast, by end use, 2018 - 2030 (USD Million) (Kilotons)
- 6.5.6. Japan
- 6.5.6.1. Market estimates and forecast, 2018 - 2030 (USD Million) (Kilotons)
- 6.5.6.2. Market estimates and forecast, by product, 2018 - 2030 (USD Million) (Kilotons)
- 6.5.6.3. Market estimates and forecast, by end use, 2018 - 2030 (USD Million) (Kilotons)
- 6.5.7. South Korea
- 6.5.7.1. Market estimates and forecast, 2018 - 2030 (USD Million) (Kilotons)
- 6.5.7.2. Market estimates and forecast, by product, 2018 - 2030 (USD Million) (Kilotons)
- 6.5.7.3. Market estimates and forecast, by end use, 2018 - 2030 (USD Million) (Kilotons)
- 6.5.8. Australia
- 6.5.8.1. Market estimates and forecast, 2018 - 2030 (USD Million) (Kilotons)
- 6.5.8.2. Market estimates and forecast, by product, 2018 - 2030 (USD Million) (Kilotons)
- 6.5.8.3. Market estimates and forecast, by end use, 2018 - 2030 (USD Million) (Kilotons)
- 6.6. Latin America
- 6.6.1. Market estimates and forecast, 2018 - 2030 (USD Million) (Kilotons)
- 6.6.2. Market estimates and forecast, by product, 2018 - 2030 (USD Million) (Kilotons)
- 6.6.3. Market estimates and forecast, by end use, 2018 - 2030 (USD Million) (Kilotons)
- 6.6.4. Brazil
- 6.6.4.1. Market estimates and forecast, 2018 - 2030 (USD Million) (Kilotons)
- 6.6.4.2. Market estimates and forecast, by product, 2018 - 2030 (USD Million) (Kilotons)
- 6.6.4.3. Market estimates and forecast, by end use, 2018 - 2030 (USD Million) (Kilotons)
- 6.6.5. Argentina
- 6.6.5.1. Market estimates and forecast, 2018 - 2030 (USD Million) (Kilotons)
- 6.6.5.2. Market estimates and forecast, by product, 2018 - 2030 (USD Million) (Kilotons)
- 6.6.5.3. Market estimates and forecast, by end use, 2018 - 2030 (USD Million) (Kilotons)
- 6.7. Middle East & Africa
- 6.7.1. Market estimates and forecast, 2018 - 2030 (USD Million) (Kilotons)
- 6.7.2. Market estimates and forecast, by product, 2018 - 2030 (USD Million) (Kilotons)
- 6.7.3. Market estimates and forecast, by end use, 2018 - 2030 (USD Million) (Kilotons)
- 6.7.4. Saudi Arabia
- 6.7.4.1. Market estimates and forecast, 2018 - 2030 (USD Million) (Kilotons)
- 6.7.4.2. Market estimates and forecast, by product, 2018 - 2030 (USD Million) (Kilotons)
- 6.7.4.3. Market estimates and forecast, by end use, 2018 - 2030 (USD Million) (Kilotons)
- 6.7.5. South Africa
- 6.7.5.1. Market estimates and forecast, 2018 - 2030 (USD Million) (Kilotons)
- 6.7.5.2. Market estimates and forecast, by product, 2018 - 2030 (USD Million) (Kilotons)
- 6.7.5.3. Market estimates and forecast, by end use, 2018 - 2030 (USD Million) (Kilotons)
Chapter 7. Competitive Landscape
- 7.1. Recent Developments & Impact Analysis, By Key Market Participants
- 7.2. Vendor Landscape
- 7.2.1. Company categorization
- 7.2.2. List of Key Distributors and channel Partners
- 7.2.3. List of Potential Customers/End-users
- 7.3. Competitive Dynamics
- 7.3.1. Company Market Share Analysis & Market Positioning
- 7.3.2. Competitive Benchmarking
- 7.3.3. Strategy Mapping
- 7.3.4. Heat Map Analysis
- 7.4. Company Profiles/Listing
- 7.4.1. Participant's overview
- 7.4.2. Financial performance
- 7.4.3. Product benchmarking
- 7.4.3.1. Gerdau Graphene
- 7.4.3.2. HydroGraph Clean Power
- 7.4.3.3. Haydale Graphene Industries
- 7.4.3.4. Graphene Composites Ltd
- 7.4.3.5. Directa Plus
- 7.4.3.6. Black Swan Graphene
