|
|
市場調査レポート
商品コード
1908232
電動工具市場規模、シェア及び動向分析レポート:製品別、作動方式別、用途別、地域別、セグメント別予測(2026年~2033年)Power Tools Market Size, Share & Trends Analysis Report By Product, By Mode of Operation, By Application, By Region, And Segment Forecasts, 2026 - 2033 |
||||||

|
|||||||
カスタマイズ可能
|
|||||||

| 電動工具市場規模、シェア及び動向分析レポート:製品別、作動方式別、用途別、地域別、セグメント別予測(2026年~2033年) |
|
出版日: 2025年12月16日
発行: Grand View Research
ページ情報: 英文 101 Pages
納期: 2~10営業日
|

概要
電動工具市場概要
世界の電動工具市場規模は、2025年に347億1,000万米ドルと推定され、2033年に722億7,000万米ドルに達すると予測されています。
2026~2033年にかけてCAGR9.9%で成長する見込みです。世界各国でインフラ開発プロジェクトが進められていることから、建設活動で使用される電動工具の需要は今後数年間で増加すると予想されます。
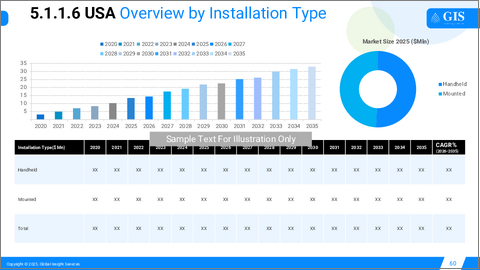
こうした取り組みにより、非住宅建設プロジェクトへの積極的な投資が進み、予測期間中に電動工具の需要を牽引すると見込まれます。米国の電動工具市場は2025年に86.6%の市場シェアを占め、市場を独占しました。米国における電動工具の需要は、建設産業の成長、DIYプロジェクトの普及、産業・製造現場での電動工具採用拡大などの要因により、過去数年間で着実に増加しています。全体として、様々な産業や消費者層にわたる多様な要因に牽引され、米国における電動工具の需要は今後数年間も成長を続けると見込まれます。
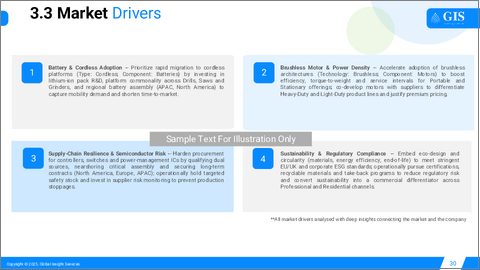
コードレス電動工具の人気は消費者層において顕著に高まっています。バッテリー駆動のコードレス電動工具(圧着工具、ハンマードリル、インパクトドライバー、インパクトレンチ、丸ノコ、その他)は、建設・修理・メンテナンス用途に加え、研磨、金属加工、溶接などの作業にも使用され、複数の最終用途産業で広く採用が進んでいます。リチウムイオン電池を搭載した電動工具は著しい普及を見せており、ニッカド電池やニッケル水素電池といった従来型電池を使用する電動工具に取って代わると予想されています。
技術革新が市場の成長に影響を与えています。各社は製品の効率性を高めるため、技術的に高度な製品を導入しています。例えば、Dewaltが提供するFlexvoltバッテリーは、接続した工具に応じて自動的に電圧を切り替えます。電圧の自動切り替え機能により、有線電動工具を使用する前に手動で出力を調整する必要がなくなります。
技術革新に加え、移動が容易で外部電源を必要としないコードレス工具の普及拡大が市場成長を牽引しています。家庭用途における需要の増加と、近い将来における産業の回復が、予測期間を通じて市場成長を維持すると見込まれています。
よくあるご質問
目次
第1章 調査手法と範囲
第2章 エグゼクティブサマリー
第3章 電動工具市場の変数、動向と範囲
- 市場系統/関連市場展望
- 産業バリューチェーン分析
- 流通チャネル分析
- 規制の枠組み
- 規制と基準
- 市場力学
- ビジネス環境ツール分析:電動工具市場
- ポーターのファイブフォース分析
- PESTLE分析
- 市場混乱分析
第4章 電動工具市場:製品別、推定・動向分析
- 製品別変動分析と市場シェア(2025年と2033年)
- 世界の電動工具市場:製品別、2021~2033年
- ドリル
- 鋸
- レンチ
- グラインダー
- サンダー
- その他
第5章 電動工具市場:作動方式別、推定・動向分析
- 作動方式別変動分析と市場シェア(2025年と2033年)
- 世界の電動工具市場:作動方式別、2021~2033年
- 電動
- 空気圧
- その他
第6章 電動工具市場:用途別、推定・動向分析
- 用途別変動分析と市場シェア(2025年と2033年)
- 世界の電動工具市場:用途別、2021~2033年
- 産業
- 住宅
第7章 電動工具市場:地域別、推定・動向分析
- 地域別市場シェア分析、2025年と2033年
- 北米
- 米国
- カナダ
- 欧州
- ドイツ
- 英国
- フランス
- アジア太平洋
- 中国
- インド
- 日本
- ラテンアメリカ
- ブラジル
- メキシコ
- 中東・アフリカ
第8章 サプライヤー情報
- クラリッチ・マトリックス
- エンゲージメントモデル
- 交渉戦略
- 調達におけるベストプラクティス
- ベンダー選定基準
第9章 競合情勢
- 主要企業、その最近の動向、産業への影響
- 競合の分類
- 企業市況分析
- 企業ヒートマップ分析
- 戦略マッピング(2025年)
- 企業リスト
- Makita Corporation
- Robert Bosch Group
- Stanley Black & Decker
- Techtronic Industries Co., Ltd.
- Emerson Electric Co.
- Atlas Copco
- Hilti Corporation
- Ingersoll Rand, Inc.
- Hitachi Koki Co., Ltd.
- Apex Tool Group, LLC

