|
|
市場調査レポート
商品コード
1908727
デジタルツイン市場規模、シェア、および動向分析レポート:ソリューション別、導入形態別、企業規模別、用途別、最終用途別、地域別、およびセグメント予測(2026年~2033年)Digital Twin Market Size, Share, & Trend Analysis Report By Solution (Component, Process, System), By Deployment, By Enterprise Size, By Application, By End Use, By Region, And Segment Forecasts, 2026 - 2033 |
||||||
|
|||||||
カスタマイズ可能
|
|||||||

| デジタルツイン市場規模、シェア、および動向分析レポート:ソリューション別、導入形態別、企業規模別、用途別、最終用途別、地域別、およびセグメント予測(2026年~2033年) |
|
出版日: 2025年12月19日
発行: Grand View Research
ページ情報: 英文 120 Pages
納期: 2~10営業日
|

概要
デジタルツイン市場概要
世界のデジタルツイン市場規模は、2025年に358億2,000万米ドルと推定され、2026~2033年までCAGR 31.1%で成長し、2033年に3,285億1,000万米ドルに達すると予測されています。
これは、インダストリー4.0の実践の急速な普及、産業全体における予知保全の需要増加、さらに、運用コストとダウンタイム削減用資産のリアルタイムモニタリングニーズの高まりが背景にあります。航空宇宙、自動車、エネルギー、医療、スマートシティなどのセグメントにおける応用範囲の拡大が導入を促進しており、物理システムとデジタルシステム間のシームレスなデータ統合を可能にするIoT、AI、クラウドコンピューティング、5G接続の進歩がこれを支えています。
さらに、持続可能性への投資拡大、規制順守、資源最適化への取り組みが、世界中の企業や政府機関にデジタルツインの導入を促しています。デジタルツインは、効率性向上、イノベーション推進、競争優位性の確立を実現する中核ツールとして位置付けられています。
顧客体験とブランドロイヤルティの向上を目的としたデジタルエクスペリエンスプラットフォーム(DXP)の利用拡大は、デジタルトランスフォーメーション市場に明るい展望をもたらしています。BFSI(銀行・金融・保険)、小売、IT・通信、医療など、様々な産業と産業垂直セグメントの既存企業は、顧客エンゲージメントの向上と製品の市場投入期間短縮を目的に、事業運営にDXPを導入しています。彼らは産業参入企業と提携し、ビジネスモデルにDXPを実装しています。
例えば、2025年5月には、エンダバ社がアリックスパートナー社と提携し、世界中の顧客に包括的でエンドツーエンドの技術主導型ソリューションを提供しました。この協業により、産業特化型オペレーショナルコンサルティングにおけるアリックスパートナー社の深い専門性と、AI、クラウド導入、データ分析などのセグメントにおけるエンダバ社の高度技術的強みが融合し、相互補完的な能力が結集されました。これらのスキルセットを統合することで、デジタルトランスフォーメーションの加速、イノベーションの促進、複雑なビジネス課題への対応を目的としています。この共同アプローチにより、組織はより迅速に動き、リスクを最小限に抑え、より効果的に課題を解決しながら、広範な戦略的目標への集中を維持することが可能となります。
クラウドコンピューティングとエッジコンピューティングは、スケーラブルでコスト効率の高いソリューションの導入を容易にし、デジタルツイン市場を変革しています。クラウドは膨大なデータセットの保存・分析基盤を提供し、エッジコンピューティングはデータ発生源に近い場所での高速処理を保証します。両者の連携により、大企業全体でのデジタルツインのシームレスな統合が可能となり、遠隔モニタリングやリアルタイムコラボレーションを支援します。この動向は特に産業環境において価値が高く、機械の状態に即時対応することで高額な故障を防止し、安全基準の遵守を確保できます。さらに、5G技術の登場はデジタルツイン導入の促進剤として機能しています。高速かつ低遅延の接続性を備えた5Gは、多数のIoTデバイスからデジタルツインプラットフォームへのデータ伝送を円滑に実現します。
よくあるご質問
目次
第1章 調査手法と範囲
第2章 エグゼクティブサマリー
第3章 デジタルツインの変数、動向と範囲
- 市場導入/系統展望
- 産業バリューチェーン分析
- 市場力学
- デジタルツイン分析ツール
- ポーターの分析
- PESTEL分析
第4章 デジタルツイン市場:ソリューション別、推定・動向分析
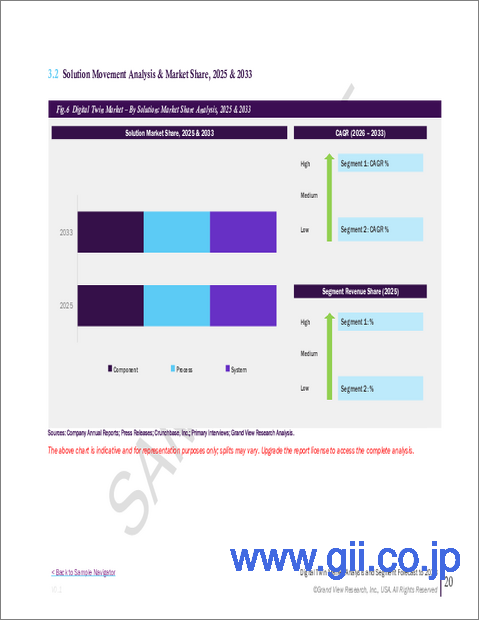
- デジタルツイン:ソリューション別変動分析、2026年と2033年
- コンポーネント
- プロセス
- システム
第5章 デジタルツイン市場:導入形態別、推定・動向分析
- デジタルツイン:導入形態別動向変動分析、2026年と2033年
- クラウド
- オンプレミス
第6章 デジタルツイン市場:企業規模別、展開別、推定・動向分析
- デジタルツイン:企業規模別変動分析、2026年と2033年
- 大企業
- 中小企業(SME)
第7章 デジタルツイン市場:用途別、規模推定・動向分析
- デジタルツイン:用途別変動分析(2026年と2033年)
- 製品設計・開発
- 予知保全
- 業務最適化
- その他
第8章 デジタルツイン市場:最終用途別、推定・動向分析
- デジタルツイン:最終用途別変動分析(2026年と2033年)
- 製造業
- 農業
- 自動車・運輸
- エネルギー公益事業
- 医療ライフサイエンス
- 住宅・商業
- 小売・消費財
- 航空宇宙
- 通信
- その他
第9章 デジタルツイン市場:地域別、推定・動向分析
- 地域別デジタルツインシェア(2026年と2033年)
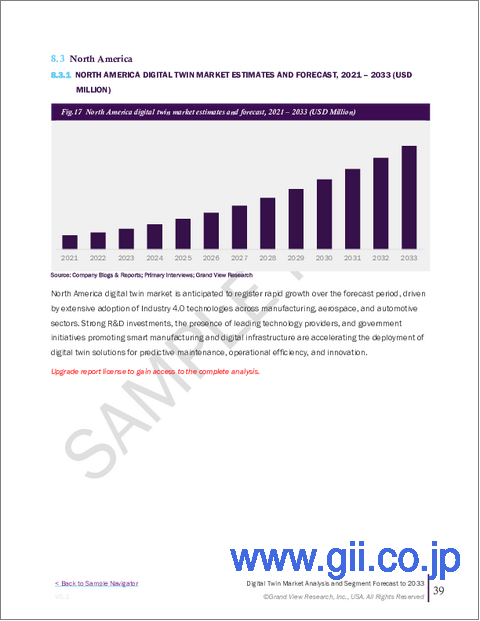
- 北米
- 米国
- カナダ
- メキシコ
- 欧州
- 英国
- ドイツ
- フランス
- アジア太平洋
- 中国
- インド
- 日本
- オーストラリア
- 韓国
- ラテンアメリカ
- ブラジル
- 中東・アフリカ
- サウジアラビア
- アラブ首長国連邦
- 南アフリカ
第10章 競合情勢
- 主要市場参入企業による最近の動向と影響分析
- 企業分類
- 企業シェア分析
- 企業ヒートマップ分析
- 戦略マッピング
- 事業拡大
- 合併・買収
- 提携・協業
- 新製品の発売
- 研究開発
- 企業プロファイル
- ABB
- Amazon Web Enterprise size, Inc.
- ANSYS, Inc.
- Autodesk Inc.
- AVEVA Group Limited
- Bentley Systems, Incorporated
- Dassault Systemes
- General Electric Company
- Hexagon AB
- IBM Corporation
- Microsoft
- PTC
- Robert Bosch GmbH
- Rockwell Automation
- SAP
- Siemens
