|
|
市場調査レポート
商品コード
1728035
心内膜心筋生検の世界市場:市場規模・シェア・動向分析 (製品別・チップ別・最終用途別・地域別)、セグメント別予測 (2025年~2030年)Endomyocardial Biopsy Market Size, Share & Trends Analysis Report By Product (Forceps, Accessories), By Tip (Straight, Pre-curved), By End-use (Hospitals, Ambulatory Surgical Centers), By Region, And Segment Forecasts, 2025 - 2030 |
||||||

|
|||||||
カスタマイズ可能
|
|||||||

| 心内膜心筋生検の世界市場:市場規模・シェア・動向分析 (製品別・チップ別・最終用途別・地域別)、セグメント別予測 (2025年~2030年) |
|
出版日: 2025年04月14日
発行: Grand View Research
ページ情報: 英文 130 Pages
納期: 2~10営業日
|

全表示
- 概要
- 図表
- 目次
心内膜心筋生検市場の成長と動向:
Grand View Research, Incの最新レポートによると、世界の心内膜心筋生検市場は2030年までに5億4,300万米ドルに達すると予測され、2025年から2030年にかけてCAGR 6.9%で拡大すると予測されています。
同市場の成長は、心血管障害(CVD)の有病率の増加、低侵襲外科処置に対する需要の高まり、冠動脈インターベンション処置に対する有利な償還政策などの要因に起因しています。
技術進歩や多国籍企業の新興国への投資の増加は、市場の成長と拡大の理想的な機会となっています。新興国では医療改革が動向し、医療製品や医療機器の技術が進歩しています。これは、メーカーが自社製品を導入し、市場の重要な部分を獲得する機会を生み出します。インドや中国などの開発途上諸国は、医療制度に漸進的な変化をもたらし、患者に充実した治療オプションを提供しています。
さらに、先進国では医療インフラが整備されているため、高度な診断や治療オプションに容易にアクセスできます。United Network for Organ Sharingが発表したデータによると、2022年には米国で4,111件以上の心臓移植が行われました。心臓移植の件数が増えるにつれ、定期的なモニタリングや拒絶反応の早期発見の必要性も高まると思われます。これが心内膜心筋生検の需要をさらに押し上げると思われます。
心内膜心筋生検市場:分析概要
- 鉗子部門は2024年に71.9%の最大売上シェアで製品部門を支配し、主に心血管疾患の有病率の増加と医療技術の進歩に牽引されます。
- アクセサリは、心臓処置の増加や専門的なツールの必要性から、予測期間中にCAGR 6.3%の成長で有利に成長すると予測されています。
- 直線形セグメントが世界の心内膜心筋生検市場を独占し、2024年には36.2%の最大売上シェアを占めました。その理由は、その精密さ、使いやすさ、ルーチン処置への適合性に加え、効率的な組織採取を可能にし、処置時間を短縮し、サンプルの信頼性を高めるストレートデザインにあります。
- 湾曲チップは、複雑な心臓解剖学的構造をナビゲートするための強化された操作性と能力によって、予測期間中に大きなCAGRで成長する見込みです。
- 2024年、病院が最大の収益シェアを占めています。外来手術センター(ASC)セグメントは、予測期間にCAGR 6.0%で成長すると予測されています。
- 北米は、2024年に心内膜心筋生検の世界市場で最大の売上シェアを占めました。これは、先進的な医療インフラ、心血管疾患の有病率の増加、心臓移植手術の増加、早期疾患診断に対する意識の高まりなどが背景にあります。
- アジア太平洋市場は、2025年から2030年にかけて最も速いCAGRで成長すると予測されています。これは、高齢者人口の増加、心疾患の発生率の増加、医療アクセスの改善、政府のイニシアチブに起因しています。
目次
第1章 分析方法・範囲
第2章 エグゼクティブサマリー
第3章 心内膜心筋生検市場:変動要因・傾向・範囲
- 市場連関の見通し
- 親市場の見通し
- 関連/付随市場の見通し
- 市場力学
- 市場促進要因の分析
- 市場抑制要因の分析
- 心内膜心筋生検市場:分析ツール
- 業界分析:ポーターのファイブフォース分析
- PESTEL分析
第4章 世界の心内膜心筋生検市場:製品別のビジネス分析
- 製品別ダッシュボード
- 心内膜心筋生検市場:動向分析、製品別
- 世界の心内膜心筋生検の市場規模と動向分析:製品別(2018~2030年)
- 鉗子
- アクセサリー
第5章 世界の心内膜心筋生検市場:チップ別のビジネス分析
- チップ別ダッシュボード
- 心内膜心筋生検市場:動向分析、チップ別
- 世界の心内膜心筋生検の市場規模と動向分析:チップ別(2018~2030年)
- 可動式
- 直線形
- 湾曲
- その他
第6章 世界の心内膜心筋生検市場:最終用途別のビジネス分析
- 最終用途別ダッシュボード
- 心内膜心筋生検市場:動向分析、最終用途別
- 世界の心内膜心筋生検の市場規模と動向分析:最終用途別(2018~2030年)
- 病院
- 外来手術センター
- その他
第7章 世界の心内膜心筋生検市場:地域別の推定・動向分析
- 市場ダッシュボード:地域別
- 市場シェア分析:地域別(2024年・2030年)
- 世界の心内膜心筋生検市場:主なポイント、地域別
- 北米
- 米国
- カナダ
- メキシコ
- 欧州
- ドイツ
- 英国
- フランス
- イタリア
- スペイン
- デンマーク
- スウェーデン
- ノルウェー
- アジア太平洋
- 日本
- 中国
- インド
- オーストラリア
- タイ
- 韓国
- ラテンアメリカ
- ブラジル
- アルゼンチン
- 中東・アフリカ
- 南アフリカ
- サウジアラビア
- アラブ首長国連邦
- クウェート
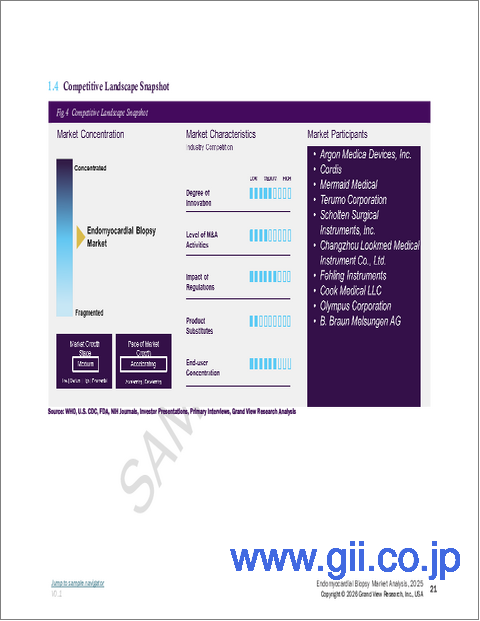
第8章 競合情勢
- 主要市場参入企業による最近の動向と影響分析
- 企業/競合の分類
- ベンダー情勢
- 主要企業のヒートマップ分析(2024年)
- 企業プロファイル
- Argon Medica Devices, Inc.
- Cordis
- Mermaid Medical
- Terumo Corporation
- Scholten Surgical Instruments, Inc.
- Changzhou Lookmed Medical Instrument Co., Ltd.
- Fehling Instruments
List of Tables
- Table 1. List Of Abbreviations
- Table 2. Global Eye Health Supplements Market, By Product, 2018 - 2030 (USD Million)
- Table 3. Global Eye Health Supplements Market, By Tip, 2018 - 2030 (USD Million)
- Table 4. Global Eye Health Supplements Market, By End Use, 2018 - 2030 (USD Million)
- Table 5. Global Eye Health Supplements Market, By Region, 2018 - 2030 (USD Million)
- Table 6. North America Eye Health Supplements Market, By Country, 2018 - 2030 (USD Million)
- Table 7. North America Eye Health Supplements Market, By Product, 2018 - 2030 (USD Million)
- Table 8. North America Eye Health Supplements Market, By Tip, 2018 - 2030 (USD Million)
- Table 9. North America Eye Health Supplements Market, By End Use, 2018 - 2030 (USD Million)
- Table 10. U.S. Eye Health Supplements Market, By Product, 2018 - 2030 (USD Million)
- Table 11. U.S. Eye Health Supplements Market, By Tip, 2018 - 2030 (USD Million)
- Table 12. U.S. Eye Health Supplements Market, By End Use, 2018 - 2030 (USD Million)
- Table 13. Canada Eye Health Supplements Market, By Product, 2018 - 2030 (USD Million)
- Table 14. Canada Eye Health Supplements Market, By Tip, 2018 - 2030 (USD Million)
- Table 15. Canada Eye Health Supplements Market, By End Use, 2018 - 2030 (USD Million)
- Table 16. Mexico Eye Health Supplements Market, By Product, 2018 - 2030 (USD Million)
- Table 17. Mexico Eye Health Supplements Market, By Tip, 2018 - 2030 (USD Million)
- Table 18. Mexico Eye Health Supplements Market, By End Use, 2018 - 2030 (USD Million)
- Table 19. Europe Eye Health Supplements Market, By Country, 2018 - 2030 (USD Million)
- Table 20. Europe Eye Health Supplements Market, By Product, 2018 - 2030 (USD Million)
- Table 21. Europe Eye Health Supplements Market, By Tip, 2018 - 2030 (USD Million)
- Table 22. Europe Eye Health Supplements Market, By End Use, 2018 - 2030 (USD Million)
- Table 23. Germany Eye Health Supplements Market, By Product, 2018 - 2030 (USD Million)
- Table 24. Germany Eye Health Supplements Market, By Tip, 2018 - 2030 (USD Million)
- Table 25. Germany Eye Health Supplements Market, By End Use, 2018 - 2030 (USD Million)
- Table 26. UK Eye Health Supplements Market, By Product, 2018 - 2030 (USD Million)
- Table 27. UK Eye Health Supplements Market, By Tip, 2018 - 2030 (USD Million)
- Table 28. UK Eye Health Supplements Market, By End Use, 2018 - 2030 (USD Million)
- Table 29. France Eye Health Supplements Market, By Product, 2018 - 2030 (USD Million)
- Table 30. France Eye Health Supplements Market, By Tip, 2018 - 2030 (USD Million)
- Table 31. France Eye Health Supplements Market, By End Use, 2018 - 2030 (USD Million)
- Table 32. Italy Eye Health Supplements Market, By Product, 2018 - 2030 (USD Million)
- Table 33. Italy Eye Health Supplements Market, By Tip, 2018 - 2030 (USD Million)
- Table 34. Italy Eye Health Supplements Market, By End Use, 2018 - 2030 (USD Million)
- Table 35. Spain Eye Health Supplements Market, By Product, 2018 - 2030 (USD Million)
- Table 36. Spain Eye Health Supplements Market, By Tip, 2018 - 2030 (USD Million)
- Table 37. Spain Eye Health Supplements Market, By End Use, 2018 - 2030 (USD Million)
- Table 38. Denmark Eye Health Supplements Market, By Product, 2018 - 2030 (USD Million)
- Table 39. Denmark Eye Health Supplements Market, By Tip, 2018 - 2030 (USD Million)
- Table 40. Denmark Eye Health Supplements Market, By End Use, 2018 - 2030 (USD Million)
- Table 41. Sweden Eye Health Supplements Market, By Product, 2018 - 2030 (USD Million)
- Table 42. Sweden Eye Health Supplements Market, By Tip, 2018 - 2030 (USD Million)
- Table 43. Sweden Eye Health Supplements Market, By End Use, 2018 - 2030 (USD Million)
- Table 44. Norway Eye Health Supplements Market, By Product, 2018 - 2030 (USD Million)
- Table 45. Norway Eye Health Supplements Market, By Tip, 2018 - 2030 (USD Million)
- Table 46. Norway Eye Health Supplements Market, By End Use, 2018 - 2030 (USD Million)
- Table 47. Asia Pacific Eye Health Supplements Market, By Country, 2018 - 2030 (USD Million)
- Table 48. Asia Pacific Eye Health Supplements Market, By Product, 2018 - 2030 (USD Million)
- Table 49. Asia Pacific Eye Health Supplements Market, By Tip, 2018 - 2030 (USD Million)
- Table 50. Asia Pacific Eye Health Supplements Market, By End Use, 2018 - 2030 (USD Million)
- Table 51. China Eye Health Supplements Market, By Product, 2018 - 2030 (USD Million)
- Table 52. China Eye Health Supplements Market, By Tip, 2018 - 2030 (USD Million)
- Table 53. China Eye Health Supplements Market, By End Use, 2018 - 2030 (USD Million)
- Table 54. Japan Eye Health Supplements Market, By Product, 2018 - 2030 (USD Million)
- Table 55. Japan Eye Health Supplements Market, By Tip, 2018 - 2030 (USD Million)
- Table 56. Japan Eye Health Supplements Market, By End Use, 2018 - 2030 (USD Million)
- Table 57. India Eye Health Supplements Market, By Product, 2018 - 2030 (USD Million)
- Table 58. India Eye Health Supplements Market, By Tip, 2018 - 2030 (USD Million)
- Table 59. India Eye Health Supplements Market, By End Use, 2018 - 2030 (USD Million)
- Table 60. South Korea Eye Health Supplements Market, By Product, 2018 - 2030 (USD Million)
- Table 61. South Korea Eye Health Supplements Market, By Tip, 2018 - 2030 (USD Million)
- Table 62. South Korea Eye Health Supplements Market, By End Use, 2018 - 2030 (USD Million)
- Table 63. Australia Eye Health Supplements Market, By Product, 2018 - 2030 (USD Million)
- Table 64. Australia Eye Health Supplements Market, By Tip, 2018 - 2030 (USD Million)
- Table 65. Australia Eye Health Supplements Market, By End Use, 2018 - 2030 (USD Million)
- Table 66. Thailand Eye Health Supplements Market, By Product, 2018 - 2030 (USD Million)
- Table 67. Thailand Eye Health Supplements Market, By Tip, 2018 - 2030 (USD Million)
- Table 68. Thailand Eye Health Supplements Market, By End Use, 2018 - 2030 (USD Million)
- Table 69. Latin America Eye Health Supplements Market, By Country, 2018 - 2030 (USD Million)
- Table 70. Latin America Eye Health Supplements Market, By Product, 2018 - 2030 (USD Million)
- Table 71. Latin America Eye Health Supplements Market, By Tip, 2018 - 2030 (USD Million)
- Table 72. Latin America Eye Health Supplements Market, By End Use, 2018 - 2030 (USD Million)
- Table 73. Brazil Eye Health Supplements Market, By Product, 2018 - 2030 (USD Million)
- Table 74. Brazil Eye Health Supplements Market, By Tip, 2018 - 2030 (USD Million)
- Table 75. Argentina Eye Health Supplements Market, By Product, 2018 - 2030 (USD Million)
- Table 76. Argentina Eye Health Supplements Market, By Tip, 2018 - 2030 (USD Million)
- Table 77. Argentina Eye Health Supplements Market, By End Use, 2018 - 2030 (USD Million)
- Table 78. MEA Eye Health Supplements Market, By Region, 2018 - 2030 (USD Million)
- Table 79. MEA Eye Health Supplements Market, By Product, 2018 - 2030 (USD Million)
- Table 80. MEA Eye Health Supplements Market, By Tip, 2018 - 2030 (USD Million)
- Table 81. MEA Eye Health Supplements Market, By End Use, 2018 - 2030 (USD Million)
- Table 82. South Africa Eye Health Supplements Market, By Product, 2018 - 2030 (USD Million)
- Table 83. South Africa Eye Health Supplements Market, By Tip, 2018 - 2030 (USD Million)
- Table 84. South Africa Eye Health Supplements Market, By End Use, 2018 - 2030 (USD Million)
- Table 85. Saudi Arabia Eye Health Supplements Market, By Product, 2018 - 2030 (USD Million)
- Table 86. Saudi Arabia Eye Health Supplements Market, By Tip, 2018 - 2030 (USD Million)
- Table 87. Saudi Arabia Eye Health Supplements Market, By End Use, 2018 - 2030 (USD Million)
- Table 88. UAE Eye Health Supplements Market, By Product, 2018 - 2030 (USD Million)
- Table 89. UAE Eye Health Supplements Market, By Tip, 2018 - 2030 (USD Million)
- Table 90. UAE Eye Health Supplements Market, By End Use, 2018 - 2030 (USD Million)
- Table 91. Kuwait Eye Health Supplements Market, By Product, 2018 - 2030 (USD Million)
- Table 92. Kuwait Eye Health Supplements Market, By Tip, 2018 - 2030 (USD Million)
- Table 93. Eye Health Supplements Market, By End Use, 2018 - 2030 (USD Million)
List of Figures
- Fig. 1 Market Research Process
- Fig. 2 Data Triangulation Techniques
- Fig. 3 Primary Research Pattern
- Fig. 4 Primary Interviews
- Fig. 5 Market Research Approaches
- Fig. 6 Value-Chain-Based Sizing & Forecasting
- Fig. 7 QFD Modeling for Market Share Assessment
- Fig. 8 Market Formulation & Validation
- Fig. 9 Eye Health Supplements Market: Market Outlook
- Fig. 10 Eye Health Supplements Competitive Insights
- Fig. 11 Parent Market Outlook
- Fig. 12 Related/Ancillary Market Outlook
- Fig. 13 Penetration and Growth Prospect Mapping
- Fig. 14 Industry Value Chain Analysis
- Fig. 15 Eye Health Supplements Market Driver Impact
- Fig. 16 Eye Health Supplements Market Restraint Impact
- Fig. 17 Eye Health Supplements Market Strategic Initiatives Analysis
- Fig. 18 Eye Health Supplements Market: Product Movement Analysis
- Fig. 19 Eye Health Supplements Market: Product Outlook and Key Takeaways
- Fig. 20 Forceps Market Estimates and Forecast, 2018 - 2030
- Fig. 21 Accessories Market Estimates and Forecast, 2018 - 2030
- Fig. 22 Eye Health Supplements Market: Tip Movement Analysis
- Fig. 23 Eye Health Supplements Market: Tip Outlook and Key Takeaways
- Fig. 24 Maxi-curved Market Estimates and Forecasts, 2018 - 2030
- Fig. 25 Straight Market Estimates and Forecasts, 2018 - 2030
- Fig. 26 Pre-curved Market Estimates and Forecasts, 2018 - 2030
- Fig. 27 Others Market Estimates and Forecasts, 2018 - 2030
- Fig. 28 Eye Health Supplements Market: End Use Movement Analysis
- Fig. 29 Eye Health Supplements Market: End Use Outlook and Key Takeaways
- Fig. 30 Hospitals Market Estimates and Forecasts, 2018 - 2030
- Fig. 31 Ambulatory Surgical Centers Market Estimates and Forecasts, 2018 - 2030
- Fig. 32 Others Market Estimates and Forecasts, 2018 - 2030
- Fig. 33 Global Eye Health Supplements Market: Regional Movement Analysis
- Fig. 34 Global Eye Health Supplements Market: Regional Outlook and Key Takeaways
- Fig. 35 North America Market Estimates and Forecasts, 2018 - 2030
- Fig. 36 U.S. Market Estimates and Forecasts, 2018 - 2030
- Fig. 37 Canada Market Estimates and Forecasts, 2018 - 2030
- Fig. 38 Mexico Market Estimates and Forecasts, 2018 - 2030
- Fig. 39 Europe Market Estimates and Forecasts, 2018 - 2030
- Fig. 40 UK Market Estimates and Forecasts, 2018 - 2030
- Fig. 41 Germany Market Estimates and Forecasts, 2018 - 2030
- Fig. 42 France Market Estimates and Forecasts, 2018 - 2030
- Fig. 43 Italy Market Estimates and Forecasts, 2018 - 2030
- Fig. 44 Spain Market Estimates and Forecasts, 2018 - 2030
- Fig. 45 Denmark Market Estimates and Forecasts, 2018 - 2030
- Fig. 46 Sweden Market Estimates and Forecasts, 2018 - 2030
- Fig. 47 Norway Market Estimates and Forecasts, 2018 - 2030
- Fig. 48 Asia Pacific Market Estimates and Forecasts, 2018 - 2030
- Fig. 49 China Market Estimates and Forecasts, 2018 - 2030
- Fig. 50 Japan Market Estimates and Forecasts, 2018 - 2030
- Fig. 51 India Market Estimates and Forecasts, 2018 - 2030
- Fig. 52 Thailand Market Estimates and Forecasts, 2018 - 2030
- Fig. 53 South Korea Market Estimates and Forecasts, 2018 - 2030
- Fig. 54 Australia Market Estimates and Forecasts, 2018 - 2030
- Fig. 55 Latin America Market Estimates and Forecasts, 2018 - 2030
- Fig. 56 Brazil Market Estimates and Forecasts, 2018 - 2030
- Fig. 57 Argentina Market Estimates and Forecasts, 2018 - 2030
- Fig. 58 Middle East and Africa Market Estimates and Forecasts, 2018 - 2030
- Fig. 59 South Africa Market Estimates and Forecasts, 2018 - 2030
- Fig. 60 Saudi Arabia Market Estimates and Forecasts, 2018 - 2030
- Fig. 61 UAE Market Estimates and Forecasts, 2018 - 2030
- Fig. 62 Kuwait Market Estimates and Forecasts, 2018 - 2030
Endomyocardial Biopsy Market Growth & Trends:
The global endomyocardial biopsy market is anticipated to reach USD 543.0 million by 2030 and is anticipated to expand at a CAGR of 6.9% from 2025 to 2030, according to a new report by Grand View Research, Inc. The growth of the market is attributed to factors such as increasing prevalence of Cardiovascular Disorders (CVDs), rising demand for minimally invasive surgical procedures, and favorable reimbursement policies for coronary intervention procedures.
An increase in technological advancements and investment of multinational companies in emerging economies serve as ideal opportunities for the growth and expansion of a market. There is a trend of healthcare reforms and advancements in technology for medical products and devices in emerging economies. This creates an opportunity for manufacturers to introduce their products and capture a significant portion of the market. Countries like India, China, and others are developing and are bringing about incremental changes to their healthcare systems, providing enhanced treatment options to patients.
Furthermore, the well-established healthcare infrastructure in developed countries enables easy accessibility to advanced diagnostic and treatment options. According to data published by the United Network for Organ Sharing, in 2022, over 4,111 heart transplants were performed in the U.S. As the number of heart transplants increases, the need for regular monitoring and early detection of rejection would also increase. This would further boost the demand for endomyocardial biopsy procedures.
Endomyocardial Biopsy Market Report Highlights:
- The forceps segment dominated the product segment with the largest revenue share of 71.9% in 2024, primarily driven by the growing prevalence of cardiovascular diseases and advancements in medical technology.
- Accessories are expected to grow at a lucrative CAGR of 6.3% growth over the forecast period, owing to the rising number of cardiac procedures and the need for specialized tools.
- The straight tip segment dominated the global endomyocardial biopsy market and held the largest revenue share of 36.2% in 2024, attributed to their precision, ease of use, and suitability for routine procedures as well as their straightforward design, which allows for efficient tissue collection, reducing procedure time and enhancing sample reliability.
- Pre-curved tips are expected to grow at a significant CAGR over the forecast period, driven by their enhanced maneuverability and capability to navigate complex cardiac anatomy.
- Hospital held the largest revenue share in 2024. The ambulatory surgery center (ASC) segment is anticipated to grow at a CAGR of 6.0% over the forecast period.
- North America dominated the global endomyocardial biopsy market with the largest revenue share in 2024, driven by advanced healthcare infrastructure, increasing prevalence of cardiovascular diseases, rising heart transplant procedures, and growing awareness of early disease diagnosis.
- Asia Pacific market is projected to grow at the fastest CAGR from 2025 to 2030, attributed to a rising geriatric population, increasing occurrence of cardiac disorders, improving healthcare access, and government initiatives.
Table of Contents
Chapter 1. Methodology and Scope
- 1.1. Market Segmentation & Scope
- 1.2. Segment Definitions
- 1.2.1. Product
- 1.2.2. Tip
- 1.2.3. End Use
- 1.3. Research Methodology
- 1.4. Information Procurement
- 1.4.1. Purchased Database
- 1.4.2. GVR's Internal Database
- 1.4.3. Secondary Sources
- 1.4.4. Primary Research
- 1.5. Information or Data Analysis
- 1.5.1. Data Analysis Models
- 1.6. Market Formulation & Validation
- 1.7. Model Details
- 1.8. List of Secondary Sources
- 1.9. Objectives
Chapter 2. Executive Summary
- 2.1. Market Outlook
- 2.2. Segment Outlook
- 2.2.1. Product Outlook
- 2.2.2. Tip Outlook
- 2.2.3. End Use Outlook
- 2.2.4. Regional Outlook
- 2.3. Competitive Insights
Chapter 3. Global Endomyocardial Biopsy Market Variables, Trends, & Scope
- 3.1. Market Lineage Outlook
- 3.1.1. Parent Market Outlook
- 3.1.2. Related/Ancillary Market Outlook
- 3.2. Market Dynamics
- 3.2.1. Market Driver Analysis
- 3.2.2. Market Restraint Analysis
- 3.3. Global Endomyocardial Biopsy Market Analysis Tools
- 3.3.1. Industry Analysis - Porter's Five Forces Analysis
- 3.3.1.1. Supplier Power
- 3.3.1.2. Buyer Power
- 3.3.1.3. Substitution Threat
- 3.3.1.4. Threat of New Entrants
- 3.3.1.5. Competitive Rivalry
- 3.3.2. PESTLE Analysis
- 3.3.2.1. Political Landscape
- 3.3.2.2. Technological Landscape
- 3.3.2.3. Economic Landscape
- 3.3.1. Industry Analysis - Porter's Five Forces Analysis
Chapter 4. Global Endomyocardial Biopsy Market: Product Business Analysis
- 4.1. Product Segment Dashboard
- 4.2. Endomyocardial Biopsy Market: Product Movement Analysis
- 4.3. Global Endomyocardial Biopsy Market Size & Trend Analysis, By Product, 2018 to 2030 (USD Million)
- 4.4. Forceps
- 4.4.1. Market Estimates and Forecasts 2018 to 2030 (USD Million)
- 4.5. Accessories
- 4.5.1. Market Estimates and Forecasts 2018 to 2030 (USD Million)
Chapter 5. Global Endomyocardial Biopsy Market: Tip Business Analysis
- 5.1. Tip Segment Dashboard
- 5.2. Endomyocardial Biopsy Market: Tip Movement Analysis
- 5.3. Global Endomyocardial Biopsy Market Size & Trend Analysis, By Tip, 2018 to 2030 (USD Million)
- 5.4. Maxi-curved
- 5.4.1. Market Estimates and Forecasts 2018 to 2030 (USD Million)
- 5.5. Straight
- 5.5.1. Market Estimates and Forecasts 2018 to 2030 (USD Million)
- 5.6. Pre-curved
- 5.6.1. Market Estimates and Forecasts 2018 to 2030 (USD Million)
- 5.7. Others
- 5.7.1. Market Estimates and Forecasts 2018 to 2030 (USD Million)
Chapter 6. Global Endomyocardial Biopsy Market: End Use Business Analysis
- 6.1. End Use Segment Dashboard
- 6.2. Endomyocardial Biopsy Market: End Use Movement Analysis
- 6.3. Global Endomyocardial Biopsy Market Size & Trend Analysis, By End Use, 2018 to 2030 (USD Million)
- 6.4. Hospitals
- 6.4.1. Market Estimates and Forecasts 2018 to 2030 (USD Million)
- 6.5. Ambulatory Surgical Centers
- 6.5.1. Market Estimates and Forecasts 2018 to 2030 (USD Million)
- 6.6. Others
- 6.6.1. Market Estimates and Forecasts 2018 to 2030 (USD Million)
Chapter 7. Global Endomyocardial Biopsy Market: Regional Estimates & Trend Analysis
- 7.1. Regional Market Dashboard
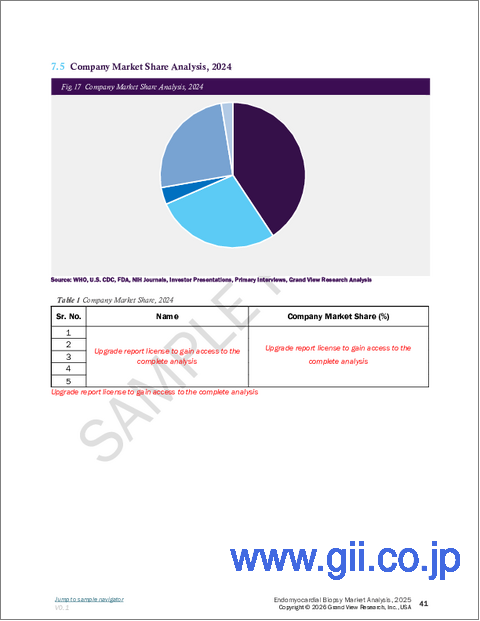
- 7.2. Regional Market Share Analysis, 2024 & 2030
- 7.3. Global Endomyocardial Biopsy Market by Regional: Key Takeaways
- 7.4. North America
- 7.4.1. U.S.
- 7.4.1.1. Key Country Dynamics
- 7.4.1.2. Regulatory Framework/ Reimbursement Structure
- 7.4.1.3. Competitive Scenario
- 7.4.1.4. U.S. Market Estimates and Forecasts 2018 to 2030 (USD Million)
- 7.4.2. Canada
- 7.4.2.1. Key Country Dynamics
- 7.4.2.2. Regulatory Framework/ Reimbursement Structure
- 7.4.2.3. Competitive Scenario
- 7.4.2.4. Canada Market Estimates and Forecasts 2018 to 2030 (USD Million)
- 7.4.3. Mexico
- 7.4.3.1. Key Country Dynamics
- 7.4.3.2. Regulatory Framework/ Reimbursement Structure
- 7.4.3.3. Competitive Scenario
- 7.4.3.4. Mexico Market Estimates and Forecasts 2018 to 2030 (USD Million)
- 7.4.1. U.S.
- 7.5. Europe
- 7.5.1. Germany
- 7.5.1.1. Key Country Dynamics
- 7.5.1.2. Regulatory Framework/ Reimbursement Structure
- 7.5.1.3. Competitive Scenario
- 7.5.1.4. Germany Market Estimates and Forecasts 2018 to 2030 (USD Million)
- 7.5.2. UK
- 7.5.2.1. Key Country Dynamics
- 7.5.2.2. Regulatory Framework/ Reimbursement Structure
- 7.5.2.3. Competitive Scenario
- 7.5.2.4. UK Market Estimates and Forecasts 2018 to 2030 (USD Million)
- 7.5.3. France
- 7.5.3.1. Key Country Dynamics
- 7.5.3.2. Regulatory Framework/ Reimbursement Structure
- 7.5.3.3. Competitive Scenario
- 7.5.3.4. France Market Estimates and Forecasts 2018 to 2030 (USD Million)
- 7.5.4. Italy
- 7.5.4.1. Key Country Dynamics
- 7.5.4.2. Regulatory Framework/ Reimbursement Structure
- 7.5.4.3. Competitive Scenario
- 7.5.4.4. Italy Market Estimates and Forecasts 2018 to 2030 (USD Million)
- 7.5.5. Spain
- 7.5.5.1. Key Country Dynamics
- 7.5.5.2. Regulatory Framework/ Reimbursement Structure
- 7.5.5.3. Competitive Scenario
- 7.5.5.4. Spain Market Estimates and Forecasts 2018 to 2030 (USD Million)
- 7.5.6. Denmark
- 7.5.6.1. Key Country Dynamics
- 7.5.6.2. Regulatory Framework/ Reimbursement Structure
- 7.5.6.3. Competitive Scenario
- 7.5.6.4. Denmark Market Estimates and Forecasts 2018 to 2030 (USD Million)
- 7.5.7. Sweden
- 7.5.7.1. Key Country Dynamics
- 7.5.7.2. Regulatory Framework/ Reimbursement Structure
- 7.5.7.3. Competitive Scenario
- 7.5.7.4. Sweden Market Estimates and Forecasts 2018 to 2030 (USD Million)
- 7.5.8. Norway
- 7.5.8.1. Key Country Dynamics
- 7.5.8.2. Regulatory Framework/ Reimbursement Structure
- 7.5.8.3. Competitive Scenario
- 7.5.8.4. Norway Market Estimates and Forecasts 2018 to 2030 (USD Million)
- 7.5.1. Germany
- 7.6. Asia Pacific
- 7.6.1. Japan
- 7.6.1.1. Key Country Dynamics
- 7.6.1.2. Regulatory Framework/ Reimbursement Structure
- 7.6.1.3. Competitive Scenario
- 7.6.1.4. Japan Market Estimates and Forecasts 2018 to 2030 (USD Million)
- 7.6.2. China
- 7.6.2.1. Key Country Dynamics
- 7.6.2.2. Regulatory Framework/ Reimbursement Structure
- 7.6.2.3. Competitive Scenario
- 7.6.2.4. China Market Estimates and Forecasts 2018 to 2030 (USD Million)
- 7.6.3. India
- 7.6.3.1. Key Country Dynamics
- 7.6.3.2. Regulatory Framework/ Reimbursement Structure
- 7.6.3.3. Competitive Scenario
- 7.6.3.4. India Market Estimates and Forecasts 2018 to 2030 (USD Million)
- 7.6.4. Australia
- 7.6.4.1. Key Country Dynamics
- 7.6.4.2. Regulatory Framework/ Reimbursement Structure
- 7.6.4.3. Competitive Scenario
- 7.6.4.4. Australia Market Estimates and Forecasts 2018 to 2030 (USD Million)
- 7.6.5. Thailand
- 7.6.5.1. Key Country Dynamics
- 7.6.5.2. Regulatory Framework/ Reimbursement Structure
- 7.6.5.3. Competitive Scenario
- 7.6.5.4. Thailand Market Estimates and Forecasts 2018 to 2030 (USD Million)
- 7.6.6. South Korea
- 7.6.6.1. Key Country Dynamics
- 7.6.6.2. Regulatory Framework/ Reimbursement Structure
- 7.6.6.3. Competitive Scenario
- 7.6.6.4. South Korea Market Estimates and Forecasts 2018 to 2030 (USD Million)
- 7.6.1. Japan
- 7.7. Latin America
- 7.7.1. Brazil
- 7.7.1.1. Key Country Dynamics
- 7.7.1.2. Regulatory Framework/ Reimbursement Structure
- 7.7.1.3. Competitive Scenario
- 7.7.1.4. Brazil Market Estimates and Forecasts 2018 to 2030 (USD Million)
- 7.7.2. Argentina
- 7.7.2.1. Key Country Dynamics
- 7.7.2.2. Regulatory Framework/ Reimbursement Structure
- 7.7.2.3. Competitive Scenario
- 7.7.2.4. Argentina Market Estimates and Forecasts 2018 to 2030 (USD Million)
- 7.7.1. Brazil
- 7.8. Middle East & Africa
- 7.8.1. South Africa
- 7.8.1.1. Key Country Dynamics
- 7.8.1.2. Regulatory Framework/ Reimbursement Structure
- 7.8.1.3. Competitive Scenario
- 7.8.1.4. South Africa Market Estimates and Forecasts 2018 to 2030 (USD Million)
- 7.8.2. Saudi Arabia
- 7.8.2.1. Key Country Dynamics
- 7.8.2.2. Regulatory Framework/ Reimbursement Structure
- 7.8.2.3. Competitive Scenario
- 7.8.2.4. South Arabia Market Estimates and Forecasts 2018 to 2030 (USD Million)
- 7.8.3. UAE
- 7.8.3.1. Key Country Dynamics
- 7.8.3.2. Regulatory Framework/ Reimbursement Structure
- 7.8.3.3. Competitive Scenario
- 7.8.3.4. UAE Market Estimates and Forecasts 2018 to 2030 (USD Million)
- 7.8.4. Kuwait
- 7.8.4.1. Key Country Dynamics
- 7.8.4.2. Regulatory Framework/ Reimbursement Structure
- 7.8.4.3. Competitive Scenario
- 7.8.4.4. Kuwait Market Estimates and Forecasts 2018 to 2030 (USD Million)
- 7.8.1. South Africa
Chapter 8. Competitive Landscape
- 8.1. Recent Developments & Impact Analysis, By Key Market Participants
- 8.2. Company/Competition Categorization
- 8.3. Vendor Landscape
- 8.3.1. Key Company Heat Map Analysis, 2024
- 8.4. Company Profiles
- 8.4.1. Argon Medica Devices, Inc.
- 8.4.1.1. Company Overview
- 8.4.1.2. Financial Performance
- 8.4.1.3. Product Benchmarking
- 8.4.1.4. Strategic Initiatives
- 8.4.2. Cordis
- 8.4.2.1. Company Overview
- 8.4.2.2. Financial Performance
- 8.4.2.3. Product Benchmarking
- 8.4.2.4. Strategic Initiatives
- 8.4.3. Mermaid Medical
- 8.4.3.1. Company Overview
- 8.4.3.2. Financial Performance
- 8.4.3.3. Product Benchmarking
- 8.4.3.4. Strategic Initiatives
- 8.4.4. Terumo Corporation
- 8.4.4.1. Company Overview
- 8.4.4.2. Financial Performance
- 8.4.4.3. Product Benchmarking
- 8.4.4.4. Strategic Initiatives
- 8.4.5. Scholten Surgical Instruments, Inc.
- 8.4.5.1. Company Overview
- 8.4.5.2. Financial Performance
- 8.4.5.3. Product Benchmarking
- 8.4.5.4. Strategic Initiatives
- 8.4.6. Changzhou Lookmed Medical Instrument Co., Ltd.
- 8.4.6.1. Company Overview
- 8.4.6.2. Financial Performance
- 8.4.6.3. Product Benchmarking
- 8.4.6.4. Strategic Initiatives
- 8.4.7. Fehling Instruments
- 8.4.7.1. Company Overview
- 8.4.7.2. Financial Performance
- 8.4.7.3. Product Benchmarking
- 8.4.7.4. Strategic Initiatives
- 8.4.1. Argon Medica Devices, Inc.
