|
|
市場調査レポート
商品コード
1728026
ビューティーテックの世界市場:市場規模・シェア・動向分析 (技術別・製品カテゴリー別・エンドユーザー別・地域別)、セグメント別予測 (2025年~2030年)Beauty Tech Market Size, Share & Trends Analysis Report By Technology (Artificial Intelligence (AI), Augmented Reality (AR)), By Product Category (Skincare Devices, Cosmetics), By End User, By Region, And Segment Forecasts, 2025 - 2030 |
||||||

|
|||||||
カスタマイズ可能
|
|||||||

| ビューティーテックの世界市場:市場規模・シェア・動向分析 (技術別・製品カテゴリー別・エンドユーザー別・地域別)、セグメント別予測 (2025年~2030年) |
|
出版日: 2025年04月08日
発行: Grand View Research
ページ情報: 英文 120 Pages
納期: 2~10営業日
|

全表示
- 概要
- 図表
- 目次
ビューティーテック市場規模と動向:
世界のビューティーテックの市場規模は2024年に661億7,000万米ドルと推定され、2025年から2030年にかけてCAGR 17.9%で成長すると予測されています。
ビューティーテック産業の成長は、技術の進歩、消費者の嗜好の変化、個別化されたビューティーソリューションに対する需要の高まりによってもたらされます。美容ブランドがAI、AR、IoTを自社の製品に統合するにつれて、市場は急速に進化し、ユーザー体験の向上と革新的な製品開発を提供しています。
市場成長を促進するもう1つの主要因は、スマート美容機器の台頭です。IoT対応のスキンケアやヘアケアツールは、リアルタイムのトラッキングやパーソナライズされた推奨を提供します。スマート洗顔器、家庭用LEDセラピーマスク、コネクテッドヘアドライヤーなどのデバイスは、スキンケアのルーチンを最適化するためにAIを統合しています。Foreo、Dyson、NuFaceなどのブランドは、ユーザーの肌の状態をモニターし、それに応じて治療を調整するスマートガジェットを発表し、インテリジェントな美容ソリューションの新時代を創造しています。
持続可能性とクリーンビューティーを重視する傾向が強まっていることも、ビューティーテック業界の大きな促進要因となっています。消費者は倫理的・環境的な懸念に対する意識を高めており、美容ブランドがテクノロジー主導の持続可能な実践を採用するよう後押ししています。AIを活用した成分分析により、より安全な処方が可能になり、スマートな詰め替え用パッケージは廃棄物を最小限に抑えます。企業はまた、倫理的な調達を確認するためにブロックチェーンとデジタル透明性ツールを使用しており、クリーンな美容ブランドに対する消費者の信頼をさらに高めています。
eコマースとDX (デジタルトランスフォーメーション) の急成長は、ビューティーテックの採用を加速させています。AIを活用したバーチャル診断、チャットボット、レコメンデーションエンジンは、顧客に高度にカスタマイズされた製品提案を提供します。美容ブランドは、ビッグデータと機械学習を活用してオンライン・ショッピング体験を強化し、転換率と顧客維持率を向上させています。デジタル・ビューティー・プラットフォームはソーシャル・コマースにも進出しており、そこではインフルエンサーやAIが生成したコンテンツがエンゲージメントや購買を促進しています。
美容におけるバイオテクノロジーの統合は、より効果的でカスタマイズされたスキンケアソリューションの開発を可能にしています。AIを活用した遺伝子データの分析、マイクロバイオーム調査、バイオミメティック成分により、ブランドは個々のニーズに合わせたスキンケア製品を開発できるようになっています。企業は現在、バイオテクノロジーを活用して、実験室で栽培された成分、無農薬の代替品、強化されたアンチエイジング処方を開発し、高性能スキンケアの需要を促進しています。
目次
第1章 分析方法・範囲
第2章 エグゼクティブサマリー
第3章 ビューティーテック市場:変動要因・傾向・範囲
- 市場概要/連関の見通し
- 業界バリューチェーン分析
- 市場力学
- 市場促進要因の分析
- 市場抑制要因の分析
- 業界の機会
- ビューティーテック市場:分析ツール
- ポーターのファイブフォース分析
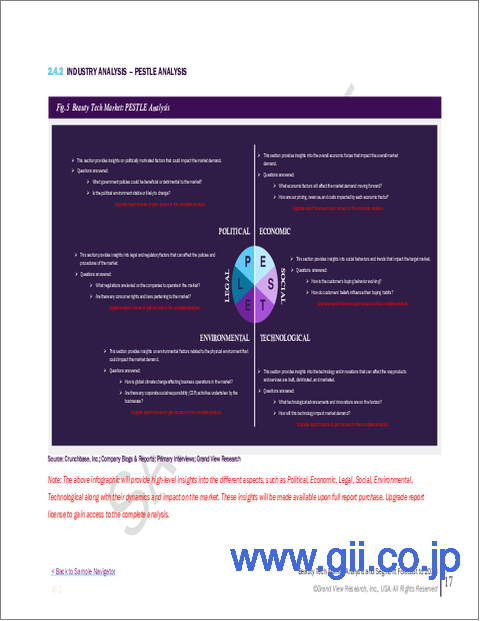
- PESTEL分析
第4章 ビューティーテック市場:技術別の推定・動向分析
- セグメントダッシュボード
- ビューティーテック:動向分析、技術別(2024年・2030年)
- 人工知能(AI)
- 拡張現実(AR)
- ウェアラブルテクノロジー
- その他
第5章 ビューティーテック市場:製品カテゴリー別の推定・動向分析
- セグメントダッシュボード
- ビューティーテック:動向分析、製品カテゴリー別(2024年・2030年)
- スキンケア機器
- ニキビ治療機器
- クレンジング
- 若返り
- アンチエイジングデバイス
- その他
- ヘアケア機器
- 髪の成長
- 脱毛
- スマートヘアドライヤー
- LEDヘア治療デバイス
- 化粧品
- スマートメイクツール
- バーチャルメイクアップ体験
- その他
- その他
第6章 ビューティーテック市場:エンドユーザー別の推定・動向分析
- セグメントダッシュボード
- ビューティーテック:動向分析、エンドユーザー別(2024年・2030年)
- 個人消費者
- 美容院・スパ
- 小売店
第7章 ビューティーテック市場:地域別の推定・動向分析
- ビューティーテックの市場シェア:地域別(2024年・2030年)
- 北米
- 技術別(2018~2030年)
- 製品カテゴリー別(2018~2030年)
- エンドユーザー別(2018~2030年)
- 米国
- カナダ
- メキシコ
- 欧州
- 技術別(2018~2030年)
- 製品カテゴリー別(2018~2030年)
- エンドユーザー別(2018~2030年)
- フランス
- アジア太平洋
- 技術別(2018~2030年)
- 製品カテゴリー別(2018~2030年)
- エンドユーザー別(2018~2030年)
- 中国
- インド
- 日本
- オーストラリア
- 韓国
- ラテンアメリカ
- 技術別(2018~2030年)
- 製品カテゴリー別(2018~2030年)
- エンドユーザー別(2018~2030年)
- ブラジル
- 中東・アフリカ
- 技術別(2018~2030年)
- 製品カテゴリー別(2018~2030年)
- エンドユーザー別(2018~2030年)
- サウジアラビア
- アラブ首長国連邦
- 南アフリカ
第8章 競合情勢
- 最近の動向と影響分析:主要市場参入企業別
- 企業分類
- 企業の市場シェア分析
- 企業ヒートマップ分析
- 戦略マッピング
- 拡大
- 企業合併・買収 (M&A)
- パートナーシップ・コラボレーション
- 新製品の発売
- 研究開発
- 企業プロファイル
- Amorepacific Corporation
- Avon Products, Inc.
- Dyson
- Johnson &Johnson
- Kao Corporation
- L'Oreal SA
- Mary Kay Inc.
- Oriflame Holding AG
- Panasonic
- Procter &Gamble Co.
- Revlon, Inc.
- Sephora(LVMH subsidiary)
- The Estee Lauder Companies Inc.
- Shiseido
- Unilever PLC
List of Tables
- Table 1 List of Abbreviation
- Table 2 Global beauty tech market, 2018 - 2030 (USD Billion)
- Table 3 Global beauty tech market, by region, 2018 - 2030 (USD Billion)
- Table 4 Global beauty tech market, by technology, 2018 - 2030 (USD Billion)
- Table 5 Global beauty tech market, by product category, 2018 - 2030 (USD Billion)
- Table 6 Global beauty tech market, by end user, 2018 - 2030 (USD Billion)
- Table 7 Global artificial intelligence (AI) market by region, 2018 - 2030 (USD Billion)
- Table 8 Global augmented reality (AR) market by region, 2018 - 2030 (USD Billion)
- Table 9 Global wearable technology market by region, 2018 - 2030 (USD Billion)
- Table 10 Global others market by region, 2018 - 2030 (USD Billion)
- Table 11 Global skincare devices market by region, 2018 - 2030 (USD Billion)
- Table 12 Global hair care devices market by region, 2018 - 2030 (USD Billion)
- Table 13 Global cosmetics market by region, 2018 - 2030 (USD Billion)
- Table 14 Global others market by region, 2018 - 2030 (USD Billion)
- Table 15 Global individual consumers market by region, 2018 - 2030 (USD Billion)
- Table 16 Global beauty salons and spas market by region, 2018 - 2030 (USD Billion)
- Table 17 Global retail stores market by region, 2018 - 2030 (USD Billion)
- Table 18 North America beauty tech market, by technology 2018 - 2030 (USD Billion)
- Table 19 North America beauty tech market, by product category 2018 - 2030 (USD Billion)
- Table 20 North America beauty tech market, by end user 2018 - 2030 (USD Billion)
- Table 21 U.S. beauty tech market, by technology 2018 - 2030 (USD Billion)
- Table 22 U.S. beauty tech market, by product category 2018 - 2030 (USD Billion)
- Table 23 U.S. beauty tech market, by end user 2018 - 2030 (USD Billion)
- Table 24 Canada beauty tech market, by technology 2018 - 2030 (USD Billion)
- Table 25 Canada beauty tech market, by product category 2018 - 2030 (USD Billion)
- Table 26 Canada beauty tech market, by end user 2018 - 2030 (USD Billion)
- Table 27 Mexico beauty tech market, by technology 2018 - 2030 (USD Billion)
- Table 28 Mexico beauty tech market, by product category 2018 - 2030 (USD Billion)
- Table 29 Mexico beauty tech market, by end user 2018 - 2030 (USD Billion)
- Table 30 Europe beauty tech market, by technology 2018 - 2030 (USD Billion)
- Table 31 Europe beauty tech market, by product category 2018 - 2030 (USD Billion)
- Table 32 Europe beauty tech market, by end user 2018 - 2030 (USD Billion)
- Table 33 UK beauty tech market, by technology 2018 - 2030 (USD Billion)
- Table 34 UK beauty tech market, by product category 2018 - 2030 (USD Billion)
- Table 35 UK beauty tech market, by end user 2018 - 2030 (USD Billion)
- Table 36 Germany beauty tech market, by technology 2018 - 2030 (USD Billion)
- Table 37 Germany beauty tech market, by product category 2018 - 2030 (USD Billion)
- Table 38 Germany beauty tech market, by end user 2018 - 2030 (USD Billion)
- Table 39 France beauty tech market, by technology 2018 - 2030 (USD Billion)
- Table 40 France beauty tech market, by product category 2018 - 2030 (USD Billion)
- Table 41 France beauty tech market, by end user 2018 - 2030 (USD Billion)
- Table 42 Asia Pacific beauty tech market, by technology 2018 - 2030 (USD Billion)
- Table 43 Asia Pacific beauty tech market, by product category 2018 - 2030 (USD Billion)
- Table 44 Asia Pacific beauty tech market, by end user 2018 - 2030 (USD Billion)
- Table 45 China beauty tech market, by technology 2018 - 2030 (USD Billion)
- Table 46 China beauty tech market, by product category 2018 - 2030 (USD Billion)
- Table 47 China beauty tech market, by end user 2018 - 2030 (USD Billion)
- Table 48 India beauty tech market, by technology 2018 - 2030 (USD Billion)
- Table 49 India beauty tech market, by product category 2018 - 2030 (USD Billion)
- Table 50 India beauty tech market, by end user 2018 - 2030 (USD Billion)
- Table 51 Japan beauty tech market, by technology 2018 - 2030 (USD Billion)
- Table 52 Japan beauty tech market, by product category 2018 - 2030 (USD Billion)
- Table 53 Japan beauty tech market, by end user 2018 - 2030 (USD Billion)
- Table 54 Australia beauty tech market, by technology 2018 - 2030 (USD Billion)
- Table 55 Australia beauty tech market, by product category 2018 - 2030 (USD Billion)
- Table 56 Australia beauty tech market, by end user 2018 - 2030 (USD Billion)
- Table 57 South Korea beauty tech market, by technology 2018 - 2030 (USD Billion)
- Table 58 South Korea beauty tech market, by product category 2018 - 2030 (USD Billion)
- Table 59 South Korea beauty tech market, by end user 2018 - 2030 (USD Billion)
- Table 60 Latin America beauty tech market, by technology 2018 - 2030 (USD Billion)
- Table 61 Latin America beauty tech market, by product category 2018 - 2030 (USD Billion)
- Table 62 Latin America beauty tech market, by end user 2018 - 2030 (USD Billion)
- Table 63 Brazil beauty tech market, by technology 2018 - 2030 (USD Billion)
- Table 64 Brazil beauty tech market, by product category 2018 - 2030 (USD Billion)
- Table 65 Brazil beauty tech market, by end user 2018 - 2030 (USD Billion)
- Table 66 Middle East & Africa beauty tech market, by technology 2018 - 2030 (USD Billion)
- Table 67 Middle East & Africa beauty tech market, by product category 2018 - 2030 (USD Billion)
- Table 68 Middle East & Africa beauty tech market, by end user 2018 - 2030 (USD Billion)
- Table 69 UAE beauty tech market, by technology 2018 - 2030 (USD Billion)
- Table 70 UAE beauty tech market, by product category 2018 - 2030 (USD Billion)
- Table 71 UAE beauty tech market, by end user 2018 - 2030 (USD Billion)
- Table 72 Saudi Arabia beauty tech market, by technology 2018 - 2030 (USD Billion)
- Table 73 Saudi Arabia beauty tech market, by product category 2018 - 2030 (USD Billion)
- Table 74 Saudi Arabia beauty tech market, by end user 2018 - 2030 (USD Billion)
- Table 75 South Africa beauty tech market, by technology 2018 - 2030 (USD Billion)
- Table 76 South Africa beauty tech market, by product category 2018 - 2030 (USD Billion)
- Table 77 South Africa beauty tech market, by end user 2018 - 2030 (USD Billion)
List of Figures
- Fig. 1 Beauty Tech Market Segmentation
- Fig. 2 Market landscape
- Fig. 3 Information Procurement
- Fig. 4 Data Analysis Models
- Fig. 5 Market Formulation and Validation
- Fig. 6 Data Validating & Publishing
- Fig. 7 Market Snapshot
- Fig. 8 Segment Snapshot
- Fig. 9 Competitive Landscape Snapshot
- Fig. 10 Beauty Tech: Industry Value Chain Analysis
- Fig. 11 Beauty Tech: Market Dynamics
- Fig. 12 Beauty Tech: PORTER's Analysis
- Fig. 13 Beauty Tech: PESTEL Analysis
- Fig. 14 Beauty Tech Share by Technology, 2024 & 2030 (USD Billion)
- Fig. 15 Beauty Tech, by Technology: Market Share, 2024 & 2030
- Fig. 16 Artificial Intelligence (AI) Market Estimates and Forecasts, 2018 - 2030 (Revenue, USD Billion)
- Fig. 17 Augmented Reality (AR) Market Estimates and Forecasts, 2018 - 2030 (Revenue, USD Billion)
- Fig. 18 Wearable Technology Market Estimates and Forecasts, 2018 - 2030 (Revenue, USD Billion)
- Fig. 19 Others Market Estimates and Forecasts, 2018 - 2030 (Revenue, USD Billion)
- Fig. 20 Beauty Tech Share by Product Category, 2024 & 2030 (USD Billion)
- Fig. 21 Beauty Tech, by Product Category: Market Share, 2024 & 2030
- Fig. 22 Skincare Devices Market Estimates and Forecasts, 2018 - 2030 (Revenue, USD Billion)
- Fig. 23 Acne Devices Market Estimates and Forecasts, 2018 - 2030 (Revenue, USD Billion)
- Fig. 24 Cleansing Market Estimates and Forecasts, 2018 - 2030 (Revenue, USD Billion)
- Fig. 25 Rejuvenation Market Estimates and Forecasts, 2018 - 2030 (Revenue, USD Billion)
- Fig. 26 Anti-Aging Devices Market Estimates and Forecasts, 2018 - 2030 (Revenue, USD Billion)
- Fig. 27 Others Market Estimates and Forecasts, 2018 - 2030 (Revenue, USD Billion)
- Fig. 28 Hair Care Devices Market Estimates and Forecasts, 2018 - 2030 (Revenue, USD Billion)
- Fig. 29 Hair growth Market Estimates and Forecasts, 2018 - 2030 (Revenue, USD Billion)
- Fig. 30 Hair removal Market Estimates and Forecasts, 2018 - 2030 (Revenue, USD Billion)
- Fig. 31 Smart Hair Dryers Market Estimates and Forecasts, 2018 - 2030 (Revenue, USD Billion)
- Fig. 32 LED Hair Treatment Devices Market Estimates and Forecasts, 2018 - 2030 (Revenue, USD Billion)
- Fig. 33 Cosmetics Market Estimates and Forecasts, 2018 - 2030 (Revenue, USD Billion)
- Fig. 34 Smart Makeup Tools Market Estimates and Forecasts, 2018 - 2030 (Revenue, USD Billion)
- Fig. 35 Virtual Makeup Try-On Market Estimates and Forecasts, 2018 - 2030 (Revenue, USD Billion)
- Fig. 36 Others Market Estimates and Forecasts, 2018 - 2030 (Revenue, USD Billion)
- Fig. 37 Others Market Estimates and Forecasts, 2018 - 2030 (Revenue, USD Billion)
- Fig. 38 Beauty Tech Share by End user, 2024 & 2030 (USD Billion)
- Fig. 39 Beauty Tech, by End user: Market Share, 2024 & 2030 Market Estimates and Forecasts, 2018 - 2030 (Revenue, USD Billion)
- Fig. 40 Individual Consumers Market Estimates and Forecasts, 2018 - 2030 (Revenue, USD Billion)
- Fig. 41 Beauty Salons and Spas Market Estimates and Forecasts, 2018 - 2030 (Revenue, USD Billion)
- Fig. 42 Retail Stores Market Estimates and Forecasts, 2018 - 2030 (Revenue, USD Billion)
- Fig. 43 Retail & E-commerce Market Estimates and Forecasts, 2018 - 2030 (Revenue, USD Billion)
- Fig. 44 Regional Marketplace: Key Takeaways
- Fig. 45 North America Beauty Tech Market Estimates and Forecasts, 2030 (Revenue, USD Billion)
- Fig. 46 U.S. Beauty Tech Market Estimates and Forecasts, 2030 (Revenue, USD Billion)
- Fig. 47 Canada Beauty Tech Market Estimates and Forecasts, 2030 (Revenue, USD Billion)
- Fig. 48 Mexico Beauty Tech Market Estimates and Forecasts, 2030 (Revenue, USD Billion)
- Fig. 49 Europe Beauty Tech Market Estimates and Forecasts, 2030 (Revenue, USD Billion)
- Fig. 50 UK Beauty Tech Market Estimates and Forecasts, 2018 - 2030 (USD Billion)
- Fig. 51 Germany Beauty Tech Market Estimates and Forecasts, 2018 - 2030 (USD Billion)
- Fig. 52 France Beauty Tech Market Estimates and Forecasts, 2018 - 2030 (USD Billion)
- Fig. 53 Asia Pacific Beauty Tech Market Estimates and Forecast, 2018 - 2030 (USD Billion)
- Fig. 54 China Beauty Tech Market Estimates and Forecasts, 2030 (Revenue, USD Billion)
- Fig. 55 India Beauty Tech Market Estimates and Forecasts, 2030 (Revenue, USD Billion)
- Fig. 56 Japan Beauty Tech Market Estimates and Forecasts, 2030 (Revenue, USD Billion)
- Fig. 57 Australia Beauty Tech Market Estimates and Forecasts, 2030 (Revenue, USD Billion)
- Fig. 58 South Korea Beauty Tech Market Estimates and Forecasts, 2030 (Revenue, USD Billion)
- Fig. 59 Latin America Beauty Tech Market Estimates and Forecasts, 2030 (Revenue, USD Billion)
- Fig. 60 Brazil Beauty Tech Market Estimates and Forecasts, 2030 (Revenue, USD Billion)
- Fig. 61 MEA Beauty Tech Market Estimates and Forecasts, 2018 - 2030 (USD Billion)
- Fig. 62 Saudi Arabia Beauty Tech Market Estimates and Forecasts, 2018 - 2030 (USD Billion)
- Fig. 63 UAE Beauty Tech Market Estimates and Forecasts, 2018 - 2030 (USD Billion)
- Fig. 64 South Africa Beauty Tech Market Estimates and Forecasts, 2018 - 2030 (USD Billion)
- Fig. 65 Key Company Categorization
- Fig. 66 Company Market Positioning
- Fig. 67 Key Company Market Share Analysis, 2024
- Fig. 68 Strategic Framework
Beauty Tech Market Size & Trends:
The global beauty tech market size was estimated at USD 66.17 billion in 2024 and is anticipated to grow at a CAGR of 17.9% from 2025 to 2030. Growth of the beauty tech industry is driven by technological advancements, shifting consumer preferences, and the increasing demand for personalized beauty solutions. As beauty brands integrate AI, AR, and IoT into their offerings, the market is evolving rapidly, providing enhanced user experiences and innovative product developments.
Another major factor propelling market growth is the rise of smart beauty devices. IoT-enabled skincare and haircare tools provide real-time tracking and personalized recommendations. Devices such as smart facial cleansers, at-home LED therapy masks, and connected hair dryers are integrating AI to optimize skincare routines. Brands like Foreo, Dyson, and NuFace have introduced smart gadgets that monitor users' skin conditions and adjust treatments accordingly, creating a new era of intelligent beauty solutions.
The growing emphasis on sustainability and clean beauty is also a significant growth driver of the beauty tech industry. Consumers are becoming increasingly aware of ethical and environmental concerns, pushing beauty brands to adopt technology-driven sustainable practices. AI-based ingredient analysis ensures safer formulations, while smart refillable packaging minimizes waste. Companies are also using blockchain and digital transparency tools to verify ethical sourcing, further boosting consumer trust in clean beauty brands.
The rapid growth of e-commerce and digital transformation is accelerating beauty tech adoption. AI-powered virtual consultations, chatbots, and recommendation engines provide customers with highly tailored product suggestions. Beauty brands are leveraging big data and machine learning to enhance online shopping experiences, improving conversion rates and customer retention. Digital beauty platforms are also expanding into social commerce, where influencers and AI-generated content drive engagement and purchases.
The integration of biotechnology in beauty is enabling the development of more effective and customized skincare solutions. AI-powered analysis of genetic data, microbiome research, and biomimetic ingredients are allowing brands to create skincare products tailored to individual needs. Companies are now leveraging biotech to develop lab-grown ingredients, cruelty-free alternatives, and enhanced anti-aging formulations, driving demand for high-performance skincare.
Global Beauty Tech Market Report Segmentation
This report forecasts revenue growth at global, regional, and country levels and provides an analysis of the latest industry trends in each of the sub-segments from 2018 to 2030. For this study, Grand View Research has segmented the beauty tech market report based on technology, product category, end user, and region:
- Technology Outlook (Revenue, USD Billion, 2018 - 2030)
- Artificial Intelligence (AI)
- Augmented Reality (AR)
- Wearable Technology
- Others
- Product Category Outlook (Revenue, USD Billion, 2018 - 2030)
- Skincare Devices
- Acne Devices
- Cleansing
- Rejuvenation
- Anti-Aging Devices
- Others
- Hair Care Devices
- Hair growth
- Hair removal
- Smart Hair Dryers
- LED Hair Treatment Devices
- Cosmetics
- Smart Makeup Tools
- Virtual Makeup Try-On
- Others
- Others
- End User Outlook (Revenue, USD Billion, 2018 - 2030)
- Individual Consumers
- Beauty Salons and Spas
- Retail Stores
- Regional Outlook (Revenue, USD Billion, 2018 - 2030)
- North America
- U.S.
- Canada
- Mexico
- Europe
- UK
- Germany
- France
- Asia Pacific
- China
- India
- Japan
- South Korea
- Australia
- Latin America
- Brazil
- Middle East & Africa
- UAE
- Saudi Arabia
- South Africa
Table of Contents
Chapter 1. Methodology and Scope
- 1.1. Methodology segmentation & scope
- 1.2. Market Definitions
- 1.3. Research Methodology
- 1.3.1. Information Procurement
- 1.3.2. Information or Data Analysis
- 1.3.3. Market Formulation & Data Visualization
- 1.3.4. Data Validation & Publishing
- 1.4. Research Scope and Assumptions
- 1.4.1. List of Data Sources
Chapter 2. Executive Summary
- 2.1. Market Outlook
- 2.2. Segment Outlook
- 2.3. Competitive Insights
Chapter 3. Beauty Tech Variables, Trends & Scope
- 3.1. Market Introduction/Lineage Outlook
- 3.2. Industry Value Chain Analysis
- 3.3. Market Dynamics
- 3.3.1. Market Drivers Analysis
- 3.3.2. Market Restraints Analysis
- 3.3.3. Industry Opportunities
- 3.4. Beauty Tech Analysis Tools
- 3.4.1. Porter's Analysis
- 3.4.1.1. Bargaining power of the suppliers
- 3.4.1.2. Bargaining power of the buyers
- 3.4.1.3. Threats of substitution
- 3.4.1.4. Threats from new entrants
- 3.4.2. PESTEL Analysis
- 3.4.2.1. Political landscape
- 3.4.2.2. Economic and Social landscape
- 3.4.2.3. Technological landscape
- 3.4.2.4. Environmental landscape
- 3.4.2.5. Legal landscape
- 3.4.1. Porter's Analysis
Chapter 4. Beauty Tech Market: Technology Estimates & Trend Analysis
- 4.1. Segment Dashboard
- 4.2. Beauty Tech: Technology Movement Analysis, 2024 & 2030 (USD Billion)
- 4.2.1. Market Size Estimates and Forecasts, 2018 - 2030 (USD Billion)
- 4.3. Artificial Intelligence (AI)
- 4.3.1. Market Size Estimates and Forecasts, 2018 - 2030 (USD Billion)
- 4.4. Augmented Reality (AR)
- 4.4.1. Market Size Estimates and Forecasts, 2018 - 2030 (USD Billion)
- 4.5. Wearable Technology
- 4.5.1. Market Size Estimates and Forecasts, 2018 - 2030 (USD Billion)
- 4.6. Others
- 4.6.1. Market Size Estimates and Forecasts, 2018 - 2030 (USD Billion)
Chapter 5. Beauty Tech Market: Product Category Estimates & Trend Analysis
- 5.1. Segment Dashboard
- 5.2. Beauty Tech: Product category Movement Analysis, 2024 & 2030 (USD Billion)
- 5.3. Skincare Devices
- 5.3.1. Market Size Estimates and Forecasts, 2018 - 2030 (USD Billion)
- 5.3.2. Acne Devices
- 5.3.2.1. Market Size Estimates and Forecasts, 2018 - 2030 (USD Billion)
- 5.3.3. Cleansing
- 5.3.3.1. Market Size Estimates and Forecasts, 2018 - 2030 (USD Billion)
- 5.3.4. Rejuvenation
- 5.3.4.1. Market Size Estimates and Forecasts, 2018 - 2030 (USD Billion)
- 5.3.5. Anti-Aging Devices
- 5.3.5.1. Market Size Estimates and Forecasts, 2018 - 2030 (USD Billion)
- 5.3.6. Others
- 5.3.6.1. Market Size Estimates and Forecasts, 2018 - 2030 (USD Billion)
- 5.4. Hair Care Devices
- 5.4.1. Market Size Estimates and Forecasts, 2018 - 2030 (USD Billion)
- 5.4.2. Hair growth
- 5.4.2.1. Market Size Estimates and Forecasts, 2018 - 2030 (USD Billion)
- 5.4.3. Hair removal
- 5.4.3.1. Market Size Estimates and Forecasts, 2018 - 2030 (USD Billion)
- 5.4.4. Smart Hair Dryers
- 5.4.4.1. Market Size Estimates and Forecasts, 2018 - 2030 (USD Billion)
- 5.4.5. LED Hair Treatment Devices
- 5.4.5.1. Market Size Estimates and Forecasts, 2018 - 2030 (USD Billion)
- 5.5. Cosmetics
- 5.5.1. Market Size Estimates and Forecasts, 2018 - 2030 (USD Billion)
- 5.5.2. Smart Makeup Tools
- 5.5.2.1. Market Size Estimates and Forecasts, 2018 - 2030 (USD Billion)
- 5.5.3. Virtual Makeup Try-On
- 5.5.3.1. Market Size Estimates and Forecasts, 2018 - 2030 (USD Billion)
- 5.5.4. Others
- 5.5.4.1. Market Size Estimates and Forecasts, 2018 - 2030 (USD Billion)
- 5.6. Others
- 5.6.1. Market Size Estimates and Forecasts, 2018 - 2030 (USD Billion)
Chapter 6. Beauty Tech Market: End User Estimates & Trend Analysis
- 6.1. Segment Dashboard
- 6.2. Beauty Tech: End User Movement Analysis, 2024 & 2030 (USD Billion)
- 6.3. Individual Consumers
- 6.3.1. Market Size Estimates and Forecasts, 2018 - 2030 (USD Billion)
- 6.4. Beauty Salons and Spas
- 6.4.1. Market Size Estimates and Forecasts, 2018 - 2030 (USD Billion)
- 6.5. Retail Stores
- 6.5.1. Market Size Estimates and Forecasts, 2018 - 2030 (USD Billion)
Chapter 7. Beauty Tech Market: Regional Estimates & Trend Analysis
- 7.1. Beauty Tech Share, By Region, 2024 & 2030 (USD Billion)
- 7.2. North America
- 7.2.1. Market Estimates and Forecasts, 2018 - 2030 (USD Billion)
- 7.2.2. Market estimates and forecast by technology, 2018 - 2030 (Revenue, USD Billion)
- 7.2.3. Market estimates and forecast by product category, 2018 - 2030 (Revenue, USD Billion)
- 7.2.4. Market estimates and forecast by end user, 2018 - 2030 (Revenue, USD Billion)
- 7.2.5. U.S.
- 7.2.5.1. Market Estimates and Forecasts, 2018 - 2030 (USD Billion)
- 7.2.5.2. Market estimates and forecast by technology, 2018 - 2030 (Revenue, USD Billion)
- 7.2.5.3. Market estimates and forecast by product category, 2018 - 2030 (Revenue, USD Billion)
- 7.2.5.4. Market estimates and forecast by end user, 2018 - 2030 (Revenue, USD Billion)
- 7.2.6. Canada
- 7.2.6.1. Market Estimates and Forecasts, 2018 - 2030 (USD Billion)
- 7.2.6.2. Market estimates and forecast by technology, 2018 - 2030 (Revenue, USD Billion)
- 7.2.6.3. Market estimates and forecast by product category, 2018 - 2030 (Revenue, USD Billion)
- 7.2.6.4. Market estimates and forecast by end user, 2018 - 2030 (Revenue, USD Billion)
- 7.2.7. Mexico
- 7.2.7.1. Market Estimates and Forecasts, 2018 - 2030 (USD Billion)
- 7.2.7.2. Market estimates and forecast by technology, 2018 - 2030 (Revenue, USD Billion)
- 7.2.7.3. Market estimates and forecast by product category, 2018 - 2030 (Revenue, USD Billion)
- 7.2.7.4. Market estimates and forecast by end user, 2018 - 2030 (Revenue, USD Billion)
- 7.3. Europe
- 7.3.1. Market Estimates and Forecasts, 2018 - 2030 (USD Billion)
- 7.3.2. Market estimates and forecast by technology, 2018 - 2030 (Revenue, USD Billion)
- 7.3.3. Market estimates and forecast by product category, 2018 - 2030 (Revenue, USD Billion)
- 7.3.4. Market estimates and forecast by end user, 2018 - 2030 (Revenue, USD Billion)
- 7.3.5. France
- 7.3.5.1. Market Estimates and Forecasts, 2018 - 2030 (USD Billion)
- 7.3.5.2. Market estimates and forecast by technology, 2018 - 2030 (Revenue, USD Billion)
- 7.3.5.3. Market estimates and forecast by product category, 2018 - 2030 (Revenue, USD Billion)
- 7.3.5.4. Market estimates and forecast by end user, 2018 - 2030 (Revenue, USD Billion)
- 7.4. Asia Pacific
- 7.4.1. Market Estimates and Forecasts, 2018 - 2030 (USD Billion)
- 7.4.2. Market estimates and forecast by technology, 2018 - 2030 (Revenue, USD Billion)
- 7.4.3. Market estimates and forecast by product category, 2018 - 2030 (Revenue, USD Billion)
- 7.4.4. Market estimates and forecast by end user, 2018 - 2030 (Revenue, USD Billion)
- 7.4.5. China
- 7.4.5.1. Market Estimates and Forecasts, 2018 - 2030 (USD Billion)
- 7.4.5.2. Market estimates and forecast by technology, 2018 - 2030 (Revenue, USD Billion)
- 7.4.5.3. Market estimates and forecast by product category, 2018 - 2030 (Revenue, USD Billion)
- 7.4.5.4. Market estimates and forecast by end user, 2018 - 2030 (Revenue, USD Billion)
- 7.4.6. India
- 7.4.6.1. Market Estimates and Forecasts, 2018 - 2030 (USD Billion)
- 7.4.6.2. Market estimates and forecast by technology, 2018 - 2030 (Revenue, USD Billion)
- 7.4.6.3. Market estimates and forecast by product category, 2018 - 2030 (Revenue, USD Billion)
- 7.4.6.4. Market estimates and forecast by end user, 2018 - 2030 (Revenue, USD Billion)
- 7.4.7. Japan
- 7.4.7.1. Market Estimates and Forecasts, 2018 - 2030 (USD Billion)
- 7.4.7.2. Market estimates and forecast by technology, 2018 - 2030 (Revenue, USD Billion)
- 7.4.7.3. Market estimates and forecast by product category, 2018 - 2030 (Revenue, USD Billion)
- 7.4.7.4. Market estimates and forecast by end user, 2018 - 2030 (Revenue, USD Billion)
- 7.4.8. Australia
- 7.4.8.1. Market Estimates and Forecasts, 2018 - 2030 (USD Billion)
- 7.4.8.2. Market estimates and forecast by technology, 2018 - 2030 (Revenue, USD Billion)
- 7.4.8.3. Market estimates and forecast by product category, 2018 - 2030 (Revenue, USD Billion)
- 7.4.8.4. Market estimates and forecast by end user, 2018 - 2030 (Revenue, USD Billion)
- 7.4.9. South Korea
- 7.4.9.1. Market Estimates and Forecasts, 2018 - 2030 (USD Billion)
- 7.4.9.2. Market estimates and forecast by technology, 2018 - 2030 (Revenue, USD Billion)
- 7.4.9.3. Market estimates and forecast by product category, 2018 - 2030 (Revenue, USD Billion)
- 7.4.9.4. Market estimates and forecast by end user, 2018 - 2030 (Revenue, USD Billion)
- 7.5. Latin America
- 7.5.1. Market Estimates and Forecasts, 2018 - 2030 (USD Billion)
- 7.5.2. Market estimates and forecast by technology, 2018 - 2030 (Revenue, USD Billion)
- 7.5.3. Market estimates and forecast by product category, 2018 - 2030 (Revenue, USD Billion)
- 7.5.4. Market estimates and forecast by end user, 2018 - 2030 (Revenue, USD Billion)
- 7.5.5. Brazil
- 7.5.5.1. Market Estimates and Forecasts, 2018 - 2030 (USD Billion)
- 7.5.5.2. Market estimates and forecast by technology, 2018 - 2030 (Revenue, USD Billion)
- 7.5.5.3. Market estimates and forecast by product category, 2018 - 2030 (Revenue, USD Billion)
- 7.5.5.4. Market estimates and forecast by end user, 2018 - 2030 (Revenue, USD Billion)
- 7.6. Middle East & Africa
- 7.6.1. Market Estimates and Forecasts, 2018 - 2030 (USD Billion)
- 7.6.2. Market estimates and forecast by technology, 2018 - 2030 (Revenue, USD Billion)
- 7.6.3. Market estimates and forecast by product category, 2018 - 2030 (Revenue, USD Billion)
- 7.6.4. Market estimates and forecast by end user, 2018 - 2030 (Revenue, USD Billion)
- 7.6.5. Saudi Arabia
- 7.6.5.1. Market Estimates and Forecasts, 2018 - 2030 (USD Billion)
- 7.6.5.2. Market estimates and forecast by technology, 2018 - 2030 (Revenue, USD Billion)
- 7.6.5.3. Market estimates and forecast by product category, 2018 - 2030 (Revenue, USD Billion)
- 7.6.5.4. Market estimates and forecast by end user, 2018 - 2030 (Revenue, USD Billion)
- 7.6.6. UAE
- 7.6.6.1. Market Estimates and Forecasts, 2018 - 2030 (USD Billion)
- 7.6.6.2. Market estimates and forecast by technology, 2018 - 2030 (Revenue, USD Billion)
- 7.6.6.3. Market estimates and forecast by product category, 2018 - 2030 (Revenue, USD Billion)
- 7.6.6.4. Market estimates and forecast by end user, 2018 - 2030 (Revenue, USD Billion)
- 7.6.7. South Africa
- 7.6.7.1. Market Estimates and Forecasts, 2018 - 2030 (USD Billion)
- 7.6.7.2. Market estimates and forecast by technology, 2018 - 2030 (Revenue, USD Billion)
- 7.6.7.3. Market estimates and forecast by product category, 2018 - 2030 (Revenue, USD Billion)
- 7.6.7.4. Market estimates and forecast by end user, 2018 - 2030 (Revenue, USD Billion)
Chapter 8. Competitive Landscape
- 8.1. Recent Developments & Impact Analysis by Key Market Participants
- 8.2. Company Categorization
- 8.3. Company Market Share Analysis
- 8.4. Company Heat Map Analysis
- 8.5. Strategy Mapping
- 8.5.1. Expansion
- 8.5.2. Mergers & Acquisition
- 8.5.3. Partnerships & Collaborations
- 8.5.4. New Product Launches
- 8.5.5. Research And Development
- 8.6. Company Profiles
- 8.6.1. Amorepacific Corporation
- 8.6.1.1. Participant's Overview
- 8.6.1.2. Financial Performance
- 8.6.1.3. Product Benchmarking
- 8.6.1.4. Recent Developments
- 8.6.2. Avon Products, Inc.
- 8.6.2.1. Participant's Overview
- 8.6.2.2. Financial Performance
- 8.6.2.3. Product Benchmarking
- 8.6.2.4. Recent Developments
- 8.6.3. Dyson
- 8.6.3.1. Participant's Overview
- 8.6.3.2. Financial Performance
- 8.6.3.3. Product Benchmarking
- 8.6.3.4. Recent Developments
- 8.6.4. Johnson & Johnson
- 8.6.4.1. Participant's Overview
- 8.6.4.2. Financial Performance
- 8.6.4.3. Product Benchmarking
- 8.6.4.4. Recent Developments
- 8.6.5. Kao Corporation
- 8.6.5.1. Participant's Overview
- 8.6.5.2. Financial Performance
- 8.6.5.3. Product Benchmarking
- 8.6.5.4. Recent Developments
- 8.6.6. L'Oreal S.A.
- 8.6.6.1. Participant's Overview
- 8.6.6.2. Financial Performance
- 8.6.6.3. Product Benchmarking
- 8.6.6.4. Recent Developments
- 8.6.7. Mary Kay Inc.
- 8.6.7.1. Participant's Overview
- 8.6.7.2. Financial Performance
- 8.6.7.3. Product Benchmarking
- 8.6.7.4. Recent Developments
- 8.6.8. Oriflame Holding AG
- 8.6.8.1. Participant's Overview
- 8.6.8.2. Financial Performance
- 8.6.8.3. Product Benchmarking
- 8.6.8.4. Recent Developments
- 8.6.9. Panasonic
- 8.6.9.1. Participant's Overview
- 8.6.9.2. Financial Performance
- 8.6.9.3. Product Benchmarking
- 8.6.9.4. Recent Developments
- 8.6.10. Procter & Gamble Co.
- 8.6.10.1. Participant's Overview
- 8.6.10.2. Financial Performance
- 8.6.10.3. Product Benchmarking
- 8.6.10.4. Recent Developments
- 8.6.11. Revlon, Inc.
- 8.6.11.1. Participant's Overview
- 8.6.11.2. Financial Performance
- 8.6.11.3. Product Benchmarking
- 8.6.11.4. Recent Developments
- 8.6.12. Sephora (LVMH subsidiary)
- 8.6.12.1. Participant's Overview
- 8.6.12.2. Financial Performance
- 8.6.12.3. Product Benchmarking
- 8.6.12.4. Recent Developments
- 8.6.13. The Estee Lauder Companies Inc.
- 8.6.13.1. Participant's Overview
- 8.6.13.2. Financial Performance
- 8.6.13.3. Product Benchmarking
- 8.6.13.4. Recent Developments
- 8.6.14. Shiseido
- 8.6.14.1. Participant's Overview
- 8.6.14.2. Financial Performance
- 8.6.14.3. Product Benchmarking
- 8.6.14.4. Recent Developments
- 8.6.15. Unilever PLC
- 8.6.15.1. Participant's Overview
- 8.6.15.2. Financial Performance
- 8.6.15.3. Product Benchmarking
- 8.6.15.4. Recent Developments
- 8.6.1. Amorepacific Corporation
