|
|
市場調査レポート
商品コード
1726177
骨粗鬆症治療薬の市場規模、シェア、動向分析レポート:薬剤クラス別、タイプ別、流通チャネル別、地域別、セグメント別予測、2025年~2030年Osteoporosis Drugs Market Size, Share, & Trends Analysis Report By Drug Class (Branded, Generics), By Type (Bisphosphates, Parathyroid Hormone Therapy), By Distribution Channel, By Region, And Segment Forecasts, 2025 - 2030 |
||||||
|
|||||||
カスタマイズ可能
|
|||||||

| 骨粗鬆症治療薬の市場規模、シェア、動向分析レポート:薬剤クラス別、タイプ別、流通チャネル別、地域別、セグメント別予測、2025年~2030年 |
|
出版日: 2025年04月08日
発行: Grand View Research
ページ情報: 英文 100 Pages
納期: 2~10営業日
|

全表示
- 概要
- 図表
- 目次
骨粗鬆症治療市場の成長と動向
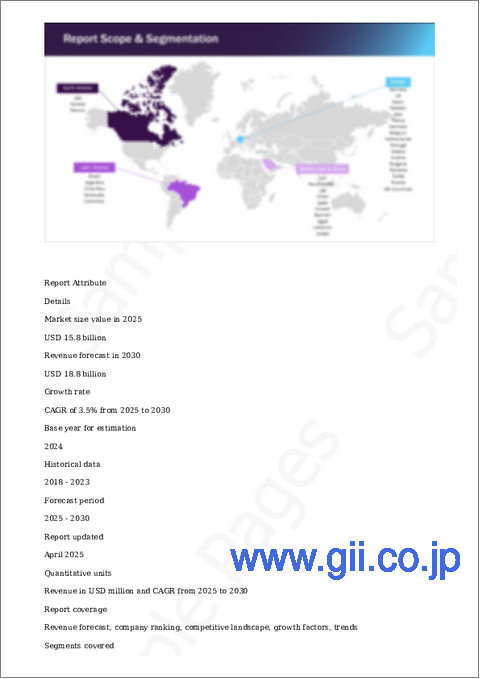
Grand View Research, Inc.の最新レポートによると、世界の骨粗鬆症治療市場規模は2030年までに188億米ドルに達すると予測され、2025~2030年のCAGRは3.5%で成長すると予測されています。
不健康なライフスタイルの急増は、骨粗鬆症の悪化と有病率の増加をもたらし、予測期間中に骨粗鬆症治療市場を促進すると推定されています。
加えて、特許切れの増加により、確立された薬剤のジェネリック医薬品を使用する臨床上の緊急性が高まっており、予測期間中のジェネリック骨粗鬆症治療市場を促進すると推測されます。前述の要因が重なり、今後数年間は高い潜在成長機会が見込まれます。
さらに、患者だけでなく医師の間で骨粗鬆症治療に関する意識レベルを高める取り組みが増加していることも、予測期間中に骨粗鬆症市場の成長可能性を広げると予想されます。例えば、National Osteoporosis Foundation(NOF)は、National Bone Health AllianceとFracture Liaison Service(FLS)のケア調整プログラムを担当する医療組織で、意識レベルの向上に焦点を当てるとともに、医療専門家にトレーニングを提供しています。
骨粗鬆症治療市場レポートハイライト
- 2024年、製品セグメントではブランド薬が圧倒的なシェアを占めます。この支配的なシェアは、骨粗鬆症治療に高い有効性を有するビスホスフェート、ランクリガンド阻害剤が広く利用されていることに起因しています。
- ジェネリック医薬品は、今後数年間で一貫して特許が失効すること、また新興国において安価な医薬品に対する臨床上の緊急性が高いことから、有利なCAGRで推移すると予想されます。
- 2024年には、北米が世界の骨粗鬆症治療市場で最大のシェアを占めたが、これはブランド治療の商業化に広く関与している既存企業の存在によるものです。
- アジア太平洋は、骨粗鬆症治療に関連する情報を促進する有利な政府のイニシアチブの結果として、飛躍的なCAGRで成長すると予測されています。
- 主要参入企業は、競争上の優位性を得るために、骨粗鬆症治療の採用を促進する持続可能性戦略を採用しています。例えば、Actavis Inc.は、製品ポートフォリオを拡大するためにWarner Chilcott PLCの買収を発表しました。
目次
第1章 調査手法と範囲
第2章 エグゼクティブサマリー
第3章 骨粗鬆症治療市場の変数、動向、範囲
- 市場系統の展望
- 市場力学
- 市場促進要因分析
- 市場抑制要因分析
- ビジネス環境分析
- 産業分析-ポーターのファイブフォース分析
- PESTLE分析
第4章 骨粗鬆症治療市場:薬剤クラスビジネス分析
- 薬剤クラス市場シェア、2024年と2030年
- 薬剤クラスセグメントダッシュボード
- 市場規模と予測と動向分析(薬剤クラス別、2018~2030年)
- ブランド
- ジェネリック医薬品
第5章 骨粗鬆症治療市場:タイプ別ビジネス分析
- タイプ市場シェア、2024年と2030年
- タイプセグメントダッシュボード
- 市場規模、予測、動向分析(タイプ別、2018~2030年)
- ビスホスホネート
- 副甲状腺ホルモン療法
- カルシトニン
- 選択的エストロゲン阻害剤モジュレーター(SERM)
- ランクリガンド阻害剤
- その他
第6章 骨粗鬆症治療市場:流通チャネル事業分析
- 流通チャネル市場シェア、2024年と2030年
- 流通チャネルセグメントダッシュボード
- 市場規模、予測、動向分析(流通チャネル別、2018~2030年)
- 病院薬局
- 小売薬局
- オンライン薬局
第7章 骨粗鬆症治療市場:地域別、推定・動向分析
- 地域別市場シェア分析、2024年と2030年
- 地域別市場ダッシュボード
- 市場規模と予測動向分析、2018~2030年
- 北米
- 国別、2018~2030年
- 米国
- カナダ
- メキシコ
- 欧州
- 国別、2018~2030年
- 英国
- ドイツ
- フランス
- イタリア
- スペイン
- ノルウェー
- デンマーク
- スウェーデン
- アジア太平洋
- 国別、2018~2030年
- 日本
- 中国
- インド
- 韓国
- オーストラリア
- タイ
- ラテンアメリカ
- 国別、2018~2030年
- ブラジル
- アルゼンチン
- 中東・アフリカ
- 国別、2018~2030年
- 南アフリカ
- サウジアラビア
- アラブ首長国連邦
- クウェート
第8章 競合情勢
- 参加者概要
- 企業の市況分析
- 企業分類
- 戦略マッピング
- 企業プロファイル/上場企業
- Amgen Inc.
- Eli Lilly and Company
- Merck & Co., Inc.
- Novartis AG
- Pfizer Inc.
- GSK plc
- Radius Health, Inc.
- UCB SA
- Teva Pharmaceutical Industries Ltd.
- F. Hoffmann-La Roche Ltd
List of Tables
- Table 1. List of Secondary Sources
- Table 2. List of Abbreviations
- Table 3. Global Osteoporosis Drugs Market, by Region, 2018 - 2030 (USD Million)
- Table 4. Global Osteoporosis Drugs Market, by Drug Class, 2018 - 2030 (USD Million)
- Table 5. Global Osteoporosis Drugs Market, by Type, 2018 - 2030 (USD Million)
- Table 6. Global Osteoporosis Drugs Market, by Distribution Channel, 2018 - 2030 (USD Million)
- Table 7. North America Osteoporosis Drugs Market, by Country, 2018 - 2030 (USD Million)
- Table 8. North America Osteoporosis Drugs Market, by Drug Class, 2018 - 2030 (USD Million)
- Table 9. North America Osteoporosis Drugs Market, by Type, 2018 - 2030 (USD Million)
- Table 10. North America Osteoporosis Drugs Market, by Distribution Channel, 2018 - 2030 (USD Million)
- Table 11. U.S. Osteoporosis Drugs Market, by Drug Class, 2018 - 2030 (USD Million)
- Table 12. U.S. Osteoporosis Drugs Market, by Type, 2018 - 2030 (USD Million)
- Table 13. U.S. Osteoporosis Drugs Market, by Distribution Channel, 2018 - 2030 (USD Million)
- Table 14. Canada Osteoporosis Drugs Market, by Drug Class, 2018 - 2030 (USD Million)
- Table 15. Canada Osteoporosis Drugs Market, by Type, 2018 - 2030 (USD Million)
- Table 16. Canada Osteoporosis Drugs Market, by Distribution Channel, 2018 - 2030 (USD Million)
- Table 17. Mexico Osteoporosis Drugs Market, by Drug Class, 2018 - 2030 (USD Million)
- Table 18. Mexico Osteoporosis Drugs Market, by Type, 2018 - 2030 (USD Million)
- Table 19. Mexico Osteoporosis Drugs Market, by Distribution Channel, 2018 - 2030 (USD Million)
- Table 20. Europe Osteoporosis Drugs Market, by Country, 2018 - 2030 (USD Million)
- Table 21. Europe Osteoporosis Drugs Market, by Drug Class, 2018 - 2030 (USD Million)
- Table 22. Europe Osteoporosis Drugs Market, by Type, 2018 - 2030 (USD Million)
- Table 23. Europe Osteoporosis Drugs Market, by Distribution Channel, 2018 - 2030 (USD Million)
- Table 24. UK Osteoporosis Drugs Market, by Drug Class, 2018 - 2030 (USD Million)
- Table 25. UK Osteoporosis Drugs Market, by Type, 2018 - 2030 (USD Million)
- Table 26. UK Osteoporosis Drugs Market, by Distribution Channel, 2018 - 2030 (USD Million)
- Table 27. Germany Osteoporosis Drugs Market, by Drug Class, 2018 - 2030 (USD Million)
- Table 28. Germany Osteoporosis Drugs Market, by Type, 2018 - 2030 (USD Million)
- Table 29. Germany Osteoporosis Drugs Market, by Distribution Channel, 2018 - 2030 (USD Million)
- Table 30. France Osteoporosis Drugs Market, by Drug Class, 2018 - 2030 (USD Million)
- Table 31. France Osteoporosis Drugs Market, by Type, 2018 - 2030 (USD Million)
- Table 32. France Osteoporosis Drugs Market, by Distribution Channel, 2018 - 2030 (USD Million)
- Table 33. Italy Osteoporosis Drugs Market, by Drug Class, 2018 - 2030 (USD Million)
- Table 34. Italy Osteoporosis Drugs Market, by Type, 2018 - 2030 (USD Million)
- Table 35. Italy Osteoporosis Drugs Market, by Distribution Channel, 2018 - 2030 (USD Million)
- Table 36. Spain Osteoporosis Drugs Market, by Drug Class, 2018 - 2030 (USD Million)
- Table 37. Spain Osteoporosis Drugs Market, by Type, 2018 - 2030 (USD Million)
- Table 38. Spain Osteoporosis Drugs Market, by Distribution Channel, 2018 - 2030 (USD Million)
- Table 39. Norway Osteoporosis Drugs Market, by Drug Class, 2018 - 2030 (USD Million)
- Table 40. Norway Osteoporosis Drugs Market, by Type, 2018 - 2030 (USD Million)
- Table 41. Norway Osteoporosis Drugs Market, by Distribution Channel, 2018 - 2030 (USD Million)
- Table 42. Denmark Osteoporosis Drugs Market, by Drug Class, 2018 - 2030 (USD Million)
- Table 43. Denmark Osteoporosis Drugs Market, by Type, 2018 - 2030 (USD Million)
- Table 44. Denmark Osteoporosis Drugs Market, by Distribution Channel, 2018 - 2030 (USD Million)
- Table 45. Sweden Osteoporosis Drugs Market, by Drug Class, 2018 - 2030 (USD Million)
- Table 46. Sweden Osteoporosis Drugs Market, by Type, 2018 - 2030 (USD Million)
- Table 47. Sweden Osteoporosis Drugs Market, by Distribution Channel, 2018 - 2030 (USD Million)
- Table 48. Asia Pacific Osteoporosis Drugs Market, by Country, 2018 - 2030 (USD Million)
- Table 49. Asia Pacific Osteoporosis Drugs Market, by Drug Class, 2018 - 2030 (USD Million)
- Table 50. Asia Pacific Osteoporosis Drugs Market, by Type, 2018 - 2030 (USD Million)
- Table 51. Asia Pacific Osteoporosis Drugs Market, by Distribution Channel, 2018 - 2030 (USD Million)
- Table 52. Japan Osteoporosis Drugs Market, by Drug Class, 2018 - 2030 (USD Million)
- Table 53. Japan Osteoporosis Drugs Market, by Type, 2018 - 2030 (USD Million)
- Table 54. Japan Osteoporosis Drugs Market, by Distribution Channel, 2018 - 2030 (USD Million)
- Table 55. China Osteoporosis Drugs Market, by Drug Class, 2018 - 2030 (USD Million)
- Table 56. China Osteoporosis Drugs Market, by Type, 2018 - 2030 (USD Million)
- Table 57. China Osteoporosis Drugs Market, by Distribution Channel, 2018 - 2030 (USD Million)
- Table 58. India Osteoporosis Drugs Market, by Drug Class, 2018 - 2030 (USD Million)
- Table 59. India Osteoporosis Drugs Market, by Type, 2018 - 2030 (USD Million)
- Table 60. India Osteoporosis Drugs Market, by Distribution Channel, 2018 - 2030 (USD Million)
- Table 61. Australia Osteoporosis Drugs Market, by Drug Class, 2018 - 2030 (USD Million)
- Table 62. Australia Osteoporosis Drugs Market, by Type, 2018 - 2030 (USD Million)
- Table 63. Australia Osteoporosis Drugs Market, by Distribution Channel, 2018 - 2030 (USD Million)
- Table 64. South Korea Osteoporosis Drugs Market, by Drug Class, 2018 - 2030 (USD Million)
- Table 65. South Korea Osteoporosis Drugs Market, by Type, 2018 - 2030 (USD Million)
- Table 66. South Korea Osteoporosis Drugs Market, by Distribution Channel, 2018 - 2030 (USD Million)
- Table 67. Thailand Osteoporosis Drugs Market, by Drug Class, 2018 - 2030 (USD Million)
- Table 68. Thailand Osteoporosis Drugs Market, by Type, 2018 - 2030 (USD Million)
- Table 69. Thailand Osteoporosis Drugs Market, by Distribution Channel, 2018 - 2030 (USD Million)
- Table 70. Latin America Osteoporosis Drugs Market, by country, 2018 - 2030 (USD Million)
- Table 71. Latin America Osteoporosis Drugs Market, by Drug Class, 2018 - 2030 (USD Million)
- Table 72. Latin America Osteoporosis Drugs Market, by Type, 2018 - 2030 (USD Million)
- Table 73. Latin America Osteoporosis Drugs Market, by Distribution Channel, 2018 - 2030 (USD Million)
- Table 74. Brazil Osteoporosis Drugs Market, by Drug Class, 2018 - 2030 (USD Million)
- Table 75. Brazil Osteoporosis Drugs Market, by Type, 2018 - 2030 (USD Million)
- Table 76. Brazil Osteoporosis Drugs Market, by Distribution Channel, 2018 - 2030 (USD Million)
- Table 77. Argentina Osteoporosis Drugs Market, by Drug Class, 2018 - 2030 (USD Million)
- Table 78. Argentina Osteoporosis Drugs Market, by Type, 2018 - 2030 (USD Million)
- Table 79. Argentina Osteoporosis Drugs Market, by Distribution Channel, 2018 - 2030 (USD Million)
- Table 80. Middle East & Africa Osteoporosis Drugs Market, by Country, 2018 - 2030 (USD Million)
- Table 81. Middle East & Africa Osteoporosis Drugs Market, by Drug Class, 2018 - 2030 (USD Million)
- Table 82. Middle East & Africa Osteoporosis Drugs Market, by Type, 2018 - 2030 (USD Million)
- Table 83. Middle East & Africa Osteoporosis Drugs Market, by Distribution Channel, 2018 - 2030 (USD Million)
- Table 84. South Africa Osteoporosis Drugs Market, by Drug Class, 2018 - 2030 (USD Million)
- Table 85. South Africa Osteoporosis Drugs Market, by Type, 2018 - 2030 (USD Million)
- Table 86. South Africa Osteoporosis Drugs Market, by Distribution Channel, 2018 - 2030 (USD Million)
- Table 87. Saudi Arabia Osteoporosis Drugs Market, by Drug Class, 2018 - 2030 (USD Million)
- Table 88. Saudi Arabia Osteoporosis Drugs Market, by Type, 2018 - 2030 (USD Million)
- Table 89. Saudi Arabia Osteoporosis Drugs Market, by Distribution Channel, 2018 - 2030 (USD Million)
- Table 90. UAE Osteoporosis Drugs Market, by Drug Class, 2018 - 2030 (USD Million)
- Table 91. UAE Osteoporosis Drugs Market, by Type, 2018 - 2030 (USD Million)
- Table 92. UAE Osteoporosis Drugs Market, by Distribution Channel, 2018 - 2030 (USD Million)
- Table 93. Kuwait Osteoporosis Drugs Market, by Drug Class, 2018 - 2030 (USD Million)
- Table 94. Kuwait Osteoporosis Drugs Market, by Type, 2018 - 2030 (USD Million)
- Table 95. Kuwait Osteoporosis Drugs Market, by Distribution Channel, 2018 - 2030 (USD Million)
List of Figures
- Fig. 1 Osteoporosis drugs market segmentation
- Fig. 2 Market research process
- Fig. 3 Data triangulation drug class
- Fig. 4 Primary research pattern
- Fig. 5 Market research approaches
- Fig. 6 Value-chain-based sizing & forecasting
- Fig. 7 Market formulation & validation
- Fig. 8 Market snapshot
- Fig. 9 Drug class, type and distribution channel outlook (USD Million)
- Fig. 10 Competitive landscape
- Fig. 11 Osteoporosis drugs market dynamics
- Fig. 12 Osteoporosis drugs market: Porter's five forces analysis
- Fig. 13 Osteoporosis drugs market: PESTEL analysis
- Fig. 14 Osteoporosis drugs market: Drug class segment dashboard
- Fig. 15 Osteoporosis drugs market: Drug class market share analysis, 2024 & 2030
- Fig. 16 Branded market, 2018 - 2030 (USD Million)
- Fig. 17 Generics market, 2018 - 2030 (USD Million)
- Fig. 18 Osteoporosis drugs market: type segment dashboard
- Fig. 19 Osteoporosis drugs market: type market share analysis, 2024 & 2030
- Fig. 20 Bisphosphonates market, 2018 - 2030 (USD Million)
- Fig. 21 Parathyroid hormone therapy market, 2018 - 2030 (USD Million)
- Fig. 22 Calcitonin market, 2018 - 2030 (USD Million)
- Fig. 23 Selective estrogen inhibitors modulator (SERM) market, 2018 - 2030 (USD Million)
- Fig. 24 Rank ligand inhibitors market, 2018 - 2030 (USD Million)
- Fig. 25 Other products market, 2018 - 2030 (USD Million)
- Fig. 26 Osteoporosis drugs market: distribution channel segment dashboard
- Fig. 27 Osteoporosis drugs market: distribution channel market share analysis, 2024 & 2030
- Fig. 28 Hospital pharmacies market, 2018 - 2030 (USD Million)
- Fig. 29 Retail pharmacies market, 2018 - 2030 (USD Million)
- Fig. 30 Online pharmacies market, 2018 - 2030 (USD Million)
- Fig. 31 Osteoporosis drugs market revenue, by region
- Fig. 32 Regional marketplace: key takeaways
- Fig. 33 Regional marketplace: key takeaways
- Fig. 34 North America osteoporosis drugs market, 2018 - 2030 (USD Million)
- Fig. 35 U.S. Country dynamics
- Fig. 36 U.S. Osteoporosis drugs market, 2018 - 2030 (USD Million)
- Fig. 37 Canada country dynamics
- Fig. 38 Canada osteoporosis drugs market, 2018 - 2030 (USD Million)
- Fig. 39 Mexico country dynamics
- Fig. 40 Mexico osteoporosis drugs market, 2018 - 2030 (USD Million)
- Fig. 41 Europe osteoporosis drugs market, 2018 - 2030 (USD Million)
- Fig. 42 UK country dynamics
- Fig. 43 UK osteoporosis drugs market, 2018 - 2030 (USD Million)
- Fig. 44 Germany country dynamics
- Fig. 45 Germany osteoporosis drugs market, 2018 - 2030 (USD Million)
- Fig. 46 France country dynamics
- Fig. 47 France osteoporosis drugs market, 2018 - 2030 (USD Million)
- Fig. 48 Italy country dynamics
- Fig. 49 Italy osteoporosis drugs market, 2018 - 2030 (USD Million)
- Fig. 50 Spain country dynamics
- Fig. 51 Spain osteoporosis drugs market, 2018 - 2030 (USD Million)
- Fig. 52 Norway country dynamics
- Fig. 53 Norway osteoporosis drugs market, 2018 - 2030 (USD Million)
- Fig. 54 Sweden country dynamics
- Fig. 55 Sweden osteoporosis drugs market, 2018 - 2030 (USD Million)
- Fig. 56 Denmark country dynamics
- Fig. 57 Denmark osteoporosis drugs market, 2018 - 2030 (USD Million)
- Fig. 58 Asia pacific osteoporosis drugs market, 2018 - 2030 (USD Million)
- Fig. 59 Japan country dynamics
- Fig. 60 Japan osteoporosis drugs market, 2018 - 2030 (USD Million)
- Fig. 61 China country dynamics
- Fig. 62 China osteoporosis drugs market, 2018 - 2030 (USD Million)
- Fig. 63 India country dynamics
- Fig. 64 India osteoporosis drugs market, 2018 - 2030 (USD Million)
- Fig. 65 Australia country dynamics
- Fig. 66 Australia osteoporosis drugs market, 2018 - 2030 (USD Million)
- Fig. 67 South Korea country dynamics
- Fig. 68 South Korea osteoporosis drugs market, 2018 - 2030 (USD Million)
- Fig. 69 Thailand country dynamics
- Fig. 70 Thailand osteoporosis drugs market, 2018 - 2030 (USD Million)
- Fig. 71 Latin America osteoporosis drugs market, 2018 - 2030 (USD Million)
- Fig. 72 Brazil country dynamics
- Fig. 73 Brazil osteoporosis drugs market, 2018 - 2030 (USD Million)
- Fig. 74 Argentina country dynamics
- Fig. 75 Argentina osteoporosis drugs market, 2018 - 2030 (USD Million)
- Fig. 76 MEA osteoporosis drugs market, 2018 - 2030 (USD Million)
- Fig. 77 South Africa country dynamics
- Fig. 78 South Africa osteoporosis drugs market, 2018 - 2030 (USD Million)
- Fig. 79 Saudi Arabia country dynamics
- Fig. 80 Saudi Arabia osteoporosis drugs market, 2018 - 2030 (USD Million)
- Fig. 81 UAE country dynamics
- Fig. 82 UAE osteoporosis drugs market, 2018 - 2030 (USD Million)
- Fig. 83 Kuwait country dynamics
- Fig. 84 Kuwait osteoporosis drugs market, 2018 - 2030 (USD Million)
- Fig. 85 Company categorization
- Fig. 86 Company market position analysis
- Fig. 87 Strategic framework
Osteoporosis Drugs Market Growth & Trends:
The global osteoporosis drugs market size is expected to reach USD 18.8 billion by 2030 and is projected to grow at a CAGR of 3.5% from 2025 to 2030, according to a new report by Grand View Research, Inc. An upsurge rise in the unhealthy lifestyle adoption has resulted in aggravation and increase in the prevalence of osteoporosis which is presumed to propel the osteoporosis drugs market during the forecast period.
In addition, growing number of patent expiries is fueling the high clinical urgency to use generic versions of the established drugs, which is presumed to fuel generic osteoporosis drugs market during the forecast period. The aforementioned factors cumulatively are slated to present the with high potential growth opportunities over the coming years.
Furthermore, rising number of initiatives to increase the awareness levels pertaining to osteoporosis care amongst the patients as well as the physicians is expected to widen the osteoporosis market growth potential during the forecast period. For instance, National Osteoporosis Foundation (NOF), a healthcare organization responsible for National Bone Health Alliance and Fracture Liaison Service (FLS) care coordination programs that focuses on elevating awareness levels as well as provides training to healthcare professionals
Osteoporosis Drugs Market Report Highlights:
- Branded drugs held the dominant share of the product segment in 2024. The dominant share can be attributed to extensive utilization of bisphosphates, rank ligand inhibitors for the treatment of osteoporosis, possessing high efficacy
- Generics are expected to witness at a lucrative CAGR owing to consistent patent expiries over the coming years as well as high clinical urgency for inexpensive medication in the emerging economies
- In 2024, North America accounted for the largest share in the global osteoporosis drugs market owing to the presence of established companies extensively involved in the commercialization of branded therapeutics
- Asia Pacific is anticipated to grow at an exponential CAGR as a consequence of favorable government initiatives promoting information pertaining to osteoporosis care
- The key participants are employing sustainability strategies promoting the adoption of osteoporosis therapeutics to gain competitive advantage. For instance, Actavis Inc. announced to acquire Warner Chilcott PLC in order to widen their product portfolio
Table of Contents
Chapter 1. Methodology and Scope
- 1.1. Market Segmentation & Scope
- 1.2. Segment Definitions
- 1.2.1. Drug Class
- 1.2.2. Type
- 1.2.3. Distribution Channel
- 1.3. Estimates and Forecast Timeline
- 1.4. Research Methodology
- 1.5. Information Procurement
- 1.5.1. Purchased Database
- 1.5.2. GVR's Internal Database
- 1.5.3. Secondary Sources
- 1.5.4. Primary Research
- 1.6. Information Analysis
- 1.6.1. Data Analysis Models
- 1.7. Market Formulation & Data Visualization
- 1.8. Model Details
- 1.8.1. Commodity Flow Analysis
- 1.9. List of Secondary Sources
- 1.10. Objectives
Chapter 2. Executive Summary
- 2.1. Market Snapshot
- 2.2. Segment Snapshot
- 2.3. Competitive Landscape Snapshot
Chapter 3. Osteoporosis Drugs Market Variables, Trends, & Scope
- 3.1. Market Lineage Outlook
- 3.2. Market Dynamics
- 3.2.1. Market Driver Analysis
- 3.2.2. Market Restraint Analysis
- 3.3. Business Environment Analysis
- 3.3.1. Industry Analysis - Porter's Five Forces Analysis
- 3.3.1.1. Supplier Power
- 3.3.1.2. Buyer Power
- 3.3.1.3. Substitution Threat
- 3.3.1.4. Threat of New Entrants
- 3.3.1.5. Competitive Rivalry
- 3.3.2. PESTLE Analysis
- 3.3.1. Industry Analysis - Porter's Five Forces Analysis
Chapter 4. Osteoporosis Drugs Market: Drug Class Business Analysis
- 4.1. Drug Class Market Share, 2024 & 2030
- 4.2. Drug Class Segment Dashboard
- 4.3. Market Size & Forecasts and Trend Analysis, by Drug Class, 2018 to 2030 (USD Million)
- 4.4. Branded
- 4.4.1. Branded Market, 2018 - 2030 (USD Million)
- 4.5. Generics
- 4.5.1. Generics Market, 2018 - 2030 (USD Million)
Chapter 5. Osteoporosis Drugs Market: Type Business Analysis
- 5.1. Type Market Share, 2024 & 2030
- 5.2. Type Segment Dashboard
- 5.3. Market Size & Forecasts and Trend Analysis, by Type, 2018 to 2030 (USD Million)
- 5.4. Bisphosphonates
- 5.4.1. Bisphosphonates Market, 2018 - 2030 (USD Million)
- 5.5. Parathyroid Hormone Therapy
- 5.5.1. Parathyroid Hormone Therapy Market, 2018 - 2030 (USD Million)
- 5.6. Calcitonin
- 5.6.1. Calcitonin Market, 2018 - 2030 (USD Million)
- 5.7. Selective Estrogen Inhibitors Modulator (SERM)
- 5.7.1. Selective Estrogen Inhibitors Modulator (SERM) Market, 2018 - 2030 (USD Million)
- 5.8. Rank Ligand Inhibitors
- 5.8.1. Rank Ligand Inhibitors Market, 2018 - 2030 (USD Million)
- 5.9. Other Products
- 5.9.1. Other Products Market, 2018 - 2030 (USD Million)
Chapter 6. Osteoporosis Drugs Market: Distribution Channel Business Analysis
- 6.1. Distribution Channel Market Share, 2024 & 2030
- 6.2. Distribution Channel Segment Dashboard
- 6.3. Market Size & Forecasts and Trend Analysis, by Distribution Channel, 2018 to 2030 (USD Million)
- 6.4. Hospital Pharmacies
- 6.4.1. Hospital Pharmacies Market, 2018 - 2030 (USD Million)
- 6.5. Retail Pharmacies
- 6.5.1. Retail Pharmacies Market, 2018 - 2030 (USD Million)
- 6.6. Online Pharmacies
- 6.6.1. Online Pharmacies Market, 2018 - 2030 (USD Million)
Chapter 7. Osteoporosis Drugs Market: Regional Estimates & Trend Analysis
- 7.1. Regional Market Share Analysis, 2024 & 2030
- 7.2. Regional Market Dashboard
- 7.3. Market Size & Forecasts Trend Analysis, 2018 to 2030:
- 7.4. North America
- 7.4.1. North America Osteoporosis Drugs Market Estimates And Forecasts, By Country, 2018 - 2030 (USD Million)
- 7.4.2. U.S.
- 7.4.2.1. Key Country Dynamics
- 7.4.2.2. Regulatory Framework
- 7.4.2.3. Competitive Insights
- 7.4.2.4. U.S. Osteoporosis Drugs Market Estimates And Forecasts, 2018 - 2030 (USD Million)
- 7.4.3. Canada
- 7.4.3.1. Key Country Dynamics
- 7.4.3.2. Regulatory Framework
- 7.4.3.3. Competitive Insights
- 7.4.3.4. Canada Osteoporosis Drugs Market Estimates And Forecasts, 2018 - 2030 (USD Million)
- 7.4.4. Mexico
- 7.4.4.1. Key Country Dynamics
- 7.4.4.2. Regulatory Framework
- 7.4.4.3. Competitive Insights
- 7.4.4.4. Mexico Osteoporosis Drugs Market Estimates And Forecasts, 2018 - 2030 (USD Million)
- 7.5. Europe
- 7.5.1. Europe Osteoporosis Drugs Market Estimates And Forecasts, By Country, 2018 - 2030 (USD Million)
- 7.5.2. UK
- 7.5.2.1. Key Country Dynamics
- 7.5.2.2. Regulatory Framework
- 7.5.2.3. Competitive Insights
- 7.5.2.4. UK Osteoporosis Drugs Market Estimates And Forecasts, 2018 - 2030 (USD Million)
- 7.5.3. Germany
- 7.5.3.1. Key Country Dynamics
- 7.5.3.2. Regulatory Framework
- 7.5.3.3. Competitive Insights
- 7.5.3.4. Germany Osteoporosis Drugs Market Estimates And Forecasts, 2018 - 2030 (USD Million)
- 7.5.4. France
- 7.5.4.1. Key Country Dynamics
- 7.5.4.2. Regulatory Framework
- 7.5.4.3. Competitive Insights
- 7.5.4.4. France Osteoporosis Drugs Market Estimates And Forecasts, 2018 - 2030 (USD Million)
- 7.5.5. Italy
- 7.5.5.1. Key Country Dynamics
- 7.5.5.2. Regulatory Framework
- 7.5.5.3. Competitive Insights
- 7.5.5.4. Italy Osteoporosis Drugs Market Estimates And Forecasts, 2018 - 2030 (USD Million)
- 7.5.6. Spain
- 7.5.6.1. Key Country Dynamics
- 7.5.6.2. Regulatory Framework
- 7.5.6.3. Competitive Insights
- 7.5.6.4. Spain Osteoporosis Drugs Market Estimates And Forecasts, 2018 - 2030 (USD Million)
- 7.5.7. Norway
- 7.5.7.1. Key Country Dynamics
- 7.5.7.2. Regulatory Framework
- 7.5.7.3. Competitive Insights
- 7.5.7.4. Norway Osteoporosis Drugs Market Estimates And Forecasts, 2018 - 2030 (USD Million)
- 7.5.8. Denmark
- 7.5.8.1. Key Country Dynamics
- 7.5.8.2. Regulatory Framework
- 7.5.8.3. Competitive Insights
- 7.5.8.4. Denmark Osteoporosis Drugs Market Estimates And Forecasts, 2018 - 2030 (USD Million)
- 7.5.9. Sweden
- 7.5.9.1. Key Country Dynamics
- 7.5.9.2. Regulatory Framework
- 7.5.9.3. Competitive Insights
- 7.5.9.4. Sweden Osteoporosis Drugs Market Estimates And Forecasts, 2018 - 2030 (USD Million)
- 7.6. Asia Pacific
- 7.6.1. Asia Pacific Osteoporosis Drugs Market Estimates And Forecasts, By Country, 2018 - 2030 (USD Million)
- 7.6.2. Japan
- 7.6.2.1. Key Country Dynamics
- 7.6.2.2. Regulatory Framework
- 7.6.2.3. Competitive Insights
- 7.6.2.4. Japan Osteoporosis Drugs Market Estimates And Forecasts, 2018 - 2030 (USD Million)
- 7.6.3. China
- 7.6.3.1. Key Country Dynamics
- 7.6.3.2. Regulatory Framework
- 7.6.3.3. Competitive Insights
- 7.6.3.4. China Osteoporosis Drugs Market Estimates And Forecasts, 2018 - 2030 (USD Million)
- 7.6.4. India
- 7.6.4.1. Key Country Dynamics
- 7.6.4.2. Regulatory Framework
- 7.6.4.3. Competitive Insights
- 7.6.4.4. India Osteoporosis Drugs Market Estimates And Forecasts, 2018 - 2030 (USD Million)
- 7.6.5. South Korea
- 7.6.5.1. Key Country Dynamics
- 7.6.5.2. Regulatory Framework
- 7.6.5.3. Competitive Insights
- 7.6.5.4. South Korea Osteoporosis Drugs Market Estimates And Forecasts, 2018 - 2030 (USD Million)
- 7.6.6. Australia
- 7.6.6.1. Key Country Dynamics
- 7.6.6.2. Regulatory Framework
- 7.6.6.3. Competitive Insights
- 7.6.6.4. Australia Osteoporosis Drugs Market Estimates And Forecasts, 2018 - 2030 (USD Million)
- 7.6.7. Thailand
- 7.6.7.1. Key Country Dynamics
- 7.6.7.2. Regulatory Framework
- 7.6.7.3. Competitive Insights
- 7.6.7.4. Thailand Osteoporosis Drugs Market Estimates And Forecasts, 2018 - 2030 (USD Million)
- 7.7. Latin America
- 7.7.1. Latin America Osteoporosis Drugs Market Estimates And Forecasts, By Country, 2018 - 2030 (USD Million)
- 7.7.2. Brazil
- 7.7.2.1. Key Country Dynamics
- 7.7.2.2. Regulatory Framework
- 7.7.2.3. Competitive Insights
- 7.7.2.4. Brazil Osteoporosis Drugs Market Estimates And Forecasts, 2018 - 2030 (USD Million)
- 7.7.3. Argentina
- 7.7.3.1. Key Country Dynamics
- 7.7.3.2. Regulatory Framework
- 7.7.3.3. Competitive Insights
- 7.7.3.4. Argentina Osteoporosis Drugs Market Estimates And Forecasts, 2018 - 2030 (USD Million)
- 7.8. MEA
- 7.8.1. MEA Osteoporosis Drugs Market Estimates And Forecasts, By Country, 2018 - 2030 (USD Million)
- 7.8.2. South Africa
- 7.8.2.1. Key Country Dynamics
- 7.8.2.2. Regulatory Framework
- 7.8.2.3. Competitive Insights
- 7.8.2.4. South Africa Osteoporosis Drugs Market Estimates And Forecasts, 2018 - 2030 (USD Million)
- 7.8.3. Saudi Arabia
- 7.8.3.1. Key Country Dynamics
- 7.8.3.2. Regulatory Framework
- 7.8.3.3. Competitive Insights
- 7.8.3.4. Saudi Arabia Osteoporosis Drugs Market Estimates And Forecasts, 2018 - 2030 (USD Million)
- 7.8.4. UAE
- 7.8.4.1. Key Country Dynamics
- 7.8.4.2. Regulatory Framework
- 7.8.4.3. Competitive Insights
- 7.8.4.4. UAE Osteoporosis Drugs Market Estimates And Forecasts, 2018 - 2030 (USD Million)
- 7.8.5. Kuwait
- 7.8.5.1. Key Country Dynamics
- 7.8.5.2. Regulatory Framework
- 7.8.5.3. Competitive Insights
- 7.8.5.4. Kuwait Osteoporosis Drugs Market Estimates And Forecasts, 2018 - 2030 (USD Million)
Chapter 8. Competitive Landscape
- 8.1. Participant Overview
- 8.2. Company Market Position Analysis
- 8.3. Company Categorization
- 8.4. Strategy Mapping
- 8.5. Company Profiles/Listing
- 8.5.1. Amgen Inc.
- 8.5.1.1. Overview
- 8.5.1.2. Financial Performance
- 8.5.1.3. Product Benchmarking
- 8.5.1.4. Strategic Initiatives
- 8.5.2. Eli Lilly and Company
- 8.5.2.1. Overview
- 8.5.2.2. Financial Performance
- 8.5.2.3. Product Benchmarking
- 8.5.2.4. Strategic Initiatives
- 8.5.3. Merck & Co., Inc.
- 8.5.3.1. Overview
- 8.5.3.2. Financial Performance
- 8.5.3.3. Product Benchmarking
- 8.5.3.4. Strategic Initiatives
- 8.5.4. Novartis AG
- 8.5.4.1. Overview
- 8.5.4.2. Financial Performance
- 8.5.4.3. Product Benchmarking
- 8.5.4.4. Strategic Initiatives
- 8.5.5. Pfizer Inc.
- 8.5.5.1. Overview
- 8.5.5.2. Financial Performance
- 8.5.5.3. Product Benchmarking
- 8.5.5.4. Strategic Initiatives
- 8.5.6. GSK plc
- 8.5.6.1. Overview
- 8.5.6.2. Financial Performance
- 8.5.6.3. Product Benchmarking
- 8.5.6.4. Strategic Initiatives
- 8.5.7. Radius Health, Inc.
- 8.5.7.1. Overview
- 8.5.7.2. Financial Performance
- 8.5.7.3. Product Benchmarking
- 8.5.7.4. Strategic Initiatives
- 8.5.8. UCB S.A.
- 8.5.8.1. Overview
- 8.5.8.2. Financial Performance
- 8.5.8.3. Product Benchmarking
- 8.5.8.4. Strategic Initiatives
- 8.5.9. Teva Pharmaceutical Industries Ltd.
- 8.5.9.1. Overview
- 8.5.9.2. Financial Performance
- 8.5.9.3. Product Benchmarking
- 8.5.9.4. Strategic Initiatives
- 8.5.10. F. Hoffmann-La Roche Ltd
- 8.5.10.1. Overview
- 8.5.10.2. Financial Performance
- 8.5.10.3. Product Benchmarking
- 8.5.10.4. Strategic Initiatives
- 8.5.1. Amgen Inc.
