|
|
市場調査レポート
商品コード
1679553
膜分離材料の市場規模、シェア、動向分析レポート:製品タイプ別、最終用途別、地域別、セグメント別予測、2025年~2030年Membrane Separation Materials Market Size, Share & Trends Analysis Report By Product Type, By End-use, By Region, And Segment Forecasts, 2025 - 2030 |
||||||
|
|||||||
カスタマイズ可能
|
|||||||

| 膜分離材料の市場規模、シェア、動向分析レポート:製品タイプ別、最終用途別、地域別、セグメント別予測、2025年~2030年 |
|
出版日: 2025年02月18日
発行: Grand View Research
ページ情報: 英文 101 Pages
納期: 2~10営業日
|

全表示
- 概要
- 図表
- 目次
膜分離材料市場の成長と動向
Grand View Research, Inc.の最新レポートによると、世界の膜分離材市場規模は2030年までに294億7,000万米ドルに達すると予測され、2025~2030年のCAGRは5.6%で成長すると予測されています。
世界の膜分離材産業は、水処理と廃水管理ソリューションの需要増加によって牽引されています。急速な都市化と産業の拡大に伴い、水質汚染は重大な懸念事項となっており、世界の環境規制の強化につながっています。
政府や民間団体は、清潔な水の供給と効果的な廃水リサイクルを確保するため、逆浸透(RO)、限外濾過(UF)、精密濾過(MF)などの先進的膜分離技術に多額の投資を行っています。特に中東・アフリカ、アジアの一部などの水が乏しい地域で海水淡水化プラントの導入が拡大していることが、優れた濾過効率と長期耐久性を提供する高性能膜分離材料の需要をさらに押し上げています。
もう一つの重要な促進要因は、製薬・バイオテクノロジー産業からの需要の高まりであり、そこでは膜分離が薬剤製剤、タンパク質精製、無菌濾過プロセスにおいて重要な役割を果たしています。高純度溶媒やバイオ医薬品へのニーズの高まりにより、精密な分子分離と汚染制御を実現するナノ濾過(NF)膜や限外濾過膜の採用が拡大しています。医薬品製造を管理する厳しい規制の枠組みは、品質と安全基準の遵守を保証する先進的膜材料への需要をさらに押し上げています。さらに、個別化医療や生物製剤への注目の高まりが、膜ベースの精製システムへの投資に拍車をかけています。
膜分離技術が乳製品加工、飲食品濾過、糖分濃縮に広く使用されていることから、飲食品産業も市場成長の要因となっています。食品の安全性と品質に関する消費者の意識の高まりが、栄養価を維持しながら製品の純度を高める高性能濾過材料の採用をメーカーに促しています。さらに、植物性飲料や機能性飲料の需要により、タンパク質の抽出、不純物の除去、保存期間の延長を目的とした膜ベースの分離への依存度が高まっています。サステイナブル加工ソリューションへの嗜好の高まりも、従来の化学品を多用する分離方法をエコフレンドリー膜技術に置き換えるよう企業に促しています。
膜分離材料市場レポートハイライト
- 持続可能でエネルギー効率の高い分離技術に対する需要の高まりにより、2024年には高分子セグメントが60.56%の最大売上シェアで市場を牽引。これらの膜は、逆浸透(RO)、限外濾過(UF)、ナノ濾過(NF)などの低エネルギー濾過プロセスを促進し、従来の分離方法と比較して運用コストと環境への影響を低減します。
- 最終用途別では、清潔で安全な飲料水に対する世界の需要の増加により、上水・廃水処理セグメントが2024年に45.55%の最大収益シェアで市場をリードしました。急速な都市化、産業拡大、人口増加が水消費量の増加につながり、効率的な浄水・廃水管理ソリューションが必要とされています。
- アジア太平洋は、2024年に34.01%の最大収益シェアで市場を独占しました。アジア太平洋の製薬・バイオテクノロジー産業が、高純度濾過システムの需要を牽引しており、特にバイオ医薬品の生産が拡大している中国、インド、韓国ではその傾向が顕著です。
目次
第1章 調査手法と範囲
第2章 エグゼクティブサマリー
第3章 膜分離材料市場の変数、動向、範囲
- 市場の系統/関連市場の展望
- 産業バリューチェーン分析
- 流通チャネル分析
- 規制の枠組み
- アナリストの視点
- 規制と基準
- 市場力学
- 市場促進要因分析
- 市場抑制要因分析
- 産業の機会
- 産業の課題
- ビジネス環境ツール分析:膜分離材料市場
- ポーターのファイブフォース分析
- PESTLE分析
- 市場混乱分析
第4章 膜分離材料市場:製品タイプ別、推定・動向分析
- 主要ポイント
- 製品タイプ変動分析と市場シェア、2024年と2030年
- 世界の膜分離材料市場:製品タイプ別、2018~2030年
- セラミック
- セラミック別、2018~2030年
- ポリマー
- ポリマー別、2018~2030年
- 金属
- 金属別、2018~2030年
- その他
- その他別、2018~2030年
第5章 膜分離材料市場:最終用途別、推定・動向分析
- 主要ポイント
- 最終用途変動分析と市場シェア、2024年と2030年
- 世界の膜分離材料市場:最終用途別、2018~2030年
- 水・廃水処理
- 水・廃水処理別、2018~2030年
- 産業加工
- 産業加工別、2018~2030年
- 飲食品加工
- 飲食品加工別、2018~2030年
- 医薬品・医療
- 医薬品・医療別、2018~2030年
- その他
- その他別、2018~2030年
第6章 膜分離材料市場:地域別、推定・動向分析
- 主要ポイント
- 地域別市場シェア分析、2024年と2030年
- 北米
- 製品タイプ別、2018~2030年
- 最終用途別、2018~2030年
- 米国
- カナダ
- メキシコ
- 欧州
- 製品タイプ別、2018~2030年
- 最終用途別、2018~2030年
- ドイツ
- 英国
- フランス
- イタリア
- スペイン
- アジア太平洋
- 製品タイプ別、2018~2030年
- 最終用途別、2018~2030年
- 中国
- インド
- 日本
- 韓国
- 中南米
- 製品タイプ別、2018~2030年
- 最終用途別、2018~2030年
- 中東・アフリカ
- 製品タイプ別、2018~2030年
- 最終用途別、2018~2030年
第7章 サプライヤー情報
- クラリッチマトリックス
- エンゲージメントモデル
- 交渉戦略
- 調達のベストプラクティス
- ベンダー選択基準
第8章 競合情勢
- 主要参入企業、その最近の動向、産業への影響
- 競合の分類
- 企業の市況分析
- 企業ヒートマップ分析
- 戦略マッピング、2024年
- 企業リスト
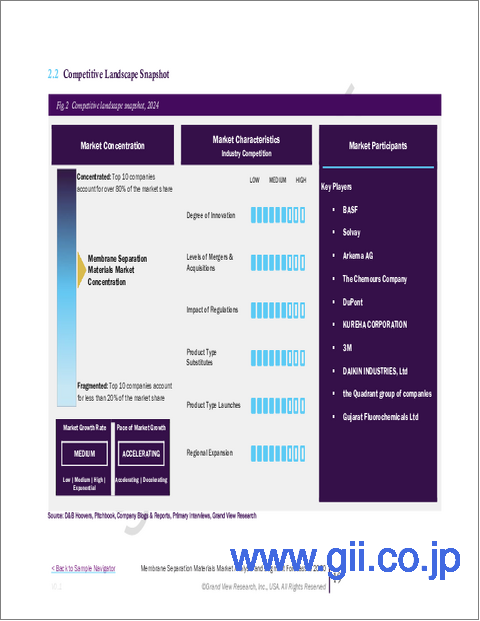
- BASF
- Solvay
- Arkema AG
- The Chemours Company
- DuPont
- KUREHA CORPORATION
- 3M
- DAIKIN INDUSTRIES, Ltd
- The Quadrant group of companies
- Gujarat Fluorochemicals Ltd
List of Tables
- Table 1. Membrane Separation Materials Market Estimates And Forecasts, by Ceramic 2018 - 2030 (USD Million)
- Table 2. Membrane Separation Materials Market Estimates And Forecasts, by Polymeric, 2018 - 2030 (USD Million)
- Table 3. Membrane Separation Materials Market Estimates And Forecasts, by Metallic 2018 - 2030 (USD Million)
- Table 4. Membrane Separation Materials Market Estimates And Forecasts, by Other Product Types, 2018 - 2030 (USD Million)
- Table 5. Membrane Separation Materials Market Estimates And Forecasts, by Water & Wastewater Treatment, 2018 - 2030 (USD Million)
- Table 6. Membrane Separation Materials Market Estimates And Forecasts, by Industry Processing, 2018 - 2030 (USD Million)
- Table 7. Membrane Separation Materials Market Estimates And Forecasts, by Food & Beverage Processing, 2018 - 2030 (USD Million)
- Table 8. Membrane Separation Materials Market Estimates And Forecasts, by Pharmaceutical & Medical, 2018 - 2030 (USD Million)
- Table 9. Membrane Separation Materials Market Estimates And Forecasts, by Other End Uses, 2018 - 2030 (USD Million)
- Table 10. North America Membrane Separation Materials Market Estimates And Forecasts, 2018 - 2030 (USD Million)
- Table 11. North America Membrane Separation Materials Market Estimates And Forecasts, By Product Type, 2018 - 2030 (USD Million)
- Table 12. North America Membrane Separation Materials Market Estimates And Forecasts, By End Use, 2018 - 2030 (USD Million)
- Table 13. U.S. Membrane Separation Materials Market Estimates And Forecasts, 2018 - 2030 (USD Million)
- Table 14. U.S. Membrane Separation Materials Market Estimates And Forecasts, By Product Type, 2018 - 2030 (USD Million)
- Table 15. U.S. Membrane Separation Materials Market Estimates And Forecasts, By End Use, 2018 - 2030 (USD Million)
- Table 16. Canada Membrane Separation Materials Market Estimates And Forecasts, 2018 - 2030 (USD Million)
- Table 17. Canada Membrane Separation Materials Market Estimates And Forecasts, By Product Type, 2018 - 2030 (USD Million)
- Table 18. Canada Membrane Separation Materials Market Estimates And Forecasts, By End Use, 2018 - 2030 (USD Million)
- Table 19. Mexico Membrane Separation Materials Market Estimates And Forecasts, 2018 - 2030 (USD Million)
- Table 20. Mexico Membrane Separation Materials Market Estimates And Forecasts, By Product Type, 2018 - 2030 (USD Million)
- Table 21. Mexico Membrane Separation Materials Market Estimates And Forecasts, By End Use, 2018 - 2030 (USD Million)
- Table 22. Europe Membrane Separation Materials Market Estimates And Forecasts, 2018 - 2030 (USD Million)
- Table 23. Europe Membrane Separation Materials Market Estimates And Forecasts, By Product Type, 2018 - 2030 (USD Million)
- Table 24. Europe Membrane Separation Materials Market Estimates And Forecasts, By End Use, 2018 - 2030 (USD Million)
- Table 25. Germany Membrane Separation Materials Market Estimates And Forecasts, 2018 - 2030 (USD Million)
- Table 26. Germany Membrane Separation Materials Market Estimates And Forecasts, By Product Type, 2018 - 2030 (USD Million)
- Table 27. Germany Membrane Separation Materials Market Estimates And Forecasts, By End Use, 2018 - 2030 (USD Million)
- Table 28. UK Membrane Separation Materials Market Estimates And Forecasts, 2018 - 2030 (USD Million)
- Table 29. UK Membrane Separation Materials Market Estimates And Forecasts, By Product Type, 2018 - 2030 (USD Million)
- Table 30. UK Membrane Separation Materials Market Estimates And Forecasts, By End Use, 2018 - 2030 (USD Million)
- Table 31. France Membrane Separation Materials Market Estimates And Forecasts, 2018 - 2030 (USD Million)
- Table 32. France Membrane Separation Materials Market Estimates And Forecasts, By Product Type, 2018 - 2030 (USD Million)
- Table 33. France Membrane Separation Materials Market Estimates And Forecasts, By End Use, 2018 - 2030 (USD Million)
- Table 34. Italy Membrane Separation Materials Market Estimates And Forecasts, 2018 - 2030 (USD Million)
- Table 35. Italy Membrane Separation Materials Market Estimates And Forecasts, By Product Type, 2018 - 2030 (USD Million)
- Table 36. Italy Membrane Separation Materials Market Estimates And Forecasts, By End Use, 2018 - 2030 (USD Million)
- Table 37. Spain Membrane Separation Materials Market Estimates And Forecasts, 2018 - 2030 (USD Million)
- Table 38. Spain Membrane Separation Materials Market Estimates And Forecasts, By Product Type, 2018 - 2030 (USD Million)
- Table 39. Spain Membrane Separation Materials Market Estimates And Forecasts, By End Use, 2018 - 2030 (USD Million)
- Table 40. Asia Pacific Membrane Separation Materials Market Estimates And Forecasts, 2018 - 2030 (USD Million)
- Table 41. Asia Pacific Membrane Separation Materials Market Estimates And Forecasts, By Product Type, 2018 - 2030 (USD Million)
- Table 42. Asia Pacific Membrane Separation Materials Market Estimates And Forecasts, By End Use, 2018 - 2030 (USD Million)
- Table 43. China Membrane Separation Materials Market Estimates And Forecasts, 2018 - 2030 (USD Million)
- Table 44. China Membrane Separation Materials Market Estimates And Forecasts, By Product Type, 2018 - 2030 (USD Million)
- Table 45. China Membrane Separation Materials Market Estimates And Forecasts, By End Use, 2018 - 2030 (USD Million)
- Table 46. India Membrane Separation Materials Market Estimates And Forecasts, 2018 - 2030 (USD Million)
- Table 47. India Membrane Separation Materials Market Estimates And Forecasts, By Product Type, 2018 - 2030 (USD Million)
- Table 48. India Membrane Separation Materials Market Estimates And Forecasts, By End Use, 2018 - 2030 (USD Million)
- Table 49. Japan Membrane Separation Materials Market Estimates And Forecasts, 2018 - 2030 (USD Million)
- Table 50. Japan Membrane Separation Materials Market Estimates And Forecasts, By Product Type, 2018 - 2030 (USD Million)
- Table 51. Japan Membrane Separation Materials Market Estimates And Forecasts, By End Use, 2018 - 2030 (USD Million)
- Table 52. South Korea Membrane Separation Materials Market Estimates And Forecasts, 2018 - 2030 (USD Million)
- Table 53. South Korea Membrane Separation Materials Market Estimates And Forecasts, By Product Type, 2018 - 2030 (USD Million)
- Table 54. South Korea Membrane Separation Materials Market Estimates And Forecasts, By End Use, 2018 - 2030 (USD Million)
- Table 55. Central & South America Membrane Separation Materials Market Estimates And Forecasts, 2018 - 2030 (USD Million)
- Table 56. Central & South America Membrane Separation Materials Market Estimates And Forecasts, By Product Type, 2018 - 2030 (USD Million)
- Table 57. Central & South America Membrane Separation Materials Market Estimates And Forecasts, By End Use, 2018 - 2030 (USD Million)
- Table 58. Middle East & Africa Membrane Separation Materials Market Estimates And Forecasts, 2018 - 2030 (USD Million)
- Table 59. Middle East & Africa Membrane Separation Materials Market Estimates And Forecasts, By Product Type, 2018 - 2030 (USD Million)
- Table 60. Middle East & Africa Membrane Separation Materials Market Estimates And Forecasts, By End Use, 2018 - 2030 (USD Million)
List of Figures
- Fig. 1 Information Procurement
- Fig. 2 Primary Research Pattern
- Fig. 3 Primary Research Process
- Fig. 4 Market Research Approaches - Bottom-Up Approach
- Fig. 5 Market Research Approaches - Top-Down Approach
- Fig. 6 Market Research Approaches - Combined Approach
- Fig. 7 Market Snapshot
- Fig. 8 Segmental Outlook
- Fig. 9 Competitive Outlook
- Fig. 10 Membrane Separation Materials Market - Value Chain Analysis
- Fig. 11 Membrane Separation Materials Market - Sales Channel Analysis
- Fig. 12 Market Drivers Impact Analysis
- Fig. 13 Market Restraint Impact Analysis
- Fig. 14 Industry Analysis - PORTERS
- Fig. 15 Industry Analysis - PESTEL by SWOT
- Fig. 16 Product Type: Key Takeaways
- Fig. 17 Product Type: Market Share, 2024 & 2030
- Fig. 18 End Use: Key Takeaways
- Fig. 19 End Use: Market Share, 2024 & 2030
- Fig. 20 Region, 2024 & 2030, (USD Million)
- Fig. 21 Regional Marketplace: Key Takeaways
- Fig. 22 Kraljic Matrix
- Fig. 23 Engagement Model
- Fig. 24 Sourcing Best Practices
- Fig. 25 Sourcing Best Practices
- Fig. 26 Competition Categorization
- Fig. 27 Company Market Positioning
- Fig. 28 Strategy Mapping, 2024
Membrane Separation Materials Market Growth & Trends:
The global membrane separation materials market size is anticipated to reach USD 29.47 billion by 2030 and is projected to grow at a CAGR of 5.6% from 2025 to 2030, according to a new report by Grand View Research, Inc.The global membrane separation materials industry is driven by the increasing demand for water treatment and wastewater management solutions. With rapid urbanization and industrial expansion, water contamination has become a critical concern, leading to stricter environmental regulations worldwide.
Governments and private entities are heavily investing in advanced membrane separation technologies such as reverse osmosis (RO), ultrafiltration (UF), and microfiltration (MF) to ensure clean water supply and effective wastewater recycling. The growing adoption of desalination plants, particularly in water-scarce regions such as the Middle East, Africa, and parts of Asia, is further propelling the demand for high-performance membrane separation materials, as they offer superior filtration efficiency and long-term durability.
Another significant driver is the rising demand from the pharmaceutical and biotechnology industries, where membrane separation plays a crucial role in drug formulation, protein purification, and sterile filtration processes. The increasing need for high-purity solvents and biopharmaceutical products has led to greater adoption of nanofiltration (NF) and ultrafiltration membranes, which provide precise molecular separation and contamination control. Stringent regulatory frameworks governing pharmaceutical manufacturing have further pushed the demand for advanced membrane materials that ensure compliance with quality and safety standards. In addition, the growing focus on personalized medicine and biologics is fueling investments in membrane-based purification systems.
The food and beverage industry is another factor in market growth, as membrane separation technologies are widely used for dairy processing, beverage filtration, and sugar concentration. Rising consumer awareness regarding food safety and quality has driven manufacturers to adopt high-performance filtration materials that enhance product purity while maintaining nutritional value. In addition, the demand for plant-based and functional beverages has led to increased reliance on membrane-based separation for extracting proteins, removing impurities, and extending shelf life. The growing preference for sustainable processing solutions has also prompted companies to replace conventional chemical-intensive separation methods with environmentally friendly membrane technologies.
Membrane Separation Materials Market Report Highlights:
- The polymeric segment led the market with the largest revenue share of 60.56% in 2024, driven by rising demand for sustainable and energy-efficient separation technologies. These membranes facilitate low-energy filtration processes, such as reverse osmosis (RO), ultrafiltration (UF), and nanofiltration (NF), reducing operational costs and environmental impact compared to conventional separation methods.
- Based on end use, the water & wastewater treatment segment led the market with the largest revenue share of 45.55% in 2024,due to the increasing global demand for clean and safe drinking water. Rapid urbanization, industrial expansion, and population growth have led to higher water consumption, necessitating efficient water purification and wastewater management solutions.
- Asia Pacific dominated the market with the largest revenue share of 34.01% in 2024.Pharmaceutical and biotechnology industries in Asia Pacific have driven the demand for high-purity filtration systems, particularly in China, India, and South Korea, where biopharmaceutical production is expanding.
Table of Contents
Chapter 1. Methodology and Scope
- 1.1. Research Methodology
- 1.2. Research Scope & Assumption
- 1.3. Information Procurement
- 1.3.1. Purchased Database
- 1.3.2. GVR's Internal Database
- 1.3.3. Secondary Sources & Third-Party Perspectives
- 1.3.4. Primary Research
- 1.4. Information Analysis
- 1.4.1. Data Analysis Models
- 1.5. Market Formulation & Data Visualization
- 1.6. List of Data Sources
Chapter 2. Executive Summary
- 2.1. Market Outlook, 2024 (USD Billion)
- 2.2. Segmental Outlook
- 2.3. Competitive Insights
Chapter 3. Membrane Separation Materials Market Variables, Trends & Scope
- 3.1. Market Lineage/Ancillary Market Outlook
- 3.2. Industry Value Chain Analysis
- 3.2.1. Sales Channel Analysis
- 3.3. Regulatory Framework
- 3.3.1. Analyst Perspective
- 3.3.2. Regulations & Standards
- 3.4. Market Dynamics
- 3.4.1. Market Driver Analysis
- 3.4.2. Market Restraint Analysis
- 3.4.3. Industry Opportunities
- 3.4.4. Industry Challenges
- 3.5. Business Environmental Tools Analysis: Membrane Separation Materials Market
- 3.5.1. Porter's Five Forces Analysis
- 3.5.1.1. Bargaining Power of Suppliers
- 3.5.1.2. Bargaining Power of Buyers
- 3.5.1.3. Threat of Substitution
- 3.5.1.4. Threat of New Entrants
- 3.5.1.5. Competitive Rivalry
- 3.5.2. PESTLE Analysis
- 3.5.2.1. Political Landscape
- 3.5.2.2. Economic Landscape
- 3.5.2.3. Social Landscape
- 3.5.2.4. Technology Landscape
- 3.5.2.5. Environmental Landscape
- 3.5.2.6. Legal Landscape
- 3.5.1. Porter's Five Forces Analysis
- 3.6. Market Disruption Analysis
Chapter 4. Membrane Separation Materials Market: Product Type Estimates & Trend Analysis
- 4.1. Key Takeaways
- 4.2. Product Type Movement Analysis & Market Share, 2024 & 2030
- 4.3. Global Membrane Separation Materials Market By Product Type, 2018 - 2030 (USD Million)
- 4.4. Ceramic
- 4.4.1. Membrane Separation Materials Market Estimates And Forecasts, by Ceramic 2018 - 2030 (USD Million)
- 4.5. Polymeric
- 4.5.1. Membrane Separation Materials Market Estimates And Forecasts, by Polymeric, 2018 - 2030 (USD Million)
- 4.6. Metallic
- 4.6.1. Membrane Separation Materials Market Estimates And Forecasts, by Metallic, 2018 - 2030 (USD Million)
- 4.7. Other Product Types
- 4.7.1. Membrane Separation Materials Market Estimates And Forecasts, by Other Product Types, 2018 - 2030 (USD Million)
Chapter 5. Membrane Separation Materials Market: End Use Estimates & Trend Analysis
- 5.1. Key Takeaways
- 5.2. End Use Movement Analysis & Market Share, 2024 & 2030
- 5.3. Global Membrane Separation Materials Market By End Use, 2018 - 2030 (USD Million)
- 5.4. Water & Wastewater Treatment
- 5.4.1. Membrane Separation Materials Market Estimates And Forecasts, by Water & Wastewater Treatment, 2018 - 2030 (USD Million)
- 5.5. Industry Processing
- 5.5.1. Membrane Separation Materials Market Estimates And Forecasts, by Industry Processing, 2018 - 2030 (USD Million)
- 5.6. Food & Beverage Processing
- 5.6.1. Membrane Separation Materials Market Estimates And Forecasts, by Food & Beverage Processing, 2018 - 2030 (USD Million)
- 5.7. Pharmaceutical & Medical
- 5.7.1. Membrane Separation Materials Market Estimates And Forecasts, by Pharmaceutical & Medical, 2018 - 2030 (USD Million)
- 5.8. Other End Uses
- 5.8.1. Membrane Separation Materials Market Estimates And Forecasts, by Other End Uses, 2018 - 2030 (USD Million)
Chapter 6. Membrane Separation Materials Market: Regional Estimates & Trend Analysis
- 6.1. Key Takeaways
- 6.2. Regional Market Share Analysis, 2024 & 2030
- 6.3. North America
- 6.3.1. North America Membrane Separation Materials Market Estimates And Forecasts, 2018 - 2030 (USD Million)
- 6.3.2. North America Membrane Separation Materials Market Estimates And Forecasts, By Product Type, 2018 - 2030 (USD Million)
- 6.3.3. North America Membrane Separation Materials Market Estimates And Forecasts, By End Use, 2018 - 2030 (USD Million)
- 6.3.4. U.S.
- 6.3.4.1. U.S. Membrane Separation Materials Market Estimates And Forecasts, 2018 - 2030 (USD Million)
- 6.3.4.2. U.S. Membrane Separation Materials Market Estimates And Forecasts, By Product Type, 2018 - 2030 (USD Million)
- 6.3.4.3. U.S. Membrane Separation Materials Market Estimates And Forecasts, By End Use, 2018 - 2030 (USD Million)
- 6.3.5. Canada
- 6.3.5.1. Canada Membrane Separation Materials Market Estimates And Forecasts, 2018 - 2030 (USD Million)
- 6.3.5.2. Canada Membrane Separation Materials Market Estimates And Forecasts, By Product Type, 2018 - 2030 (USD Million)
- 6.3.5.3. Canada Membrane Separation Materials Market Estimates And Forecasts, By End Use, 2018 - 2030 (USD Million)
- 6.3.6. Mexico
- 6.3.6.1. Mexico Membrane Separation Materials Market Estimates And Forecasts, 2018 - 2030 (USD Million)
- 6.3.6.2. Mexico Membrane Separation Materials Market Estimates And Forecasts, By Product Type, 2018 - 2030 (USD Million)
- 6.3.6.3. Mexico Membrane Separation Materials Market Estimates And Forecasts, By End Use, 2018 - 2030 (USD Million)
- 6.4. Europe
- 6.4.1. Europe Membrane Separation Materials Market Estimates And Forecasts, 2018 - 2030 (USD Million)
- 6.4.2. Europe Membrane Separation Materials Market Estimates And Forecasts, By Product Type, 2018 - 2030 (USD Million)
- 6.4.3. Europe Membrane Separation Materials Market Estimates And Forecasts, By End Use, 2018 - 2030 (USD Million)
- 6.4.4. Germany
- 6.4.4.1. Germany Membrane Separation Materials Market Estimates And Forecasts, 2018 - 2030 (USD Million)
- 6.4.4.2. Germany Membrane Separation Materials Market Estimates And Forecasts, By Product Type, 2018 - 2030 (USD Million)
- 6.4.4.3. Germany Membrane Separation Materials Market Estimates And Forecasts, By End Use, 2018 - 2030 (USD Million)
- 6.4.5. UK
- 6.4.5.1. UK Membrane Separation Materials Market Estimates And Forecasts, 2018 - 2030 (USD Million)
- 6.4.5.2. UK Membrane Separation Materials Market Estimates And Forecasts, By Product Type, 2018 - 2030 (USD Million)
- 6.4.5.3. UK Membrane Separation Materials Market Estimates And Forecasts, By End Use, 2018 - 2030 (USD Million)
- 6.4.6. France
- 6.4.6.1. France Membrane Separation Materials Market Estimates And Forecasts, 2018 - 2030 (USD Million)
- 6.4.6.2. France Membrane Separation Materials Market Estimates And Forecasts, By Product Type, 2018 - 2030 (USD Million)
- 6.4.6.3. France Membrane Separation Materials Market Estimates And Forecasts, By End Use, 2018 - 2030 (USD Million)
- 6.4.7. Italy
- 6.4.7.1. Italy Membrane Separation Materials Market Estimates And Forecasts, 2018 - 2030 (USD Million)
- 6.4.7.2. Italy Membrane Separation Materials Market Estimates And Forecasts, By Product Type, 2018 - 2030 (USD Million)
- 6.4.7.3. Italy Membrane Separation Materials Market Estimates And Forecasts, By End Use, 2018 - 2030 (USD Million)
- 6.4.8. Spain
- 6.4.8.1. Spain Membrane Separation Materials Market Estimates And Forecasts, 2018 - 2030 (USD Million)
- 6.4.8.2. Spain Membrane Separation Materials Market Estimates And Forecasts, By Product Type, 2018 - 2030 (USD Million)
- 6.4.8.3. Spain Membrane Separation Materials Market Estimates And Forecasts, By End Use, 2018 - 2030 (USD Million)
- 6.5. Asia Pacific
- 6.5.1. Asia Pacific Membrane Separation Materials Market Estimates And Forecasts, 2018 - 2030 (USD Million)
- 6.5.2. Asia Pacific Membrane Separation Materials Market Estimates And Forecasts, By Product Type, 2018 - 2030 (USD Million)
- 6.5.3. Asia Pacific Membrane Separation Materials Market Estimates And Forecasts, By End Use, 2018 - 2030 (USD Million)
- 6.5.4. China
- 6.5.4.1. China Membrane Separation Materials Market Estimates And Forecasts, 2018 - 2030 (USD Million)
- 6.5.4.2. China Membrane Separation Materials Market Estimates And Forecasts, By Product Type, 2018 - 2030 (USD Million)
- 6.5.4.3. China Membrane Separation Materials Market Estimates And Forecasts, By End Use, 2018 - 2030 (USD Million)
- 6.5.5. India
- 6.5.5.1. India Membrane Separation Materials Market Estimates And Forecasts, 2018 - 2030 (USD Million)
- 6.5.5.2. India Membrane Separation Materials Market Estimates And Forecasts, By Product Type, 2018 - 2030 (USD Million)
- 6.5.5.3. India Membrane Separation Materials Market Estimates And Forecasts, By End Use, 2018 - 2030 (USD Million)
- 6.5.6. Japan
- 6.5.6.1. Japan Membrane Separation Materials Market Estimates And Forecasts, 2018 - 2030 (USD Million)
- 6.5.6.2. Japan Membrane Separation Materials Market Estimates And Forecasts, By Product Type, 2018 - 2030 (USD Million)
- 6.5.6.3. Japan Membrane Separation Materials Market Estimates And Forecasts, By End Use, 2018 - 2030 (USD Million)
- 6.5.7. South Korea
- 6.5.7.1. South Korea Membrane Separation Materials Market Estimates And Forecasts, 2018 - 2030 (USD Million)
- 6.5.7.2. South Korea Membrane Separation Materials Market Estimates And Forecasts, By Product Type, 2018 - 2030 (USD Million)
- 6.5.7.3. South Korea Membrane Separation Materials Market Estimates And Forecasts, By End Use, 2018 - 2030 (USD Million)
- 6.6. Central & South America
- 6.6.1. Central & South America Membrane Separation Materials Market Estimates And Forecasts, 2018 - 2030 (USD Million)
- 6.6.2. Central & South America Membrane Separation Materials Market Estimates And Forecasts, By Product Type, 2018 - 2030 (USD Million)
- 6.6.3. Central & South America Membrane Separation Materials Market Estimates And Forecasts, By End Use, 2018 - 2030 (USD Million)
- 6.7. Middle East & Africa
- 6.7.1. Middle East & Africa Membrane Separation Materials Market Estimates And Forecasts, 2018 - 2030 (USD Million)
- 6.7.2. Middle East & Africa Membrane Separation Materials Market Estimates And Forecasts, By Product Type, 2018 - 2030 (USD Million)
- 6.7.3. Middle East & Africa Membrane Separation Materials Market Estimates And Forecasts, By End Use, 2018 - 2030 (USD Million)
Chapter 7. Supplier Intelligence
- 7.1. Kraljic Matrix
- 7.2. Engagement Model
- 7.3. Negotiation Strategies
- 7.4. Sourcing Best Practices
- 7.5. Vendor Selection Criteria
Chapter 8. Competitive Landscape
- 8.1. Key Players, their Recent Developments, and their Impact on Industry
- 8.2. Competition Categorization
- 8.3. Company Market Position Analysis
- 8.4. Company Heat Map Analysis
- 8.5. Strategy Mapping, 2024
- 8.6. Company Listing
- 8.6.1. BASF
- 8.6.1.1. Company Overview
- 8.6.1.2. Financial Performance
- 8.6.1.3. Application Benchmarking
- 8.6.1.4. Strategic Initiatives
- 8.6.2. Solvay
- 8.6.2.1. Company Overview
- 8.6.2.2. Financial Performance
- 8.6.2.3. Application Benchmarking
- 8.6.2.4. Strategic Initiatives
- 8.6.3. Arkema AG
- 8.6.3.1. Company Overview
- 8.6.3.2. Financial Performance
- 8.6.3.3. Application Benchmarking
- 8.6.3.4. Strategic Initiatives
- 8.6.4. The Chemours Company
- 8.6.4.1. Company Overview
- 8.6.4.2. Financial Performance
- 8.6.4.3. Application Benchmarking
- 8.6.4.4. Strategic Initiatives
- 8.6.5. DuPont
- 8.6.5.1. Company Overview
- 8.6.5.2. Financial Performance
- 8.6.5.3. Application Benchmarking
- 8.6.5.4. Strategic Initiatives
- 8.6.6. KUREHA CORPORATION
- 8.6.6.1. Company Overview
- 8.6.6.2. Financial Performance
- 8.6.6.3. Application Benchmarking
- 8.6.6.4. Strategic Initiatives
- 8.6.7. 3M
- 8.6.7.1. Company Overview
- 8.6.7.2. Financial Performance
- 8.6.7.3. Application Benchmarking
- 8.6.7.4. Strategic Initiatives
- 8.6.8. DAIKIN INDUSTRIES, Ltd
- 8.6.8.1. Company Overview
- 8.6.8.2. Financial Performance
- 8.6.8.3. Application Benchmarking
- 8.6.8.4. Strategic Initiatives
- 8.6.9. The Quadrant group of companies
- 8.6.9.1. Company Overview
- 8.6.9.2. Financial Performance
- 8.6.9.3. Application Benchmarking
- 8.6.9.4. Strategic Initiatives
- 8.6.10. Gujarat Fluorochemicals Ltd
- 8.6.10.1. Company Overview
- 8.6.10.2. Financial Performance
- 8.6.10.3. Application Benchmarking
- 8.6.10.4. Strategic Initiatives
- 8.6.1. BASF

