|
|
市場調査レポート
商品コード
1679390
一酸化炭素の市場規模、シェア、動向分析レポート:用途別、地域別、セグメント予測、2025年~2030年Carbon Monoxide Market Size, Share & Trends Analysis Report By Application (Chemical, Metal Fabrication, Electronics, Pharma & Biotechnology, Meat & Coloring Preservative), By Region (North America, Europe), And Segment Forecasts, 2025 - 2030 |
||||||
|
|||||||
カスタマイズ可能
|
|||||||

| 一酸化炭素の市場規模、シェア、動向分析レポート:用途別、地域別、セグメント予測、2025年~2030年 |
|
出版日: 2025年02月24日
発行: Grand View Research
ページ情報: 英文 80 Pages
納期: 2~10営業日
|

全表示
- 概要
- 図表
- 目次
一酸化炭素市場の成長と動向
Grand View Research, Incの最新レポートによると、世界の一酸化炭素市場規模は2030年までに69億7,000万米ドルに達すると予測され、2025~2030年のCAGRは4.3%で成長すると予測されています。
一酸化炭素市場は、一酸化炭素が主に金属抽出、化学生産、様々な工業プロセスにおける還元剤として使用され、冶金や医薬品などのセグメント全体の需要を牽引しているため、成長が見込まれています。
化学品製造における様々な用途のため、化学セグメントは一酸化炭素市場において極めて重要です。一酸化炭素は、アルデヒドを生成するアルケンのヒドロホルミル化や、多くの化学製品の主要な前駆体であるメタノールの合成などのプロセスにおいて不可欠です。さらに、一酸化炭素は、イソシアネートやポリウレタンの製造に不可欠な化合物であるホスゲンの製造にも使用されます。このことは、バルク化学品の製造や工業用途における一酸化炭素の重要性を浮き彫りにしています。
アジア太平洋の一酸化炭素市場は、特に金属加工や化学製造などの産業用途での消費の増加により、市場の最前線であり続けると予測されます。一酸化炭素は、メタノールやその他の化学品の製造を含む様々な化学プロセスにおいて重要な役割を果たしており、この地域の産業情勢における重要性をさらに高めています。
一酸化炭素市場の著名な参入企業には、Air Liquide、Linde plc、Air Products and Chemicals, Inc.、Celanese Corporation、Messer、MESA Specialty Gases & Equipment、Sipchem Company、Axcel Gases、Praxair Inc.、American Gas Productsなどがあります。
一酸化炭素市場レポートハイライト
- 用途別では、化学セグメントが2024年の収益シェア18.2%で市場を独占。化学セグメントは必須化合物を生産するため、一酸化炭素市場で重要な役割を果たしています。一酸化炭素は主に、アルデヒドを生成するためのヒドロホルミル化や、様々な化学品の前駆体として機能するメタノール合成に使用されます。さらに、一酸化炭素は、イソシアネートとポリウレタンの製造における主要成分であるホスゲンの製造にも使用され、バルク化学製品製造における重要性が強調されています。
- 地域別では、アジア太平洋が水酸化アルミニウム市場の支配的な地域であり、2024年の収益シェアは47.0%です。同地域は、特に金属加工や化学製造などの工業用途を原動力とした消費の増加により、市場を独占すると予測されています。産業用途では、一酸化炭素はメタノールや様々な化学品の生産などの化学プロセスで重要な役割を果たしており、この地域の産業景観における重要性を強化しています。
- 2023年5月、Air Productsはテキサス州に2つの一酸化炭素(CO)生産施設を新たに建設・操業する計画を発表しました。1つはラポート、もう1つはテキサス・シティで、合わせて1日当たり7,000万標準立方フィート(MMSCFD)以上のCOを生産します。ラポートの施設は2024年に稼働を開始し、30 MMSCFD以上をリオンデルバセル社に供給する予定であり、テキサスシティの施設は2026年に稼働を開始し、イーストマンケミカル社向けに40 MMSCFD以上を生産する予定です。これらの施設は、エアープロダクツのメキシコ湾岸COパイプライン・ネットワークと統合され、地域の顧客への供給信頼性を高めることになります。
目次
第1章 調査手法と範囲
第2章 エグゼクティブサマリー
第3章 市場の変数、動向、範囲
- 世界の一酸化炭素市場の展望
- バリューチェーン分析
- 原料の展望
- 製造業/派生商品の展望
- 流通チャネル分析
- 価格動向分析
- 価格に影響を与える要因
- 規制の枠組み
- 標準とコンプライアンス
- 市場力学
- 市場促進要因分析
- 市場抑制要因分析
- 市場課題分析
- 市場機会分析
- ポーターのファイブフォース分析
- 供給企業の交渉力
- 買い手の交渉力
- 代替の脅威
- 新規参入業者の脅威
- 競争企業間の敵対関係
- PESTLE分析
- 政治
- 経済
- 社会
- 誘導体
- 環境
- 法律
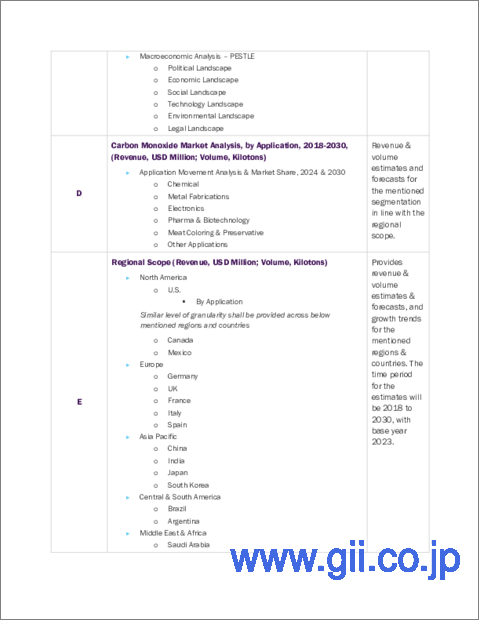
第4章 一酸化炭素市場:用途別、推定・動向分析
- 一酸化炭素市場:用途変動分析、2023年と2030年
- 化学品
- 金属加工
- エレクトロニクス
- 製薬・バイオテクノロジー
- 肉の着色料と保存料
- その他
第5章 一酸化炭素市場:地域別、推定・動向分析
- 地域分析、2023年と2030年
- 北米
- 用途別、2018~2030年
- 米国
- カナダ
- メキシコ
- 欧州
- 用途別、2018~2030年
- ドイツ
- 英国
- フランス
- イタリア
- スペイン
- アジア太平洋
- 用途別、2018~2030年
- 中国
- インド
- 日本
- 韓国
- ラテンアメリカ
- 用途別、2018~2030年
- ブラジル
- アルゼンチン
- 中東・アフリカ
- 用途別、2018~2030年
- サウジアラビア
- 南アフリカ
第6章 競合情勢
- 主要市場参入企業による最近の動向
- 企業分類
- 企業ヒートマップ分析
- 企業市場ポジショニング分析、2024年
- 戦略マッピング
- 企業プロファイル/上場企業
- Air Liquide
- Air Products and Chemicals, Inc.
- Celanese Corporation
- Messer
- Sipchem Company
- Praxair Inc.
- Linde plc
- MESA Specialty Gases & Equipment
- Axcel Gases
- Ganesh Benzoplast
List of Tables
- Table 1 Carbon Monoxide market estimates & forecasts, 2018 - 2030 (Kilotons) (USD Million)
- Table 2 Carbon Monoxide market estimates & forecasts, by chemical, 2018 - 2030 (Kilotons) (USD Million)
- Table 3 Carbon Monoxide market estimates & forecasts, by metal fabrication, 2018 - 2030 (Kilotons) (USD Million)
- Table 4 Carbon Monoxide market estimates & forecasts, by electronics, 2018 - 2030 (Kilotons) (USD Million)
- Table 5 Carbon Monoxide market estimates & forecasts, by pharma & biotechnology, 2018 - 2030 (Kilotons) (USD Million)
- Table 6 Carbon Monoxide market estimates & forecasts, by meat coloring & preservative, 2018 - 2030 (Kilotons) (USD Million)
- Table 7 Carbon Monoxide market estimates & forecasts, by other applications, 2018 - 2030 (Kilotons) (USD Million)
- Table 8 Carbon Monoxide market estimates & forecasts, 2018 - 2030 (USD Million)
- Table 9 Carbon Monoxide market estimates & forecasts by application, 2018 - 2030 (Kilotons)
- Table 10 Carbon Monoxide market estimates & forecasts by application, 2018 - 2030 (USD Million)
- Table 11 North America polyurethane Coatings market estimates & forecast, 2018 - 2030 (Kilotons) (USD Million)
- Table 12 North America carbon monoxide market estimates & forecasts by application, 2018 - 2030 (Kilotons)
- Table 13 North America carbon monoxide market estimates & forecasts by application, 2018 - 2030 (USD Million)
- Table 14 U.S. carbon monoxide market estimates & forecasts, 2018 - 2030 (Kilotons) (USD Million)
- Table 15 U.S. carbon monoxide market estimates & forecasts by application, 2018 - 2030 (Kilotons)
- Table 16 U.S. carbon monoxide market estimates & forecasts by application, 2018 - 2030 (USD Million)
- Table 17 Canada carbon monoxide market estimates & forecasts, 2018 - 2030 (Kilotons) (USD Million)
- Table 18 Canada carbon monoxide market estimates & forecasts by application, 2018 - 2030 (Kilotons)
- Table 19 Canada carbon monoxide market estimates & forecasts by application, 2018 - 2030 (USD Million)
- Table 20 Mexico carbon monoxide market estimates & forecasts, 2018 - 2030 (Kilotons) (USD Million)
- Table 21 Mexico carbon monoxide market estimates & forecasts by application, 2018 - 2030 (Kilotons)
- Table 22 Mexico carbon monoxide market estimates & forecasts by application, 2018 - 2030 (USD Million)
- Table 23 Europe carbon monoxide market estimates & forecasts, 2018 - 2030 (Kilotons) (USD Million)
- Table 24 Europe carbon monoxide market estimates & forecasts by application, 2018 - 2030 (Kilotons)
- Table 25 Europe carbon monoxide market estimates & forecasts by application, 2018 - 2030 (USD Million)
- Table 26 Germany carbon monoxide market estimates & forecasts, 2018 - 2030 (Kilotons) (USD Million)
- Table 27 Germany carbon monoxide market estimates & forecasts by application, 2018 - 2030 (Kilotons)
- Table 28 Germany carbon monoxide market estimates & forecasts by application, 2018 - 2030 (USD Million)
- Table 29 UK carbon monoxide market estimates & forecasts, 2018 - 2030 (Kilotons) (USD Million)
- Table 30 UK carbon monoxide market estimates & forecasts by application, 2018 - 2030 (Kilotons)
- Table 31 UK carbon monoxide market estimates & forecasts by application, 2018 - 2030 (USD Million)
- Table 32 France carbon monoxide market estimates & forecasts, 2018 - 2030 (Kilotons) (USD Million)
- Table 33 France carbon monoxide market estimates & forecasts by application, 2018 - 2030 (Kilotons)
- Table 34 France carbon monoxide market estimates & forecasts by application, 2018 - 2030 (USD Million)
- Table 35 Italy carbon monoxide market estimates & forecasts, 2018 - 2030 (Kilotons) (USD Million)
- Table 36 Italy carbon monoxide market estimates & forecasts by application, 2018 - 2030 (Kilotons)
- Table 37 Italy carbon monoxide market estimates & forecasts by application, 2018 - 2030 (USD Million)
- Table 38 Spain carbon monoxide market estimates & forecasts, 2018 - 2030 (Kilotons) (USD Million)
- Table 39 Spain carbon monoxide market estimates & forecasts by application, 2018 - 2030 (Kilotons)
- Table 40 Spain carbon monoxide market estimates & forecasts by application, 2018 - 2030 (USD Million)
- Table 41 Asia pacific carbon monoxide market estimates & forecasts, 2018 - 2030 (Kilotons) (USD Million)
- Table 42 Asia pacific carbon monoxide market estimates & forecasts by application, 2018 - 2030 (Kilotons)
- Table 43 Asia pacific carbon monoxide market estimates & forecasts by application, 2018 - 2030 (USD Million)
- Table 44 China carbon monoxide market estimates & forecast, 2018 - 2030 (Kilotons) (USD Million)
- Table 45 China carbon monoxide market estimates & forecasts by application, 2018 - 2030 (Kilotons)
- Table 46 China carbon monoxide market estimates & forecasts by application, 2018 - 2030 (USD Million)
- Table 47 India carbon monoxide market estimates & forecast, 2018 - 2030 (Kilotons) (USD Million)
- Table 48 India carbon monoxide market estimates & forecasts by application, 2018 - 2030 (Kilotons)
- Table 49 India carbon monoxide market estimates & forecasts by application, 2018 - 2030 (USD Million)
- Table 50 Japan carbon monoxide market estimates & forecast, 2018 - 2030 (Kilotons) (USD Million)
- Table 51 Japan carbon monoxide market estimates & forecasts by application, 2018 - 2030 (Kilotons)
- Table 52 Japan carbon monoxide market estimates & forecasts by application, 2018 - 2030 (USD Million)
- Table 53 South Korea carbon monoxide market estimates & forecast, 2018 - 2030 (Kilotons) (USD Million)
- Table 54 South Korea carbon monoxide market estimates & forecasts by application, 2018 - 2030 (Kilotons)
- Table 55 South Korea carbon monoxide market estimates & forecasts by application, 2018 - 2030 (USD Million)
- Table 56 Latin America carbon monoxide market estimates & forecasts, 2018 - 2030 (Kilotons) (USD Million)
- Table 57 Latin America carbon monoxide market estimates & forecasts by application, 2018 - 2030 (Kilotons)
- Table 58 Latin America carbon monoxide market estimates & forecasts by application, 2018 - 2030 (USD Million)
- Table 59 Brazil carbon monoxide market estimates & forecast, 2018 - 2030 (Kilotons) (USD Million)
- Table 60 Brazil carbon monoxide market estimates & forecasts by application, 2018 - 2030 (Kilotons)
- Table 61 Brazil carbon monoxide market estimates & forecasts by application, 2018 - 2030 (USD Million)
- Table 62 Argentina carbon monoxide market estimates & forecasts, 2018 - 2030 (Kilotons) (USD Million)
- Table 63 Argentina carbon monoxide market estimates & forecasts by application, 2018 - 2030 (Kilotons)
- Table 64 Argentina carbon monoxide market estimates & forecasts by application, 2018 - 2030 (USD Million)
- Table 65 Middle East & Africa carbon monoxide market estimates & forecasts, 2018 - 2030 (Kilotons) (USD Million)
- Table 66 Middle East & Africa carbon monoxide market estimates & forecasts by application, 2018 - 2030 (Kilotons)
- Table 67 Middle East & Africa carbon monoxide market estimates & forecasts by application, 2018 - 2030 (USD Million)
- Table 68 Saudi Arabia carbon monoxide market estimates & forecasts, 2018 - 2030 (Kilotons) (USD Million)
- Table 69 Saudi Arabia carbon monoxide market estimates & forecasts by application, 2018 - 2030 (Kilotons)
- Table 70 Saudi Arabia carbon monoxide market estimates & forecasts by application, 2018 - 2030 (USD Million)
- Table 71 South Africa carbon monoxide market estimates & forecasts, 2018 - 2030 (Kilotons) (USD Million)
- Table 72 South Africa carbon monoxide market estimates & forecasts by application, 2018 - 2030 (Kilotons)
- Table 73 South Africa carbon monoxide market estimates & forecasts by application, 2018 - 2030 (USD Million)
List of Figures
- Fig. 1 Market segmentation
- Fig. 2 Information procurement
- Fig. 3 Data analysis models
- Fig. 4 Market formulation and validation
- Fig. 5 Data validating & publishing
- Fig. 6 Market snapshot
- Fig. 7 Segmental outlook - Application & Derivative
- Fig. 8 Competitive Outlook
- Fig. 9 Carbon Monoxide market outlook, 2018 - 2030 (Kilotons) (USD Million)
- Fig. 10 Value chain analysis
- Fig. 11 Market dynamics
- Fig. 12 Porter's Analysis
- Fig. 13 PESTEL Analysis
- Fig. 14 Carbon Monoxide market, by application: Key takeaways
- Fig. 15 Carbon Monoxide market, by application: Market share, 2023 & 2030
- Fig. 16 Carbon Monoxide market: Regional analysis, 2023
- Fig. 17 Carbon Monoxide market, by region: Key takeaways
Carbon Monoxide Market Growth & Trends:
The global carbon monoxide market size is anticipated to reach USD 6.97 billion by 2030 and is anticipated to grow at a CAGR of 4.3% from 2025 to 2030, according to a new report by Grand View Research, Inc. The carbon monoxide market is expected to grow as carbon monoxide is primarily used in metal extraction, chemical production, and as a reducing agent in various industrial processes, which drives demand across sectors such as metallurgy and pharmaceuticals.
Chemical segments are crucial in the carbon monoxide market due to their various applications in producing chemicals. Carbon monoxide is essential in processes such as the hydroformylation of alkenes, which produces aldehydes, and in the synthesis of methanol, a key precursor for many chemical products. Additionally, carbon monoxide is used in producing phosgene, a compound vital for manufacturing isocyanates and polyurethanes. This highlights its significance in bulk chemicals manufacturing and industrial applications.
The Asia Pacific carbon monoxide market is projected to remain at the forefront of the market due to growing consumption, particularly in industrial applications such as metal fabrication and chemical manufacturing. Carbon monoxide plays a vital role in various chemical processes, including producing methanol and other chemicals, further reinforcing its importance in the region's industrial landscape.
Some of the prominent players in the carbon monoxide market include Air Liquide, Linde plc, Air Products and Chemicals, Inc., Celanese Corporation, Messer, MESA Specialty Gases & Equipment, Sipchem Company, Axcel Gases, Praxair Inc., and American Gas Products
Carbon Monoxide Market Report Highlights:
- Based on application, the chemical segment dominated the market with a revenue share of 18.2% in 2024. The chemical segment plays a crucial role in the carbon monoxide market because it produces essential compounds. Carbon monoxide is primarily used in hydroformylation to create aldehydes and in methanol synthesis, which serves as a precursor for various chemicals. Additionally, carbon monoxide is used in producing phosgene, a key component in manufacturing isocyanates and polyurethanes, underscoring its significance in bulk chemical production.
- Based on region, Asia Pacific is the dominant region for the aluminum hydroxide market, with a revenue share of 47.0% in 2024. The region is anticipated to dominate the market due to rising consumption fueled by industrial applications, especially in metal fabrication and chemical manufacturing. In industrial applications, carbon monoxide plays a vital role in chemical processes, such as producing methanol and various other chemicals, reinforcing its importance in the region's industrial landscape.
- In May 2023, Air Products announced its plans to construct and operate two new carbon monoxide (CO) production facilities in Texas, one in La Porte and the other in Texas City, collectively producing over 70 million standard cubic feet per day (MMSCFD) of CO. The La Porte facility, set to be operational in 2024, will supply more than 30 MMSCFD to LyondellBasell, while the Texas City facility will come online in 2026, producing over 40 MMSCFD for Eastman Chemical Company. These facilities will integrate with Air Products' Gulf Coast CO pipeline network, enhancing supply reliability for regional customers.
Table of Contents
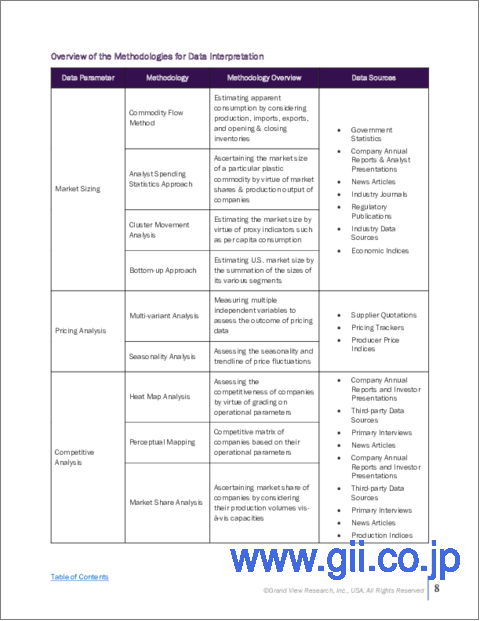
Chapter 1. Methodology and Scope
- 1.1. Market Segmentation & Scope
- 1.2. Market Definition
- 1.3. Information Procurement
- 1.3.1. Information Analysis
- 1.3.2. Market Formulation & Data Visualization
- 1.3.3. Data Validation & Publishing
- 1.4. Research Scope and Assumptions
- 1.4.1. List of Data Sources
Chapter 2. Executive Summary
- 2.1. Market Snapshot
- 2.2. Segmental Outlook
- 2.3. Competitive Outlook
Chapter 3. Market Variables, Trends, and Scope
- 3.1. Global Carbon Monoxide Market Outlook
- 3.2. Value Chain Analysis
- 3.2.1. Raw Material Outlook
- 3.2.2. Manufacturing/Derivative Outlook
- 3.2.3. Sales Channel Analysis
- 3.3. Price Trend Analysis
- 3.3.1. Factors Influencing Prices
- 3.4. Regulatory Framework
- 3.4.1. Standards & Compliances
- 3.5. Market Dynamics
- 3.5.1. Market Driver Analysis
- 3.5.2. Market Restraint Analysis
- 3.5.3. Market Challenges Analysis
- 3.5.4. Market Opportunity Analysis
- 3.6. Porter's Five Forces Analysis
- 3.6.1. Bargaining Power of Suppliers
- 3.6.2. Bargaining Power of Buyers
- 3.6.3. Threat of Substitution
- 3.6.4. Threat of New Entrants
- 3.6.5. Competitive Rivalry
- 3.7. PESTLE Analysis
- 3.7.1. Political
- 3.7.2. Economic
- 3.7.3. Social Landscape
- 3.7.4. Derivative
- 3.7.5. Environmental
- 3.7.6. Legal
Chapter 4. Carbon Monoxide Market: Application Estimates & Trend Analysis
- 4.1. Carbon Monoxide Market: Application Movement Analysis, 2023 & 2030
- 4.2. Chemical
- 4.2.1. Market estimates and forecasts, 2018 - 2030 (Kilotons) (USD Million)
- 4.3. Metal Fabrication
- 4.3.1. Market estimates and forecasts, 2018 - 2030 (Kilotons) (USD Million)
- 4.4. Electronics
- 4.4.1. Market estimates and forecasts, 2018 - 2030 (Kilotons) (USD Million)
- 4.5. Pharma & Biotechnology
- 4.5.1. Market estimates and forecasts, 2018 - 2030 (Kilotons) (USD Million)
- 4.6. Meat Coloring & Preservative
- 4.6.1. Market estimates and forecasts, 2018 - 2030 (Kilotons) (USD Million)
- 4.7. Other Applications
- 4.7.1. Market estimates and forecasts, 2018 - 2030 (Kilotons) (USD Million)
Chapter 5. Carbon Monoxide Market: Regional Estimates & Trend Analysis
- 5.1. Regional Analysis, 2023 & 2030
- 5.2. North America
- 5.2.1. Market estimates and forecasts, 2018 - 2030 (Kilotons) (USD Million)
- 5.2.2. Market estimates and forecasts, by application, 2018 - 2030 (Kilotons) (USD Million)
- 5.2.3. U.S.
- 5.2.3.1. Market estimates and forecasts, 2018 - 2030 (Kilotons) (USD Million)
- 5.2.3.2. Market estimates and forecasts, by application, 2018 - 2030 (Kilotons) (USD Million)
- 5.2.4. Canada
- 5.2.4.1. Market estimates and forecasts, 2018 - 2030 (Kilotons) (USD Million)
- 5.2.4.2. Market estimates and forecasts, by application, 2018 - 2030 (Kilotons) (USD Million)
- 5.2.5. Mexico
- 5.2.5.1. Market estimates and forecasts, 2018 - 2030 (Kilotons) (USD Million)
- 5.2.5.2. Market estimates and forecasts, by application, 2018 - 2030 (Kilotons) (USD Million)
- 5.3. Europe
- 5.3.1. Market estimates and forecasts, 2018 - 2030 (Kilotons) (USD Million)
- 5.3.2. Market estimates and forecasts, by application, 2018 - 2030 (Kilotons) (USD Million)
- 5.3.3. Germany
- 5.3.3.1. Market estimates and forecasts, 2018 - 2030 (Kilotons) (USD Million)
- 5.3.3.2. Market estimates and forecasts, by application, 2018 - 2030 (Kilotons) (USD Million)
- 5.3.4. UK
- 5.3.4.1. Market estimates and forecasts, 2018 - 2030 (Kilotons) (USD Million)
- 5.3.4.2. Market estimates and forecasts, by application, 2018 - 2030 (Kilotons) (USD Million)
- 5.3.5. France
- 5.3.5.1. Market estimates and forecasts, 2018 - 2030 (Kilotons) (USD Million)
- 5.3.5.2. Market estimates and forecasts, by application, 2018 - 2030 (Kilotons) (USD Million)
- 5.3.6. Italy
- 5.3.6.1. Market estimates and forecasts, 2018 - 2030 (Kilotons) (USD Million)
- 5.3.6.2. Market estimates and forecasts, by application, 2018 - 2030 (Kilotons) (USD Million)
- 5.3.7. Spain
- 5.3.7.1. Market estimates and forecasts, 2018 - 2030 (Kilotons) (USD Million)
- 5.3.7.2. Market estimates and forecasts, by application, 2018 - 2030 (Kilotons) (USD Million)
- 5.4. Asia Pacific
- 5.4.1. Market estimates and forecasts, 2018 - 2030 (Kilotons) (USD Million)
- 5.4.2. Market estimates and forecasts, by application, 2018 - 2030 (Kilotons) (USD Million)
- 5.4.3. China
- 5.4.3.1. Market estimates and forecasts, 2018 - 2030 (Kilotons) (USD Million)
- 5.4.3.2. Market estimates and forecasts, by application, 2018 - 2030 (Kilotons) (USD Million)
- 5.4.4. India
- 5.4.4.1. Market estimates and forecasts, 2018 - 2030 (Kilotons) (USD Million)
- 5.4.4.2. Market estimates and forecasts, by application, 2018 - 2030 (Kilotons) (USD Million)
- 5.4.5. Japan
- 5.4.5.1. Market estimates and forecasts, 2018 - 2030 (Kilotons) (USD Million)
- 5.4.5.2. Market estimates and forecasts, by application, 2018 - 2030 (Kilotons) (USD Million)
- 5.4.6. South Korea
- 5.4.6.1. Market estimates and forecasts, 2018 - 2030 (Kilotons) (USD Million)
- 5.4.6.2. Market estimates and forecasts, by application, 2018 - 2030 (Kilotons) (USD Million)
- 5.5. Latin America
- 5.5.1. Market estimates and forecasts, 2018 - 2030 (Kilotons) (USD Million)
- 5.5.2. Market estimates and forecasts, by application, 2018 - 2030 (Kilotons) (USD Million)
- 5.5.3. Brazil
- 5.5.3.1. Market estimates and forecasts, 2018 - 2030 (Kilotons) (USD Million)
- 5.5.3.2. Market estimates and forecasts, by application, 2018 - 2030 (Kilotons) (USD Million)
- 5.5.4. Argentina
- 5.5.4.1. Market estimates and forecasts, 2018 - 2030 (Kilotons) (USD Million)
- 5.5.4.2. Market estimates and forecasts, by application, 2018 - 2030 (Kilotons) (USD Million)
- 5.6. Middle East & Africa
- 5.6.1. Market estimates and forecasts, 2018 - 2030 (Kilotons) (USD Million)
- 5.6.2. Market estimates and forecasts, by application, 2018 - 2030 (Kilotons) (USD Million)
- 5.6.3. Saudi Arabia
- 5.6.3.1. Market estimates and forecasts, 2018 - 2030 (Kilotons) (USD Million)
- 5.6.3.2. Market estimates and forecasts, by application, 2018 - 2030 (Kilotons) (USD Million)
- 5.6.4. South Africa
- 5.6.4.1. Market estimates and forecasts, 2018 - 2030 (Kilotons) (USD Million)
- 5.6.4.2. Market estimates and forecasts, by application, 2018 - 2030 (Kilotons) (USD Million)
Chapter 6. Competitive Landscape
- 6.1. Recent Developments by Key Market Participants
- 6.2. Company Categorization
- 6.3. Company Heat Map Analysis
- 6.4. Company Market Positioning Analysis, 2024
- 6.5. Strategy Mapping
- 6.6. Company Profiles/Listing
- 6.6.1. Air Liquide
- 6.6.1.1. Company Overview
- 6.6.1.2. Financial Performance
- 6.6.1.3. Derivative Benchmarking
- 6.6.2. Air Products and Chemicals, Inc.
- 6.6.2.1. Company Overview
- 6.6.2.2. Financial Performance
- 6.6.2.3. Derivative Benchmarking
- 6.6.3. Celanese Corporation
- 6.6.3.1. Company Overview
- 6.6.3.2. Financial Performance
- 6.6.3.3. Derivative Benchmarking
- 6.6.4. Messer
- 6.6.4.1. Company Overview
- 6.6.4.2. Financial Performance
- 6.6.4.3. Derivative Benchmarking
- 6.6.5. Sipchem Company
- 6.6.5.1. Company Overview
- 6.6.5.2. Financial Performance
- 6.6.5.3. Derivative Benchmarking
- 6.6.6. Praxair Inc.
- 6.6.6.1. Company Overview
- 6.6.6.2. Financial Performance
- 6.6.6.3. Derivative Benchmarking
- 6.6.7. Linde plc
- 6.6.7.1. Company Overview
- 6.6.7.2. Financial Performance
- 6.6.7.3. Derivative Benchmarking
- 6.6.8. MESA Specialty Gases & Equipment
- 6.6.8.1. Company Overview
- 6.6.8.2. Financial Performance
- 6.6.8.3. Derivative Benchmarking
- 6.6.9. Axcel Gases
- 6.6.9.1. Company Overview
- 6.6.9.2. Financial Performance
- 6.6.9.3. Derivative Benchmarking
- 6.6.10. Ganesh Benzoplast
- 6.6.10.1. Company Overview
- 6.6.10.2. Financial Performance
- 6.6.10.3. Derivative Benchmarking
- 6.6.1. Air Liquide
