|
|
市場調査レポート
商品コード
1654301
クロロプレンゴムの世界市場:市場規模・シェア・動向分析 (用途別・地域別)、セグメント別予測 (2025年~2030年)Chloroprene Rubber Market Size, Share & Trends Analysis Report By Application (Textile, Automotive, Electrical & Electronics, Construction), By Region (North America, Europe, Asia Pacific, Latin America, MEA), And Forecasts, 2025 - 2030 |
||||||
カスタマイズ可能
|
|||||||
| クロロプレンゴムの世界市場:市場規模・シェア・動向分析 (用途別・地域別)、セグメント別予測 (2025年~2030年) |
|
出版日: 2025年01月20日
発行: Grand View Research
ページ情報: 英文 50 Pages
納期: 2~10営業日
|
全表示
- 概要
- 図表
- 目次
クロロプレンゴム市場の成長と動向:
Grand View Research, Inc.の新しいレポートによると、世界のクロロプレンゴム市場規模は2030年までに15億8,000万米ドルに達する見込みです。
市場は2025年から2030年にかけてCAGR 6.0%で成長する見込みです。自動車、電気・電子、建設、繊維産業におけるクロロプレンゴムの採用増加が、予測期間中の市場成長を促進すると予測されています。クロロプレンゴムは、電気自動車 (EV) 需要の高まりにより、タイヤサイドウォール、自動車トリム、ガスケット、関連製品に広く使用されています。
電力需要の高まりは、送電用電気ケーブルの需要を促進すると予想されます。このため、ケーブル・ジャケットの製品需要が高まることが予想されます。世界中のインフラプロジェクトの開発に焦点を当てた建設部門における民間および公共投資の増加は、建設用途の製品需要にとって引き続き重要です。同製品は、建設業界から生じる需要により、ゴムパッド製品の製造において幅広い応用範囲を持っています。
市場の主要企業は、最終用途産業向けのクロロプレンの拡大と開発に投資しています。例えば、2021年4月、ARLANXEO社はインド市場にARLANXEO India Private Limitedを設立し、医薬品、タイヤ、自動車、最終用途製品など急速に拡大する産業のニーズに対応するため、インド市場での地位を強化しています。
中国、日本、インド、韓国、タイなどの国々における工業製品や化学品の需要は、これらの製品に使用されるクロロプレンゴムの消費に影響を与えると予想されます。多くのエラストマー製造業者は、既存の燻製ゴム抑制技術に代わるクロロプレンゴム製造用の加硫プロセスを開発するための研究開発活動を行っています。加硫プロセスが提供する主な利点の1つは、吸収特性の改善です。これにより、クロロプレンゴムは化学プラントの保護ライニング製造に適した材料として位置づけられるようになりました。
クロロプレンゴム市場:分析概要
- 自動車産業が世界のクロロプレンゴム産業を支配し、2024年には37.1%の最大収益シェアを占めました。
- 建設産業はその耐久性と耐候性により、2025年から2030年にかけてCAGR 6.4%の成長が見込まれており、シール、防水膜、橋梁支承など様々な用途に適しています。
- アジア太平洋のクロロプレンゴム市場は世界市場を独占し、2024年には54.8%の最大収益シェアを占めました。
- 北米のクロロプレンゴム市場は、自動車産業と建設産業からの需要増加により、予測期間中に大きく成長する見込みです。
- 米国のクロロプレンゴム市場は、主に自動車と建設分野からの需要増加により、北米市場の中で2024年に最大の収益シェアを占めました。
目次
第1章 分析方法・範囲
第2章 エグゼクティブサマリー
第3章 クロロプレンゴム市場:変動要因・傾向・範囲
- 世界のクロロプレンゴム市場の見通し
- 業界のバリューチェーン分析
- 平均価格動向の分析
- 需給ギャップ分析 (2024年)
- 規制の枠組み
- 市場力学
- 市場促進要因の分析
- 市場抑制要因の分析
- 業界の課題
- ポーターのファイブフォース分析
- サプライヤーの力
- 買い手の力
- 代替の脅威
- 新規参入からの脅威
- 競争企業間の敵対関係
- PESTEL分析
- 政治的要因
- 経済的要因
- 社会的要因
- 技術的要因
- 環境的要因
- 法的要因
第4章 クロロプレンゴム市場:用途別の展望・推定・予測
- クロロプレンゴム市場:変動分析、用途別 (2024年・2030年)
- 自動車
- 電気・電子
- 工事
- 繊維
- その他
第5章 クロロプレンゴム市場:地域別の展望・推定・予測
- 地域スナップショット
- クロロプレンゴム市場:変動分析、地域別 (2024年・2030年)
- 北米
- 市場推計・予測 (2018~2030年)
- 用途別 (2018~2030年)
- 米国
- 欧州
- 市場推計・予測 (2018~2030年)
- 用途別 (2018~2030年)
- ドイツ
- アジア太平洋
- 市場推計・予測 (2018~2030年)
- 用途別 (2018~2030年)
- 中国
- 日本
- インド
- ラテンアメリカ
- 市場推計・予測 (2018~2030年)
- 用途別 (2018~2030年)
- 中東・アフリカ
- 市場推計・予測 (2018~2030年)
- 用途別 (2018~2030年)
第6章 競合情勢
- 最新動向と影響分析:主な市場参入企業別
- ベンダー情勢
- 企業分類
- 主要な流通業者・チャネルパートナーの一覧
- 潜在的顧客/エンドユーザーの一覧
- 競争のダイナミクス
- 競合ベンチマーキング
- 戦略マッピング
- ヒートマップ分析
- 企業プロファイル/上場企業
- DuPont Performance Elastomers
- Showa Denko KK
- Denka Group
- Shanxi Synthetic Rubber Group Co. Ltd.
- Chongqing Longevity Salt and Chemical Co. Ltd.
- Lanxess AG
- Tosoh Corporation
- Nairit Plant CJSC
- Zenith Industrial Rubber Products Pvt. Ltd.
- Asahi Kasei Chemicals Corporation
- Dow Chemical Company.
- ARLANXEO
- SEDO Chemicals Neoprene GmbH
- Qingdao Nova Rubber
List of Tables
- Table 1 List of Abbreviations
- Table 2 Chloroprene Rubber Market Estimates and Forecasts, By Application, 2018 - 2030 (Kilotons) (USD Million)
- Table 3 Chloroprene Rubber Market Estimates and Forecasts, By Region, 2018 - 2030 (Kilotons) (USD Million)
- Table 4 North America Chloroprene Rubber Market Estimates and Forecasts, By Country, 2018 - 2030 (Kilotons) (USD Million)
- Table 5 North America Chloroprene Rubber Market Estimates and Forecasts, By Application, 2018 - 2030 (Kilotons) (USD Million)
- Table 6 U.S Chloroprene Rubber Market Estimates and Forecasts, By Application, 2018 - 2030 (Kilotons) (USD Million)
- Table 7 Europe Chloroprene Rubber Market Estimates and Forecasts, By Country, 2018 - 2030 (Kilotons) (USD Million)
- Table 8 Europe Chloroprene Rubber Market Estimates and Forecasts, By Application, 2018 - 2030 (Kilotons) (USD Million)
- Table 9 Germany Chloroprene Rubber Market Estimates and Forecasts, By Application, 2018 - 2030 (Kilotons) (USD Million)
- Table 10 Asia Pacific Chloroprene Rubber Market Estimates and Forecasts, By Country, 2018 - 2030 (Kilotons) (USD Million)
- Table 11 Asia Pacific Chloroprene Rubber Market Estimates and Forecasts, By Application, 2018 - 2030 (Kilotons) (USD Million)
- Table 12 China Chloroprene Rubber Market Estimates and Forecasts, By Application, 2018 - 2030 (Kilotons) (USD Million)
- Table 13 Japan Chloroprene Rubber Market Estimates and Forecasts, By Application, 2018 - 2030 (Kilotons) (USD Million)
- Table 14 India Chloroprene Rubber Market Estimates and Forecasts, By Application, 2018 - 2030 (Kilotons) (USD Million)
- Table 15 Latin America Chloroprene Rubber Market Estimates and Forecasts, By Country, 2018 - 2030 (Kilotons) (USD Million)
- Table 16 Latin America Chloroprene Rubber Market Estimates and Forecasts, By Application, 2018 - 2030 (Kilotons) (USD Million)
- Table 17 Middle East & Africa Chloroprene Rubber Market Estimates and Forecasts, By Country, 2018 - 2030 (Kilotons) (USD Million)
- Table 18 Middle East & Africa Chloroprene Rubber Market Estimates and Forecasts, By Application, 2018 - 2030 (Kilotons) (USD Million)
List of Figures
- Fig. 1 Market Segmentation
- Fig. 2 Information Procurement
- Fig. 3 Data Analysis Models
- Fig. 4 Market Formulation and Validation
- Fig. 5 Market Snapshot
- Fig. 6 Segmental Outlook- Application, and Region
- Fig. 7 Competitive Outlook
- Fig. 8 Value Chain Analysis
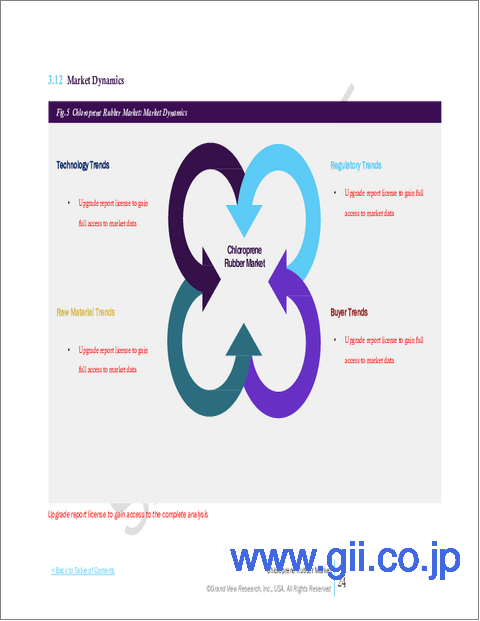
- Fig. 9 Market Dynamics
- Fig. 10 Porter's Analysis
- Fig. 11 PESTEL analysis
- Fig. 12 Chloroprene Rubber Market, By Application: Key Takeaways
- Fig. 13 Chloroprene Rubber Market, By Application: Market Share, 2024 & 2030
- Fig. 14 Automotive Market, 2018 - 2030 (Kilotons) (USD Million)
- Fig. 15 Electrical & Electronics Market, 2018 - 2030 (Kilotons) (USD Million)
- Fig. 16 Construction Market, 2018 - 2030 (Kilotons) (USD Million)
- Fig. 17 Textile Market, 2018 - 2030 (Kilotons) (USD Million)
- Fig. 18 Others Market, 2018 - 2030 (Kilotons) (USD Million)
- Fig. 19 Chloroprene Rubber Market, By Region: Key Takeaways
- Fig. 20 Chloroprene Rubber Market, By Region: Market Share, 2024 & 2030
- Fig. 21 North America Chloroprene Rubber Market, 2018 - 2030 (Kilotons) (USD Million)
- Fig. 22 U.S Chloroprene Rubber Market, 2018 - 2030 (Kilotons) (USD Million)
- Fig. 23 Europe Chloroprene Rubber Market, 2018 - 2030 (Kilotons) (USD Million)
- Fig. 24 Germany Chloroprene Rubber Market, 2018 - 2030 (Kilotons) (USD Million)
- Fig. 25 Asia Pacific Chloroprene Rubber Market, 2018 - 2030 (Kilotons) (USD Million)
- Fig. 26 China Chloroprene Rubber Market, 2018 - 2030 (Kilotons) (USD Million)
- Fig. 27 Japan Chloroprene Rubber Market, 2018 - 2030 (Kilotons) (USD Million)
- Fig. 28 India Chloroprene Rubber Market, 2018 - 2030 (Kilotons) (USD Million)
- Fig. 29 Latin America Chloroprene Rubber Market, 2018 - 2030 (Kilotons) (USD Million)
- Fig. 30 Middle East and Africa Chloroprene Rubber Market, 2018 - 2030 (Kilotons) (USD Million)
Chloroprene Rubber Market Growth & Trends:
The global chloroprene rubber market size is expected to reach USD 1.58 billion by 2030, according to a new report by Grand View Research, Inc. The market is expected to grow at a CAGR of 6.0% from 2025 to 2030. Increasing adoption of chloroprene rubber in the automotive, electrical & electronics, construction, and textile industries is projected to fuel the market growth during the forecast period. It is widely used in tire sidewalls, automotive trims, gaskets, and related products owing to the rising demand for Electric Vehicles (EVs).
The growing requirement for electrical power is expected to drive the demand for electric cables for power transmission. This is expected to drive the product demand in cable jackets. The rising private & public investments in the construction sector focusing on the development of infrastructure projects across the globe remain critical to the product demand in construction applications. The product has a wide scope of application in the manufacture of rubber pads products due to the demand arising from the construction industry.
Major key players in the market are investing in expanding and developing chloroprene for end-use industries. For instance, in April 2021, ARLANXEO established ARLANXEO India Private Limited in India to strengthen its position in the Indian market to meet the needs of quickly expanding industries, such as pharmaceuticals, tires, automotive, and end-user products.
The demand for industrial products and chemicals in countries such as China, Japan, India, South Korea, and Thailand is expected to impact the consumption of chloroprene rubber used in these products. Many elastomer manufacturers are carrying out research and development activities to develop a vulcanization process for manufacturing chloroprene rubber to replace the existing smoked rubber suppression technique. One of the main advantages offered by the vulcanization process is the improvement in absorbent properties. This has helped position chloroprene rubber as a suitable material for manufacturing protective lining in chemical plants.
Chloroprene Rubber Market Report Highlights:
- The automotive sector dominated the global chloroprene rubber industry and accounted for the largest revenue share of 37.1% in 2024.
- The construction industry is expected to grow at a CAGR of 6.4% from 2025 to 2030, owing to its durability and weather resistance, making it suitable for a range of applications including seals, waterproof membranes, and bridge bearings.
- Asia Pacific chloroprene rubber market dominated the global market and accounted for the largest revenue share of 54.8% in 2024.
- The North America chloroprene rubber market is expected to grow significantly over the forecast period, owing to increasing demand from automotive and construction industries.
- The chloroprene rubber market in the U.S. held the largest revenue share in 2024 within the North American market, primarily driven by the rising demand from the automotive and construction sectors.
Table of Contents
Chapter 1. Methodology and Scope
- 1.1. Market Segmentation & Scope
- 1.2. Market Definition
- 1.3. Information Procurement
- 1.3.1. Purchased Database
- 1.3.2. GVR's Internal Database
- 1.3.3. Secondary Sources & Third-Party Perspectives
- 1.3.4. Primary Research
- 1.4. Information Analysis
- 1.4.1. Data Analysis Models
- 1.5. Market Formulation & Data Visualization
- 1.6. Data Validation & Publishing
Chapter 2. Executive Summary
- 2.1. Market Insights
- 2.2. Segmental Outlook
- 2.3. Competitive Outlook
Chapter 3. Chloroprene Rubber Market Variables, Trends & Scope
- 3.1. Global Chloroprene Rubber Market Outlook
- 3.2. Industry Value Chain Analysis
- 3.3. Average Price Trend Analysis
- 3.4. Supply-Demand Gap Analysis, 2024
- 3.5. Regulatory Framework
- 3.6. Market Dynamics
- 3.6.1. Market Driver Analysis
- 3.6.2. Market Restraint Analysis
- 3.6.3. Industry Challenges
- 3.7. Porter's Five Forces Analysis
- 3.7.1. Supplier Power
- 3.7.2. Buyer Power
- 3.7.3. Substitution Threat
- 3.7.4. Threat from New Entrant
- 3.7.5. Competitive Rivalry
- 3.8. PESTEL Analysis
- 3.8.1. Political Landscape
- 3.8.2. Economic Landscape
- 3.8.3. Social Landscape
- 3.8.4. Technological Landscape
- 3.8.5. Environmental Landscape
- 3.8.6. Legal Landscape
Chapter 4. Chloroprene Rubber Market: Application Outlook Estimates & Forecasts
- 4.1. Chloroprene Rubber Market: Application Movement Analysis, 2024 & 2030
- 4.1.1. Automotive
- 4.1.1.1. Market Estimates and Forecast, 2018 - 2030 (Kilotons) (USD Million)
- 4.1.2. Electrical & Electronics
- 4.1.2.1. Market Estimates and Forecast, 2018 - 2030 (Kilotons) (USD Million)
- 4.1.3. Construction
- 4.1.3.1. Market Estimates and Forecast, 2018 - 2030 (Kilotons) (USD Million)
- 4.1.4. Textile
- 4.1.4.1. Market Estimates and Forecast, 2018 - 2030 (Kilotons) (USD Million)
- 4.1.5. Others
- 4.1.5.1. Market Estimates and Forecast, 2018 - 2030 (Kilotons) (USD Million)
- 4.1.1. Automotive
Chapter 5. Chloroprene Rubber Market Regional Outlook Estimates & Forecasts
- 5.1. Regional Snapshot
- 5.2. Chloroprene Rubber Market: Regional Movement Analysis, 2024 & 2030
- 5.3. North America
- 5.3.1. Market Estimates and Forecast, 2018 - 2030 (Kilotons) (USD Million)
- 5.3.2. Market Estimates and Forecast, By Application, 2018 - 2030 (Kilotons) (USD Million)
- 5.3.3. U.S.
- 5.3.3.1. Market Estimates and Forecast, 2018 - 2030 (Kilotons) (USD Million)
- 5.3.3.2. Market Estimates and Forecast, By Application, 2018 - 2030 (Kilotons) (USD Million)
- 5.4. Europe
- 5.4.1. Market Estimates and Forecast, 2018 - 2030 (Kilotons) (USD Million)
- 5.4.2. Market Estimates and Forecast, By Application, 2018 - 2030 (Kilotons) (USD Million)
- 5.4.3. Germany
- 5.4.3.1. Market Estimates and Forecast, 2018 - 2030 (Kilotons) (USD Million)
- 5.4.3.2. Market Estimates and Forecast, By Application, 2018 - 2030 (Kilotons) (USD Million)
- 5.5. Asia Pacific
- 5.5.1. Market Estimates and Forecast, 2018 - 2030 (Kilotons) (USD Million)
- 5.5.2. Market Estimates and Forecast, By Application, 2018 - 2030 (Kilotons) (USD Million)
- 5.5.3. China
- 5.5.3.1. Market Estimates and Forecast, 2018 - 2030 (Kilotons) (USD Million)
- 5.5.3.2. Market Estimates and Forecast, By Application, 2018 - 2030 (Kilotons) (USD Million)
- 5.5.4. Japan
- 5.5.4.1. Market Estimates and Forecast, 2018 - 2030 (Kilotons) (USD Million)
- 5.5.4.2. Market Estimates and Forecast, By Application, 2018 - 2030 (Kilotons) (USD Million)
- 5.5.5. India
- 5.5.5.1. Market Estimates and Forecast, 2018 - 2030 (Kilotons) (USD Million)
- 5.5.5.2. Market Estimates and Forecast, By Application, 2018 - 2030 (Kilotons) (USD Million)
- 5.6. Latin America
- 5.6.1. Market Estimates and Forecast, 2018 - 2030 (Kilotons) (USD Million)
- 5.6.2. Market Estimates and Forecast, By Application, 2018 - 2030 (Kilotons) (USD Million)
- 5.7. Middle East & Africa
- 5.7.1. Market Estimates and Forecast, 2018 - 2030 (Kilotons) (USD Million)
- 5.7.2. Market Estimates and Forecast, By Application, 2018 - 2030 (Kilotons) (USD Million)
Chapter 6. Competitive Landscape
- 6.1. Recent Developments & Impact Analysis, By Key Market Participants
- 6.2. Vendor Landscape
- 6.2.1. Company Categorization
- 6.2.2. List of Key Distributors and Channel Partners
- 6.2.3. List of Potential Customers/End Users
- 6.3. Competitive Dynamics
- 6.3.1. Competitive Benchmarking
- 6.3.2. Strategy Mapping
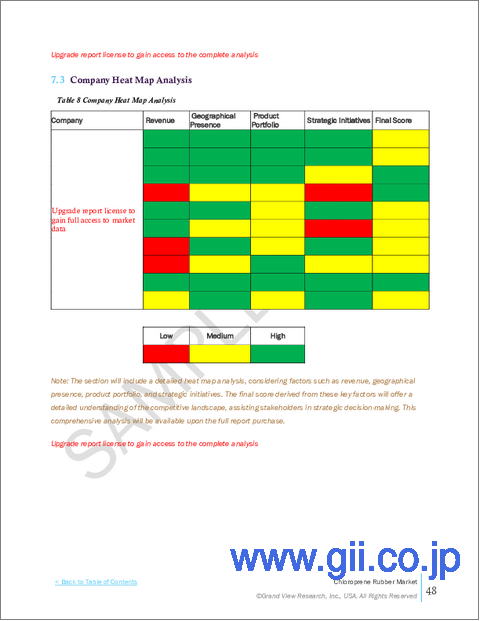
- 6.3.3. Heat Map Analysis
- 6.4. Company Profiles/Listing
- 6.4.1. DuPont Performance Elastomers
- 6.4.1.1. Participant's Overview
- 6.4.1.2. Financial Performance
- 6.4.1.3. Product Benchmarking
- 6.4.1.4. Strategic Initiatives
- 6.4.2. Showa Denko K.K.
- 6.4.2.1. Participant's Overview
- 6.4.2.2. Financial Performance
- 6.4.2.3. Product Benchmarking
- 6.4.2.4. Strategic Initiatives
- 6.4.3. Denka Group
- 6.4.3.1. Participant's Overview
- 6.4.3.2. Financial Performance
- 6.4.3.3. Product Benchmarking
- 6.4.3.4. Strategic Initiatives
- 6.4.4. Shanxi Synthetic Rubber Group Co. Ltd.
- 6.4.4.1. Participant's Overview
- 6.4.4.2. Financial Performance
- 6.4.4.3. Product Benchmarking
- 6.4.4.4. Strategic Initiatives
- 6.4.5. Chongqing Longevity Salt and Chemical Co. Ltd.
- 6.4.5.1. Participant's Overview
- 6.4.5.2. Financial Performance
- 6.4.5.3. Product Benchmarking
- 6.4.5.4. Strategic Initiatives
- 6.4.6. Lanxess AG
- 6.4.6.1. Participant's Overview
- 6.4.6.2. Financial Performance
- 6.4.6.3. Product Benchmarking
- 6.4.6.4. Strategic Initiatives
- 6.4.7. Tosoh Corporation
- 6.4.7.1. Participant's Overview
- 6.4.7.2. Financial Performance
- 6.4.7.3. Product Benchmarking
- 6.4.7.4. Strategic Initiatives
- 6.4.8. Nairit Plant CJSC
- 6.4.8.1. Participant's Overview
- 6.4.8.2. Financial Performance
- 6.4.8.3. Product Benchmarking
- 6.4.8.4. Strategic Initiatives
- 6.4.9. Zenith Industrial Rubber Products Pvt. Ltd.
- 6.4.9.1. Participant's Overview
- 6.4.9.2. Financial Performance
- 6.4.9.3. Product Benchmarking
- 6.4.9.4. Strategic Initiatives
- 6.4.10. Asahi Kasei Chemicals Corporation
- 6.4.10.1. Participant's Overview
- 6.4.10.2. Financial Performance
- 6.4.10.3. Product Benchmarking
- 6.4.10.4. Strategic Initiatives
- 6.4.11. Dow Chemical Company.
- 6.4.11.1. Participant's Overview
- 6.4.11.2. Financial Performance
- 6.4.11.3. Product Benchmarking
- 6.4.11.4. Strategic Initiatives
- 6.4.12. ARLANXEO
- 6.4.12.1. Participant's Overview
- 6.4.12.2. Financial Performance
- 6.4.12.3. Product Benchmarking
- 6.4.12.4. Strategic Initiatives
- 6.4.13. SEDO Chemicals Neoprene GmbH
- 6.4.13.1. Participant's Overview
- 6.4.13.2. Financial Performance
- 6.4.13.3. Product Benchmarking
- 6.4.13.4. Strategic Initiatives
- 6.4.14. Qingdao Nova Rubber
- 6.4.14.1. Participant's Overview
- 6.4.14.2. Financial Performance
- 6.4.14.3. Product Benchmarking
- 6.4.14.4. Strategic Initiatives
- 6.4.1. DuPont Performance Elastomers


