|
|
市場調査レポート
商品コード
1633719
動物用レーザーの市場規模、シェア、動向分析レポート:製品別、動物別、用途別、クラス別、最終用途別、地域別、セグメント予測、2025年~2030年Veterinary Lasers Market Size, Share & Trends Analysis Report By Product, By Animal, By Application, By Class, By End Use, By Region, And Segment Forecasts, 2025 - 2030 |
||||||

|
|||||||
カスタマイズ可能
|
|||||||


| 動物用レーザーの市場規模、シェア、動向分析レポート:製品別、動物別、用途別、クラス別、最終用途別、地域別、セグメント予測、2025年~2030年 |
|
出版日: 2024年12月12日
発行: Grand View Research
ページ情報: 英文 150 Pages
納期: 2~10営業日
|

全表示
- 概要
- 図表
- 目次
動物用レーザー市場の成長と動向:
Grand View Research, Inc.の新しいレポートによると、世界の獣医用レーザ市場規模は2030年までに5億1,267万米ドルに達すると予測されています。
市場は、2025年から2030年にかけてCAGR 8.70%で拡大する見込みです。市場を牽引する主な要因としては、ペット飼育率の上昇、利害関係者の取り組み、新規市場参入、新興国の所得増加などが挙げられます。例えば、レーザー技術を専門とするBIOLASE, Inc.は、これらの有望市場におけるアンメットニーズに対応するため、獣医学、疼痛管理、耳鼻咽喉科などの新市場への参入を開始しています。一方Aesculight社は、北米で唯一の動物用CO2外科レーザーを製造する会社です。
動物医療へのアクセスが制限され、COVID-19の大流行時には需要が落ち込んだため、2020年の動物用レーザ市場はマイナスの影響を受けました。さらに、ヘルスケア優先順位のシフト、手術件数の減少、社会的距離規範に従ったペット訪問の減少も市場に影響を与えました。2024年には移動制限が緩和され、獣医の訪問が増加したため、市場は徐々に回復しました。また、すべての経済が開放され、人々が新常態に適応するにつれて、予測期間中に市場は大幅に拡大すると予想されます。
さらに、動物用レーザ市場は、変形性関節症、捻挫、挫傷、耳炎、その他の慢性疾患を含む疾患の発生率の上昇によって牽引されています。ペットの肥満などの危険因子の増加により、慢性疾患の有病率も増加しています。例えば、2020年8月にFrontiers in Veterinary Science Journalに掲載された研究によると、間葉系幹細胞(MSC)は関節炎の犬の跛行を軽減するのに有効であると推定されました。この研究はまた、MSC治療が犬の変形性関節症に対する安全で効果的かつ長期的な治療として使用できる可能性を示唆しました。
動物用レーザー市場レポートハイライト
- 犬の動物タイプセグメントは、2024年に47%以上の最大の収益シェアを占め、世界中でペットとしての犬の人気が高まっていることから、予測期間中に大きな成長が見込まれています。
- 疼痛・炎症管理用途分野が2024年の市場を独占しました。再生 / 組織修復セグメントは、予測期間に最も速いCAGRで拡大すると予測されています。
- クラスタイプ別では、クラス3レーザセグメントが2024年に最大の収益シェアを占めましたが、これはこれらのレーザの他のタイプに対するその他の特典によるものです。
- 治療レーザ製品セグメントは、予測期間で有利な成長率を示すと見られています。
- 動物病院とクリニックの最終用途セグメントは、獣医師と動物病院の増加により、2024年に最大の収益シェアを占めました。
- 北米は、有利なペット保険政策、獣医用途のレーザシステムとサービスの利用可能性が高まっていることから、予測期間で市場を独占すると見られています。
目次
第1章 調査手法と範囲
第2章 エグゼクティブサマリー
第3章 獣医用レーザー産業の展望
- 市場系統の見通し
- 親市場
- 補助市場
- 市場力学
- 市場ドライバー分析
- 市場抑制要因分析
- 市場機会分析
- 市場課題分析
- 獣医用レーザー市場分析ツール
- 業界分析- ポーターのファイブフォース分析
- PESTEL分析
- 規制の枠組み
- 製品価格分析
- 2024年の主要種および主要国別の動物の推定個体数
- COVID-19の影響分析
第4章 獣医用レーザー市場:動物の推定・動向分析
- セグメントダッシュボード
- 世界の獣医用レーザー市場:動物の変動分析
- 世界の獣医用レーザー市場規模と動向分析、動物別、2018~2030年
- 犬
- 猫
- その他
第5章 獣医用レーザー市場:用途の推定・動向分析
- セグメントダッシュボード
- 世界の獣医用レーザー市場:用途変動分析
- 世界の獣医用レーザー市場の規模と動向分析、用途別、2018~2030年
- 痛みと炎症の管理
- 再生 / 組織修復
- その他
第6章 獣医用レーザー市場:クラスの推定・動向分析
- セグメントダッシュボード
- 世界の獣医用レーザー市場:クラスの変動分析
- 世界の獣医用レーザー市場の規模と動向分析、クラス別、2018~2030年
- クラス2
- クラス3
- クラス4
第7章 獣医用レーザー市場:製品の推定・動向分析
- セグメントダッシュボード
- 世界の獣医用レーザー市場:製品変動分析
- 世界の獣医用レーザー市場規模と動向分析、製品別、2018~2030年
- 治療用レーザー
- 外科用レーザー
第8章 獣医用レーザー市場:最終用途の推定・動向分析
- セグメントダッシュボード
- 世界の獣医用レーザー市場:最終用途変動分析
- 世界の獣医用レーザー市場の規模と動向分析、最終用途別、2018~2030年
- 動物病院・診療所
- その他
第9章 獣医用レーザー市場:地域の推定・動向分析
- 地域ダッシュボード
- 獣医用レーザー市場シェア、地域別、2024年および2030年
- 地域展望
- 北米
- 米国
- カナダ
- メキシコ
- 欧州
- 英国
- ドイツ
- フランス
- イタリア
- スペイン
- デンマーク
- スウェーデン
- ノルウェー
- アジア太平洋
- 日本
- 中国
- インド
- オーストラリア
- 韓国
- タイ
- ラテンアメリカ
- ブラジル
- アルゼンチン
- 中東・アフリカ
- 南アフリカ
- サウジアラビア
- アラブ首長国連邦
- クウェート
第10章 競合情勢
- 市場参入企業の分類
- 企業市況分析 / ヒープマップ分析
- 企業プロファイル
- SpectraVET
- VBS Direct Limited
- Omega Laser Systems Ltd
- Excel Lasers Limited.
- SOUND
- Multi Radiance Medical
- ASALaser
- BIOLASE, Inc.
- Cutting Edge Laser Technologies
- Summus Medical Laser, LLC
- 戦略マッピング
- 合併と買収
- パートナーシップとコラボレーション
- サービス開始
- 拡張
- その他
- その他の主要企業のリスト
List of Tables
- Table 1 List of secondary sources
- Table 2 Global Veterinary Lasers Market, by region, 2018 - 2030 (USD Million)
- Table 3 Global Veterinary Lasers Market, by Animal, 2018 - 2030 (USD Million)
- Table 4 Global Veterinary Lasers Market, by Application, 2018 - 2030 (USD Million)
- Table 5 Global Veterinary Lasers Market, by Product, 2018 - 2030 (USD Million)
- Table 6 Global Veterinary Lasers Market, by Class, 2018 - 2030 (USD Million)
- Table 7 Global Veterinary Lasers Market, by End Use, 2018 - 2030 (USD Million)
- Table 8 North America Veterinary Lasers Market, by country, 2018 - 2030 (USD Million)
- Table 9 North America Veterinary Lasers Market, by Animal, 2018 - 2030 (USD Million)
- Table 10 North America Veterinary Lasers Market, by Application, 2018 - 2030 (USD Million)
- Table 11 North America Veterinary Lasers Market, by Class, 2018 - 2030 (USD Million)
- Table 12 North America Veterinary Lasers Market, by Product, 2018 - 2030 (USD Million)
- Table 13 North America Veterinary Lasers Market, by End Use, 2018 - 2030 (USD Million)
- Table 14 U.S. Veterinary Lasers Market, by Animal, 2018 - 2030 (USD Million)
- Table 15 U.S. Veterinary Lasers Market, by Application, 2018 - 2030 (USD Million)
- Table 16 U.S. Veterinary Lasers Market, by Class, 2018 - 2030 (USD Million)
- Table 17 U.S. Veterinary Lasers Market, by Product, 2018 - 2030 (USD Million)
- Table 18 U.S. Veterinary Lasers Market, by End Use, 2018 - 2030 (USD Million)
- Table 19 Canada Veterinary Lasers Market, by Animal, 2018 - 2030 (USD Million)
- Table 20 Canada Veterinary Lasers Market, by Application, 2018 - 2030 (USD Million)
- Table 21 Canada Veterinary Lasers Market, by Class, 2018 - 2030 (USD Million)
- Table 22 Canada Veterinary Lasers Market, by Product, 2018 - 2030 (USD Million)
- Table 23 Canada Veterinary Lasers Market, by End Use, 2018 - 2030 (USD Million)
- Table 24 Mexico Veterinary Lasers Market, by Animal, 2018 - 2030 (USD Million)
- Table 25 Mexico Veterinary Lasers Market, by Application, 2018 - 2030 (USD Million)
- Table 26 Mexico Veterinary Lasers Market, by Class, 2018 - 2030 (USD Million)
- Table 27 Mexico Veterinary Lasers Market, by Product, 2018 - 2030 (USD Million)
- Table 28 Mexico Veterinary Lasers Market, by End Use, 2018 - 2030 (USD Million)
- Table 29 Europe Veterinary Lasers Market, by country, 2018 - 2030 (USD Million)
- Table 30 Europe Veterinary Lasers Market, by Animal, 2018 - 2030 (USD Million)
- Table 31 Europe Veterinary Lasers Market, by Application, 2018 - 2030 (USD Million)
- Table 32 Europe Veterinary Lasers Market, by Class, 2018 - 2030 (USD Million)
- Table 33 Europe Veterinary Lasers Market, by Product, 2018 - 2030 (USD Million)
- Table 34 Europe Veterinary Lasers Market, by End Use, 2018 - 2030 (USD Million)
- Table 35 Germany Veterinary Lasers Market, by Animal, 2018 - 2030 (USD Million)
- Table 36 Germany Veterinary Lasers Market, by Application, 2018 - 2030 (USD Million)
- Table 37 Germany Veterinary Lasers Market, by Class, 2018 - 2030 (USD Million)
- Table 38 Germany Veterinary Lasers Market, by Product, 2018 - 2030 (USD Million)
- Table 39 Germany Veterinary Lasers Market, by End Use, 2018 - 2030 (USD Million)
- Table 40 UK Veterinary Lasers Market, by Animal, 2018 - 2030 (USD Million)
- Table 41 UK Veterinary Lasers Market, by Application, 2018 - 2030 (USD Million)
- Table 42 UK Veterinary Lasers Market, by Class, 2018 - 2030 (USD Million)
- Table 43 UK Veterinary Lasers Market, by Product, 2018 - 2030 (USD Million)
- Table 44 UK Veterinary Lasers Market, by End Use, 2018 - 2030 (USD Million)
- Table 45 France Veterinary Lasers Market, by Animal, 2018 - 2030 (USD Million)
- Table 46 France Veterinary Lasers Market, by Application, 2018 - 2030 (USD Million)
- Table 47 France Veterinary Lasers Market, by Class, 2018 - 2030 (USD Million)
- Table 48 France Veterinary Lasers Market, by Product, 2018 - 2030 (USD Million)
- Table 49 France Veterinary Lasers Market, by End Use, 2018 - 2030 (USD Million)
- Table 50 Italy Veterinary Lasers Market, by Animal, 2018 - 2030 (USD Million)
- Table 51 Italy Veterinary Lasers Market, by Application, 2018 - 2030 (USD Million)
- Table 52 Italy Veterinary Lasers Market, by Class, 2018 - 2030 (USD Million)
- Table 53 Italy Veterinary Lasers Market, by Product, 2018 - 2030 (USD Million)
- Table 54 Italy Veterinary Lasers Market, by End Use, 2018 - 2030 (USD Million)
- Table 55 Spain Veterinary Lasers Market, by Animal, 2018 - 2030 (USD Million)
- Table 56 Spain Veterinary Lasers Market, by Application, 2018 - 2030 (USD Million)
- Table 57 Spain Veterinary Lasers Market, by Class, 2018 - 2030 (USD Million)
- Table 58 Spain Veterinary Lasers Market, by Product, 2018 - 2030 (USD Million)
- Table 59 Spain Veterinary Lasers Market, by End Use, 2018 - 2030 (USD Million)
- Table 60 Denmark Veterinary Lasers Market, by Animal, 2018 - 2030 (USD Million)
- Table 61 Denmark Veterinary Lasers Market, by Application, 2018 - 2030 (USD Million)
- Table 62 Denmark Veterinary Lasers Market, by Class, 2018 - 2030 (USD Million)
- Table 63 Denmark Veterinary Lasers Market, by Product, 2018 - 2030 (USD Million)
- Table 64 Denmark Veterinary Lasers Market, by End Use, 2018 - 2030 (USD Million)
- Table 65 Sweden Veterinary Lasers Market, by Animal, 2018 - 2030 (USD Million)
- Table 66 Sweden Veterinary Lasers Market, by Application, 2018 - 2030 (USD Million)
- Table 67 Sweden Veterinary Lasers Market, by Class, 2018 - 2030 (USD Million)
- Table 68 Sweden Veterinary Lasers Market, by Product, 2018 - 2030 (USD Million)
- Table 69 Sweden Veterinary Lasers Market, by End Use, 2018 - 2030 (USD Million)
- Table 70 Norway Veterinary Lasers Market, by Animal, 2018 - 2030 (USD Million)
- Table 71 Norway Veterinary Lasers Market, by Application, 2018 - 2030 (USD Million)
- Table 72 Norway Veterinary Lasers Market, by Class, 2018 - 2030 (USD Million)
- Table 73 Norway Veterinary Lasers Market, by Product, 2018 - 2030 (USD Million)
- Table 74 Norway Veterinary Lasers Market, by End Use, 2018 - 2030 (USD Million)
- Table 75 Asia Pacific Veterinary Lasers Market, by country, 2018 - 2030 (USD Million)
- Table 76 Asia Pacific Veterinary Lasers Market, by Animal, 2018 - 2030 (USD Million)
- Table 77 Asia Pacific Veterinary Lasers Market, by Application, 2018 - 2030 (USD Million)
- Table 78 Asia Pacific Veterinary Lasers Market, by Class, 2018 - 2030 (USD Million)
- Table 79 Asia Pacific Veterinary Lasers Market, by Product, 2018 - 2030 (USD Million)
- Table 80 Asia Pacific Veterinary Lasers Market, by End Use, 2018 - 2030 (USD Million)
- Table 81 China Veterinary Lasers Market, by Animal, 2018 - 2030 (USD Million)
- Table 82 China Veterinary Lasers Market, by Application, 2018 - 2030 (USD Million)
- Table 83 China Veterinary Lasers Market, by Class, 2018 - 2030 (USD Million)
- Table 84 China Veterinary Lasers Market, by Product, 2018 - 2030 (USD Million)
- Table 85 China Veterinary Lasers Market, by End Use, 2018 - 2030 (USD Million)
- Table 86 Japan Veterinary Lasers Market, by Animal, 2018 - 2030 (USD Million)
- Table 87 Japan Veterinary Lasers Market, by Application, 2018 - 2030 (USD Million)
- Table 88 Japan Veterinary Lasers Market, by Class, 2018 - 2030 (USD Million)
- Table 89 Japan Veterinary Lasers Market, by Product, 2018 - 2030 (USD Million)
- Table 90 Japan Veterinary Lasers Market, by End Use, 2018 - 2030 (USD Million)
- Table 91 India Veterinary Lasers Market, by Animal, 2018 - 2030 (USD Million)
- Table 92 India Veterinary Lasers Market, by Application, 2018 - 2030 (USD Million)
- Table 93 India Veterinary Lasers Market, by Class, 2018 - 2030 (USD Million)
- Table 94 India Veterinary Lasers Market, by Product, 2018 - 2030 (USD Million)
- Table 95 India Veterinary Lasers Market, by End Use, 2018 - 2030 (USD Million)
- Table 96 South Korea Veterinary Lasers Market, by Animal, 2018 - 2030 (USD Million)
- Table 97 South Korea Veterinary Lasers Market, by Application, 2018 - 2030 (USD Million)
- Table 98 South America Veterinary Lasers Market, by Class, 2018 - 2030 (USD Million)
- Table 99 South Korea Veterinary Lasers Market, by Product, 2018 - 2030 (USD Million)
- Table 100 South Korea Veterinary Lasers Market, by End Use, 2018 - 2030 (USD Million)
- Table 101 Australia Veterinary Lasers Market, by Animal, 2018 - 2030 (USD Million)
- Table 102 Australia Veterinary Lasers Market, by Application, 2018 - 2030 (USD Million)
- Table 103 Australia Veterinary Lasers Market, by Class, 2018 - 2030 (USD Million)
- Table 104 Australia Veterinary Lasers Market, by Product, 2018 - 2030 (USD Million)
- Table 105 Australia Veterinary Lasers Market, by End Use, 2018 - 2030 (USD Million)
- Table 106 Thailand Veterinary Lasers Market, by Animal, 2018 - 2030 (USD Million)
- Table 107 Thailand Veterinary Lasers Market, by Application, 2018 - 2030 (USD Million)
- Table 108 Thailand Veterinary Lasers Market, by Class, 2018 - 2030 (USD Million)
- Table 109 Thailand Veterinary Lasers Market, by Product, 2018 - 2030 (USD Million)
- Table 110 Thailand Veterinary Lasers Market, by End Use, 2018 - 2030 (USD Million)
- Table 111 Latin America Veterinary Lasers Market, by country, 2018 - 2030 (USD Million)
- Table 112 Latin America Veterinary Lasers Market, by Animal, 2018 - 2030 (USD Million)
- Table 113 Latin America Veterinary Lasers Market, by Application, 2018 - 2030 (USD Million)
- Table 114 Latin America Veterinary Lasers Market, by Class, 2018 - 2030 (USD Million)
- Table 115 Latin America Veterinary Lasers Market, by Product, 2018 - 2030 (USD Million)
- Table 116 Latin America Veterinary Lasers Market, by End Use, 2018 - 2030 (USD Million)
- Table 117 Brazil Veterinary Lasers Market, by Animal, 2018 - 2030 (USD Million)
- Table 118 Brazil Veterinary Lasers Market, by Application, 2018 - 2030 (USD Million)
- Table 119 Brazil Veterinary Lasers Market, by Class, 2018 - 2030 (USD Million)
- Table 120 Brazil Veterinary Lasers Market, by Product, 2018 - 2030 (USD Million)
- Table 121 Brazil Veterinary Lasers Market, by End Use, 2018 - 2030 (USD Million)
- Table 122 Argentina Veterinary Lasers Market, by Animal, 2018 - 2030 (USD Million)
- Table 123 Argentina Veterinary Lasers Market, by Application, 2018 - 2030 (USD Million)
- Table 124 Argentina Veterinary Lasers Market, by Class, 2018 - 2030 (USD Million)
- Table 125 Argentina Veterinary Lasers Market, by Product, 2018 - 2030 (USD Million)
- Table 126 Argentina Veterinary Lasers Market, by End Use, 2018 - 2030 (USD Million)
- Table 127 MEA Veterinary Lasers Market, by country, 2018 - 2030 (USD Million)
- Table 128 MEA Veterinary Lasers Market, by Animal, 2018 - 2030 (USD Million)
- Table 129 MEA Veterinary Lasers Market, by Application, 2018 - 2030 (USD Million)
- Table 130 MEA Veterinary Lasers Market, by Class, 2018 - 2030 (USD Million)
- Table 131 MEA Veterinary Lasers Market, by Product, 2018 - 2030 (USD Million)
- Table 132 MEA Veterinary Lasers Market, by End Use, 2018 - 2030 (USD Million)
- Table 133 South Africa Veterinary Lasers Market, by Animal, 2018 - 2030 (USD Million)
- Table 134 South Africa Veterinary Lasers Market, by Application, 2018 - 2030 (USD Million)
- Table 135 South Africa Veterinary Lasers Market, by Class, 2018 - 2030 (USD Million)
- Table 136 South Africa Veterinary Lasers Market, by Product, 2018 - 2030 (USD Million)
- Table 137 South Africa Veterinary Lasers Market, by End Use, 2018 - 2030 (USD Million)
- Table 138 Saudi Arabia Veterinary Lasers Market, by Animal, 2018 - 2030 (USD Million)
- Table 139 Saudi Arabia Veterinary Lasers Market, by Application, 2018 - 2030 (USD Million)
- Table 140 Saudi Arabia Veterinary Lasers Market, by Product, 2018 - 2030 (USD Million)
- Table 141 Saudi Arabia Veterinary Lasers Market, by End Use, 2018 - 2030 (USD Million)
- Table 142 UAE Veterinary Lasers Market, by Animal, 2018 - 2030 (USD Million)
- Table 143 UAE Veterinary Lasers Market, by Application, 2018 - 2030 (USD Million)
- Table 144 UAE Veterinary Lasers Market, by Class, 2018 - 2030 (USD Million)
- Table 145 UAE Veterinary Lasers Market, by Product, 2018 - 2030 (USD Million)
- Table 146 UAE Veterinary Lasers Market, by End Use, 2018 - 2030 (USD Million)
- Table 147 Kuwait Veterinary Lasers Market, by Animal, 2018 - 2030 (USD Million)
- Table 148 Kuwait Veterinary Lasers Market, by Application, 2018 - 2030 (USD Million)
- Table 149 Kuwait Veterinary Lasers Market, by Class, 2018 - 2030 (USD Million)
- Table 150 Kuwait Veterinary Lasers Market, by Product, 2018 - 2030 (USD Million)
- Table 151 Kuwait Veterinary Lasers Market, by End Use, 2018 - 2030 (USD Million)
- Table 152 Company Overview
- Table 153 Product Benchmarking
- Table 154 Financial Performance
- Table 155 Strategic Initiatives
List of Figures
- Fig. 1 Market segmentation
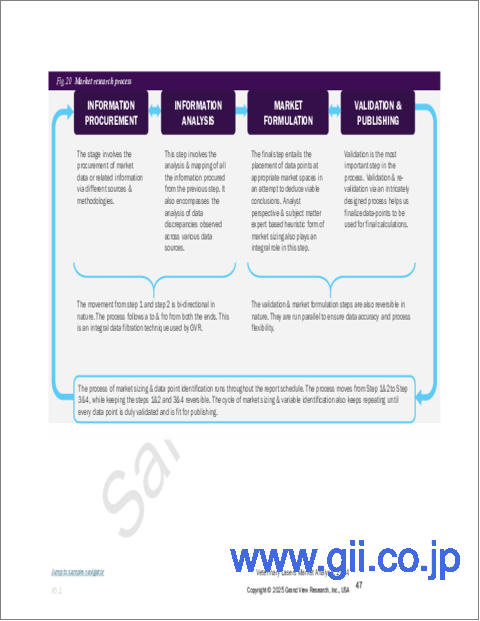
- Fig. 2 Market research process
- Fig. 3 Information procurement
- Fig. 4 Primary research pattern
- Fig. 5 Market research approaches
- Fig. 6 Value chain-based sizing & forecasting
- Fig. 7 QFD modelling for market share assessment
- Fig. 8 Market formulation & validation
- Fig. 9 Veterinary Lasers Market revenue, 2018-2030 (USD Million)
- Fig. 10 Veterinary Lasers Market snapshot
- Fig. 11 Veterinary Lasers Market driver impact
- Fig. 12 Veterinary Lasers Market restraint impact
- Fig. 13 Veterinary Lasers Animal key takeaways (USD Million)
- Fig. 14 Veterinary Lasers Market: Animal movement analysis
- Fig. 15 Global dogs market, 2018 - 2030 (USD Million)
- Fig. 16 Global cats market, 2018 - 2030 (USD Million)
- Fig. 17 Global others market, 2018 - 2030 (USD Million)
- Fig. 18 Veterinary Lasers Market Application key takeaways (USD Million)
- Fig. 19 Veterinary Lasers Market: Application movement analysis
- Fig. 20 Global Pain & Inflammation Management market, 2018 - 2030 (USD Million)
- Fig. 21 Global Regeneration/ tissue repair market, 2018 - 2030 (USD Million)
- Fig. 22 Global Others market, 2018 - 2030 (USD Million)
- Fig. 23 Veterinary Lasers Market Class key takeaways (USD Million)
- Fig. 24 Veterinary Lasers Market: Class movement analysis
- Fig. 25 Global class 2 market, 2018 - 2030 (USD Million)
- Fig. 26 Global class 3 market, 2018 - 2030 (USD Million)
- Fig. 27 Global class 4 market, 2018 - 2030 (USD Million)
- Fig. 28 Veterinary Lasers Market product key takeaways (USD Million)
- Fig. 29 Veterinary Lasers Market: product movement analysis
- Fig. 30 Global therapeutic lasers market, 2018 - 2030 (USD Million)
- Fig. 31 Global surgical lasers market, 2018 - 2030 (USD Million)
- Fig. 32 Veterinary Lasers Market end use key takeaways (USD Million)
- Fig. 33 Veterinary Lasers Market: end use movement analysis
- Fig. 34 Global veterinary hospitals & clinics market, 2018 - 2030 (USD Million)
- Fig. 35 Global others market, 2018 - 2030 (USD Million)
- Fig. 36 Regional marketplace: Key takeaways
- Fig. 37 Regional outlook, 2024 & 2030
- Fig. 38 North America Veterinary Lasers Market, 2018 - 2030 (USD Million)
- Fig. 39 U.S. Veterinary Lasers Market, 2018 - 2030 (USD Million)
- Fig. 40 Canada Veterinary Lasers Market, 2018 - 2030 (USD Million)
- Fig. 41 Mexico Veterinary Lasers Market, 2018 - 2030 (USD Million)
- Fig. 42 Europe Veterinary Lasers Market, 2018 - 2030 (USD Million)
- Fig. 43 UK Veterinary Lasers Market, 2018 - 2030 (USD Million)
- Fig. 44 Germany Veterinary Lasers Market, 2018 - 2030 (USD Million)
- Fig. 45 France Veterinary Lasers Market, 2018 - 2030 (USD Million)
- Fig. 46 Italy Veterinary Lasers Market, 2018 - 2030 (USD Million)
- Fig. 47 Spain veterinary lasers market, 2018 - 2030 (USD Million)
- Fig. 48 Denmark Veterinary Lasers Market, 2018 - 2030 (USD Million)
- Fig. 49 Sweden Veterinary Lasers Market, 2018 - 2030 (USD Million)
- Fig. 50 Norway Veterinary Lasers Market, 2018 - 2030 (USD Million)
- Fig. 51 Asia Pacific Veterinary Lasers Market, 2018 - 2030 (USD Million)
- Fig. 52 Japan Veterinary Lasers Market, 2018 - 2030 (USD Million)
- Fig. 53 China Veterinary Lasers Market, 2018 - 2030 (USD Million)
- Fig. 54 India Veterinary Lasers Market, 2018 - 2030 (USD Million)
- Fig. 55 Australia Veterinary Lasers Market, 2018 - 2030 (USD Million)
- Fig. 56 South Korea Veterinary Lasers Market, 2018 - 2030 (USD Million)
- Fig. 57 Thailand Veterinary Lasers Market, 2018 - 2030 (USD Million)
- Fig. 58 Latin America Veterinary Lasers Market, 2018 - 2030 (USD Million)
- Fig. 59 Brazil Veterinary Lasers Market, 2018 - 2030 (USD Million)
- Fig. 60 Argentina Veterinary Lasers Market, 2018 - 2030 (USD Million)
- Fig. 61 MEA Veterinary Lasers Market, 2018 - 2030 (USD Million)
- Fig. 62 South Africa Veterinary Lasers Market, 2018 - 2030 (USD Million)
- Fig. 63 Saudi Arabia Veterinary Lasers Market, 2018 - 2030 (USD Million)
- Fig. 64 UAE Veterinary Lasers Market, 2018 - 2030 (USD Million)
- Fig. 65 Kuwait Veterinary Lasers Market, 2018 - 2030 (USD Million)
- Fig. 66 Market participant categorization
- Fig. 67 Heat map analysis
Veterinary Lasers Market Growth & Trends:
The global veterinary lasers market size is expected to reach USD 512.67 million by 2030, according to a new report by Grand View Research, Inc. The market is expected to expand at a CAGR of 8.70% from 2025 to 2030. The key factors driving the market include rising pet adoption, initiatives by market stakeholders, new market entrants, and rising income in emerging nations. For instance, BIOLASE, Inc., specializing in laser technology, has started to enter new markets including veterinary, pain management, and otolaryngology to address the unmet needs in these promising markets. Aesculight, on the other hand, is the only company manufacturing veterinary CO2 surgical lasers in North America.
Due to the limited access to veterinary care and dampened demand during the COVID-19 outbreak, the market for veterinary lasers was negatively impacted in 2020. Additionally, the market was impacted by the shift in healthcare priorities, a decrease in the number of surgeries, and reduced pet visits in adherence to social distancing norms. The market recovered gradually during 2024 as movement restrictions were eased and vet visits increased. The market is also anticipated to expand considerably over the forecast period as all economies open up and people adjust to the new normal.
Furthermore, the market for veterinary lasers is driven by the rise in the incidence of disorders including osteoarthritis, sprains, strains, otitis, and other chronic ailments. The prevalence of chronic diseases is also increasing due to the increasing number of risk factors such as obesity in pets. For instance, as per a study published in the Frontiers in Veterinary Science Journal in August 2020, Mesenchymal stem cells (MSC) were estimated to be beneficial in reducing lameness in arthritic dogs. The study also suggested that MSC treatment could be used as a safe, effective, and long-term therapy for canine osteoarthritis.
Veterinary Lasers Market Report Highlights:
- The dogs animal type segment held the largest revenue share of more than 47% in 2024 and is expected to grow at a significant rate over the forecast period owing to the increasing popularity of dogs as pets across the globe
- The pain and inflammation management application segment dominated the market in 2024. The regeneration/ tissue repair segment is projected to expand at the fastest CAGR over the forecast period
- By class type, the class 3 lasers segment held the largest revenue share in 2024 due to the additional benefits of these lasers over other types
- The therapeutic lasers product segment is expected to exhibit a lucrative growth rate over the forecast period
- The veterinary hospitals and clinics' end-use segment held the largest revenue share in 2024 owing to the increasing number of veterinarians and veterinary hospitals
- North America is expected to dominate the market over the forecast period due to favorable pet insurance policies and the growing availability of laser systems and services for veterinary applications
Table of Contents
Chapter 1. Methodology and Scope
- 1.1. Market Segmentation and Scope
- 1.2. Research Methodology
- 1.3. Information Procurement
- 1.3.1. Purchased Database
- 1.3.2. GVR's Internal Database
- 1.3.3. Secondary Sources
- 1.3.4. Primary Research
- 1.4. Information/Data Analysis
- 1.5. Market Formulation & Visualization
- 1.6. Data Validation & Publishing
- 1.7. Model Details
- 1.7.1. Commodity flow analysis
- 1.7.2. Global Market: CAGR Calculation
- 1.8. List of Secondary Sources
Chapter 2. Executive Summary
- 2.1. Market Outlook
- 2.2. Segment Outlook
- 2.3. Competitive Insights
Chapter 3. Veterinary Lasers Industry Outlook
- 3.1. Market Lineage Outlook
- 3.1.1. Parent Market
- 3.1.2. Ancillary Market
- 3.2. Market Dynamics
- 3.2.1. Market Driver Analysis
- 3.2.1.1. Growing popularity of pet insurance
- 3.2.1.2. Rise in number of veterinarians
- 3.2.1.3. Technological Advancements
- 3.2.2. Market Restraint Analysis
- 3.2.2.1. High Cost of treatment
- 3.2.3. Market Opportunity Analysis
- 3.2.4. Market Challenge Analysis
- 3.2.1. Market Driver Analysis
- 3.3. Veterinary Lasers Market Analysis Tools
- 3.3.1. Industry Analysis - Porter's
- 3.3.1.1. Bargaining power of suppliers
- 3.3.1.2. Bargaining power of buyers
- 3.3.1.3. Threat of substitution
- 3.3.1.4. Threat of new entrants
- 3.3.1.5. Competitive rivalry
- 3.3.2. PESTEL Analysis
- 3.3.2.1. Political & Legal landscape
- 3.3.2.2. Economic and Social landscape
- 3.3.2.3. Technological landscape
- 3.3.2.4. Environmental landscape
- 3.3.3. Regulatory Framework
- 3.3.4. Product Pricing Analysis
- 3.3.5. Estimated Animal Population, by key species & key countries, 2024
- 3.3.6. COVID-19 Impact Analysis
- 3.3.1. Industry Analysis - Porter's
Chapter 4. Veterinary Lasers Market: Animal Estimates & Trend Analysis
- 4.1. Segment Dashboard
- 4.2. Global Veterinary Lasers Market: Animal Movement Analysis
- 4.3. Global Veterinary Lasers Market Size & Trend Analysis, by animal, 2018 to 2030 (USD Million)
- 4.4. Dogs
- 4.4.1. Dogs Market Revenue Estimates and Forecasts, 2018 - 2030 (USD Million)
- 4.5. Cats
- 4.5.1. Cats Market Revenue Estimates and Forecasts, 2018 - 2030 (USD Million)
- 4.6. Others
- 4.6.1. Others Market Revenue Estimates and Forecasts, 2018 - 2030 (USD Million)
Chapter 5. Veterinary Lasers Market: Application Estimates & Trend Analysis
- 5.1. Segment Dashboard
- 5.2. Global Veterinary Lasers Market: application Movement Analysis
- 5.3. Global Veterinary Lasers Market Size & Trend Analysis, by application, 2018 to 2030 (USD Million)
- 5.3.1. Pain & Inflammation Management
- 5.3.1.1. Pain & Inflammation Management Market Revenue Estimates and Forecasts, 2018 - 2030 (USD Million)
- 5.3.2. Regeneration/ tissue repair
- 5.3.2.1. Regeneration/ tissue repair Market Revenue Estimates and Forecasts, 2018 - 2030 (USD Million)
- 5.3.3. Others
- 5.3.3.1. Others Market Revenue Estimates and Forecasts, 2018 - 2030 (USD Million)
- 5.3.1. Pain & Inflammation Management
Chapter 6. Veterinary Lasers Market: Class Estimates & Trend Analysis
- 6.1. Segment Dashboard
- 6.2. Global Veterinary Lasers Market: class Movement Analysis
- 6.3. Global Veterinary Lasers Market Size & Trend Analysis, by class, 2018 to 2030 (USD Million)
- 6.3.1. Class 2
- 6.3.1.1. Class 2 Management Market Revenue Estimates and Forecasts, 2018 - 2030 (USD Million)
- 6.3.2. Class 3
- 6.3.2.1. Class 3 Market Revenue Estimates and Forecasts, 2018 - 2030 (USD Million)
- 6.3.3. Class 4
- 6.3.3.1. Class 4 Market Revenue Estimates and Forecasts, 2018 - 2030 (USD Million)
- 6.3.1. Class 2
Chapter 7. Veterinary Lasers Market: Product Estimates & Trend Analysis
- 7.1. Segment Dashboard
- 7.2. Global Veterinary Lasers Market: product Movement Analysis
- 7.3. Global Veterinary Lasers Market Size & Trend Analysis, by product, 2018 to 2030 (USD Million)
- 7.3.1. Therapeutic lasers
- 7.3.1.1. Therapeutic lasers Market Revenue Estimates and Forecasts, 2018 - 2030 (USD Million)
- 7.3.2. Surgical lasers
- 7.3.2.1. Surgical lasers Market Revenue Estimates and Forecasts, 2018 - 2030 (USD Million)
- 7.3.1. Therapeutic lasers
Chapter 8. Veterinary Lasers Market: End Use Estimates & Trend Analysis
- 8.1. Segment Dashboard
- 8.2. Global Veterinary Lasers Market: End Use Movement Analysis
- 8.3. Global Veterinary Lasers Market Size & Trend Analysis, by End Use, 2018 to 2030 (USD Million)
- 8.3.1. Veterinary Hospitals & clinics
- 8.3.1.1. Veterinary Hospitals & Clinics Market Revenue Estimates and Forecasts, 2018 - 2030 (USD Million)
- 8.3.2. Others
- 8.3.2.1. Others Market Revenue Estimates and Forecasts, 2018 - 2030 (USD Million)
- 8.3.1. Veterinary Hospitals & clinics
Chapter 9. Veterinary Lasers Market: Regional Estimates & Trend Analysis
- 9.1. Regional Dashboard
- 9.2. Veterinary Lasers Market Share, By Region, 2024 & 2030, USD Million
- 9.3. Regional Outlook
- 9.4. North America
- 9.4.1. North America Veterinary Lasers Market Estimates And Forecasts, 2018 - 2030 (USD Million)
- 9.4.2. U.S.
- 9.4.2.1. Key Country Dynamics
- 9.4.2.2. U.S. Veterinary Lasers Market Estimates And Forecasts, 2018 - 2030 (USD Million)
- 9.4.3. Canada
- 9.4.3.1. Key Country Dynamics
- 9.4.3.2. Canada Veterinary Lasers Market Estimates And Forecasts, 2018 - 2030 (USD Million)
- 9.4.4. Mexico
- 9.4.4.1. Key Country Dynamics
- 9.4.4.2. Mexico Veterinary Lasers Market Estimates And Forecasts, 2018 - 2030 (USD Million)
- 9.5. Europe
- 9.5.1. Europe Veterinary Lasers Market Estimates And Forecasts, 2018 - 2030 (USD Million)
- 9.5.2. UK
- 9.5.2.1. Key Country Dynamics
- 9.5.2.2. UK Veterinary Lasers Market Estimates And Forecasts, 2018 - 2030 (USD Million)
- 9.5.3. Germany
- 9.5.3.1. Key Country Dynamics
- 9.5.3.2. Germany Veterinary Lasers Market Estimates And Forecasts, 2018 - 2030 (USD Million)
- 9.5.4. France
- 9.5.4.1. Key Country Dynamics
- 9.5.4.2. France Veterinary Lasers Market Estimates And Forecasts, 2018 - 2030 (USD Million)
- 9.5.5. Italy
- 9.5.5.1. Key Country Dynamics
- 9.5.5.2. Italy Veterinary Lasers Market Estimates And Forecasts, 2018 - 2030 (USD Million)
- 9.5.6. Spain
- 9.5.6.1. Key Country Dynamics
- 9.5.6.2. Spain Veterinary Lasers Market Estimates And Forecasts, 2018 - 2030 (USD Million)
- 9.5.7. Denmark
- 9.5.7.1. Key Country Dynamics
- 9.5.7.2. Denmark Veterinary Lasers Market Estimates And Forecasts, 2018 - 2030 (USD Million)
- 9.5.8. Sweden
- 9.5.8.1. Key Country Dynamics
- 9.5.8.2. Sweden Veterinary Lasers Market Estimates And Forecasts, 2018 - 2030 (USD Million)
- 9.5.9. Norway
- 9.5.9.1. Key Country Dynamics
- 9.5.9.2. Norway Veterinary Lasers Market Estimates And Forecasts, 2018 - 2030 (USD Million)
- 9.6. Asia Pacific
- 9.6.1. Asia Pacific Veterinary Lasers Market Estimates And Forecasts, 2018 - 2030 (USD Million)
- 9.6.2. Japan
- 9.6.2.1. Key Country Dynamics
- 9.6.2.2. Japan Veterinary Lasers Market Estimates And Forecasts, 2018 - 2030 (USD Million)
- 9.6.3. China
- 9.6.3.1. Key Country Dynamics
- 9.6.3.2. China Veterinary Lasers Market Estimates And Forecasts, 2018 - 2030 (USD Million)
- 9.6.4. India
- 9.6.4.1. Key Country Dynamics
- 9.6.4.2. India Veterinary Lasers Market Estimates And Forecasts, 2018 - 2030 (USD Million)
- 9.6.5. Australia
- 9.6.5.1. Key Country Dynamics
- 9.6.5.2. Australia Veterinary Lasers Market Estimates And Forecasts, 2018 - 2030 (USD Million)
- 9.6.6. South Korea
- 9.6.6.1. Key Country Dynamics
- 9.6.6.2. South Korea Veterinary Lasers Market Estimates And Forecasts, 2018 - 2030 (USD Million)
- 9.6.7. Thailand
- 9.6.7.1. Key Country Dynamics
- 9.6.7.2. Thailand Veterinary Lasers Market Estimates And Forecasts, 2018 - 2030 (USD Million)
- 9.7. Latin America
- 9.7.1. Latin America Veterinary Lasers Market Estimates And Forecasts, 2018 - 2030 (USD Million)
- 9.7.2. Brazil
- 9.7.2.1. Key Country Dynamics
- 9.7.2.2. Brazil Veterinary Lasers Market Estimates And Forecasts, 2018 - 2030 (USD Million)
- 9.7.3. Argentina
- 9.7.3.1. Key Country Dynamics
- 9.7.3.2. Argentina Veterinary Lasers Market Estimates And Forecasts, 2018 - 2030 (USD Million)
- 9.8. Middle East & Africa
- 9.8.1. Middle East & Africa Veterinary Lasers Market Estimates And Forecasts, 2018 - 2030 (USD Million)
- 9.8.2. South Africa
- 9.8.2.1. Key Country Dynamics
- 9.8.2.2. South Africa Veterinary Lasers Market Estimates And Forecasts, 2018 - 2030 (USD Million)
- 9.8.3. Saudi Arabia
- 9.8.3.1. Key Country Dynamics
- 9.8.3.2. Saudi Arabia Veterinary Lasers Market Estimates And Forecasts, 2018 - 2030 (USD Million)
- 9.8.4. UAE
- 9.8.4.1. Key Country Dynamics
- 9.8.4.2. UAE Veterinary Lasers Market Estimates And Forecasts, 2018 - 2030 (USD Million)
- 9.8.5. Kuwait
- 9.8.5.1. Key Country Dynamics
- 9.8.5.2. Kuwait Veterinary Lasers Market Estimates And Forecasts, 2018 - 2030 (USD Million)
Chapter 10. Competitive Landscape
- 10.1. Market Participant Categorization
- 10.2. Company Market Position Analysis/ Heap Map Analysis
- 10.3. Company Profiles
- 10.3.1. SpectraVET
- 10.3.1.1. Participant's Overview
- 10.3.1.2. Financial Performance
- 10.3.1.3. Product Benchmarking
- 10.3.1.4. Strategic Initiatives
- 10.3.2. VBS Direct Limited
- 10.3.2.1. Participant's Overview
- 10.3.2.2. Financial Performance
- 10.3.2.3. Product Benchmarking
- 10.3.2.4. Strategic Initiatives
- 10.3.3. Omega Laser Systems Ltd
- 10.3.3.1. Participant's Overview
- 10.3.3.2. Financial Performance
- 10.3.3.3. Product Benchmarking
- 10.3.3.4. Strategic Initiatives
- 10.3.4. Excel Lasers Limited.
- 10.3.4.1. Participant's Overview
- 10.3.4.2. Financial Performance
- 10.3.4.3. Product Benchmarking
- 10.3.4.4. Strategic Initiatives
- 10.3.5. SOUND
- 10.3.5.1. Participant's Overview
- 10.3.5.2. Financial Performance
- 10.3.5.3. Product Benchmarking
- 10.3.5.4. Strategic Initiatives
- 10.3.6. Multi Radiance Medical
- 10.3.6.1. Participant's Overview
- 10.3.6.2. Financial Performance
- 10.3.6.3. Product Benchmarking
- 10.3.6.4. Strategic Initiatives
- 10.3.7. ASALaser
- 10.3.7.1. Participant's Overview
- 10.3.7.2. Financial Performance
- 10.3.7.3. Product Benchmarking
- 10.3.7.4. Strategic Initiatives
- 10.3.8. BIOLASE, Inc.
- 10.3.8.1. Participant's Overview
- 10.3.8.2. Financial Performance
- 10.3.8.3. Product Benchmarking
- 10.3.8.4. Strategic Initiatives
- 10.3.9. Cutting Edge Laser Technologies
- 10.3.9.1. Participant's Overview
- 10.3.9.2. Financial Performance
- 10.3.9.3. Product Benchmarking
- 10.3.9.4. Strategic Initiatives
- 10.3.10. Summus Medical Laser, LLC
- 10.3.10.1. Participant's Overview
- 10.3.10.2. Financial Performance
- 10.3.10.3. Product Benchmarking
- 10.3.10.4. Strategic Initiatives
- 10.3.1. SpectraVET
- 10.4. Strategy Mapping
- 10.4.1. Mergers & Acquisitions
- 10.4.2. Partnerships & Collaborations
- 10.4.3. Service Launch
- 10.4.4. Expansions
- 10.4.5. Others
- 10.5. List of Other Key Players

