|
|
市場調査レポート
商品コード
1631009
米国の被覆鋼板市場規模、シェア、動向分析レポート:製品別、用途別、セグメント別予測、2025~2030年U.S. Coated Steel Market Size, Share & Trends Analysis Report By Product (Galvanized, Pre-painted), By Application (Building & Construction, Appliances, Automotive), And Segment Forecasts, 2025 - 2030 |
||||||
|
|||||||
カスタマイズ可能
|
|||||||

| 米国の被覆鋼板市場規模、シェア、動向分析レポート:製品別、用途別、セグメント別予測、2025~2030年 |
|
出版日: 2024年12月05日
発行: Grand View Research
ページ情報: 英文 70 Pages
納期: 2~10営業日
|

全表示
- 概要
- 図表
- 目次
米国の被覆鋼板市場の成長と動向
Grand View Research, Inc.の最新レポートによると、米国の被覆鋼板市場規模は2025~2030年にかけてCAGR 3.9%で拡大し、2030年には367億1,000万米ドルに達する見込みです。
軽量自動車部品への需要の増加と、スチール製品の美的外観への傾向の高まりが、予測期間中の市場成長を促進すると予測されています。
鉄鋼は、腐食を防ぎ寿命を延ばすために亜鉛や錫など様々な材料でコーティングされます。被覆鋼板は、食品の安全性、美的外観、耐食性が重要な意味を持つ用途で広く使用されています。そのため、この製品は建設、自動車、民生用電子機器製品、包装、家具、その他多くの産業で応用されています。
製品に基づき、市場は亜鉛メッキ、塗装済み、その他に区分されます。溶融亜鉛メッキは2024年に最大のシェアを占め、予測期間中もその優位性を維持すると予想されます。この製品は、その特性からドアや窓に広く使用されています。亜鉛メッキコーティングを施したスチールプロファイルの利点は、高い構造特性、高強度、低膨張係数、伝統的デザインだけでなくモダンなデザインです。
さらに、極端な気候の米国住宅で金属屋根の重要性が高まっていることから、より優れた性能を長期間維持できる亜鉛メッキ鋼板の需要が高まっています。金属屋根を設置する利点は、設置が簡単で、耐火性があり、軽量で、熱伝導率が低いことです。これらの利点が米国における金属屋根の需要を促進しており、予測期間中に亜鉛メッキ鋼板の消費にプラスの影響を与えると予想されます。
米国における需要の高まりは、同国に新工場を設立する国際的参入企業を引き付けています。例えば、2021年9月現在、オーストラリアを拠点とするBlueScopeは、下流機会を追求するため、米国東部に新しい鉄鋼塗装・コーティング施設の建設を目指しています。NucorやSteel Dynamicsなどの他の企業も生産能力の拡大を計画しています。
米国被覆鋼板市場レポートハイライト
- 製品別では、溶融亜鉛メッキが2024年に82.3%以上の最大の売上シェアを占めました。このシェアは主に、溶融亜鉛メッキ鋼板の浸食回避能力、容易なメンテナンス、自己修復特性に起因します。
- 用途別では、建築・建設が2024年に45.2%を超える収益シェアで市場を独占しました。米国では建設活動が活発化しており、大規模なインフラプロジェクトが製品需要を後押ししています。
- 地域別では、米国北東部が個人住宅建設の増加により、収益ベースで予測期間中にCAGR 4.9%を記録すると予測されています。
- 自動車や航空宇宙を含む産業における軽量材料としての製品需要の増加は、その生産を促進し、最終的に市場成長に利益をもたらしています。
目次
第1章 調査手法と範囲
第2章 エグゼクティブサマリー
第3章 米国の被覆鋼板市場の変数、動向、範囲
- 米国被覆鋼板市場の展望
- 産業バリューチェーン分析
- 平均価格動向分析
- 需給ギャップ分析、2024年
- 規制の枠組み
- 施策とインセンティブプラン
- 標準とコンプライアンス
- 規制影響分析
- 市場力学
- 市場促進要因分析
- 市場抑制要因分析
- 産業の課題
- ポーターのファイブフォース分析
- サプライヤーの力
- 買い手の力
- 代替の脅威
- 新規参入からの脅威
- 競争企業間の敵対関係
- PESTEL分析
- 政治情勢
- 経済情勢
- 社会情勢
- 技術情勢
- 環境情勢
- 法的情勢
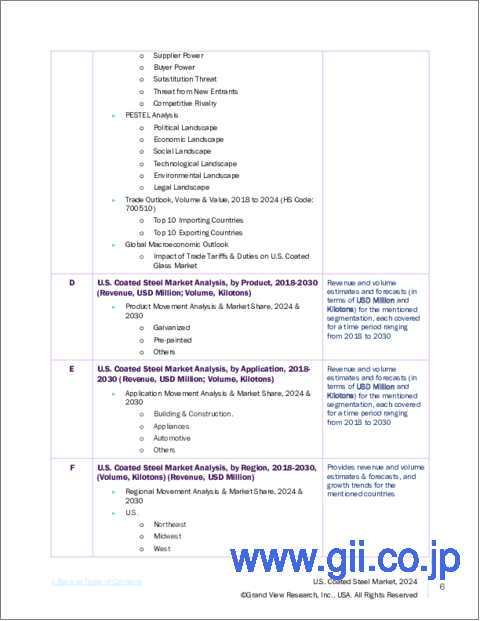
第4章 米国の被覆鋼板市場:製品の展望の推定と予測
- 米国の被覆鋼板市場:製品変動分析、2024年と2030年
- 亜鉛メッキ
- 塗装済み
- その他
第5章 米国の被覆鋼板市場:用途の展望の推定と予測
- 米国の被覆鋼板市場:用途変動分析、2024年と2030年
- 建築・建設
- 民生用電子機器製品
- 自動車
- その他
第6章 米国の被覆鋼板市場:地域別展望予測と予測
- 地域スナップショット
- 米国の被覆鋼板市場:地域変動分析、2024年と2030年
- 南米国
- 製品別、2018~2030年
- 用途別、2018~2030年
- 米国西部
- 製品別、2018~2030年
- 用途別、2018~2030年
- 米国中西部
- 製品別、2018~2030年
- 用途別、2018~2030年
- 米国北東部
- 製品別、2018~2030年
- 用途別、2018~2030年
第7章 競合情勢
- 主要市場参入企業による最近の動向と影響分析
- ベンダー情勢
- 企業分類
- 主要ディストリビューターおよびチャネルパートナー一覧
- 潜在顧客/エンドユーザー一覧
- 競争の力学
- 競合ベンチマーキング
- 戦略マッピング
- ヒートマップ分析
- 企業プロファイル/上場企業
- JSW Steel
- United States Steel
- Nippon Steel &Sumitomo Metal Corporation
- SSAB
- ArcelorMittal
- Salzgitter AG
- NLMK
- Steel Dynamics, Inc
- VOESTALPINE
- California Steel Industries
- Metals USA
- MST Steel Inc.
- POSCO
- SeAH Group
- The Thompson Companies
- AK Steel Corporation
- Commercial Metals Company
- EVRAZ plc.
- GERDAU SA
- JFE Steel Corporation
List of Tables
- Table 1. List Of Abbreviations
- Table 2. U.S. Coated Steel Market Estimates And Forecasts, By Product, 2018 - 2030 (Kilotons) (USD Million)
- Table 3. Galvanized Market Estimates And Forecasts, 2018 - 2030 (Kilotons) (USD Million)
- Table 4. Pre-painted Market Estimates And Forecasts, 2018 - 2030 (Kilotons) (USD Million)
- Table 5. Other Market Estimates And Forecasts, 2018 - 2030 (Kilotons) (USD Million)
- Table 6. U.S. Coated Steel Market Estimates And Forecasts, By Application, 2018 - 2030 (Kilotons) (USD Million)
- Table 7. Building & Construction Market Estimates And Forecasts, 2018 - 2030 (Kilotons) (USD Million)
- Table 8. Appliances Market Estimates And Forecasts, 2018 - 2030 (Kilotons) (USD Million)
- Table 9. Automotive Market Estimates And Forecasts, 2018 - 2030 (Kilotons) (USD Million)
- Table 10. Others Market Estimates And Forecasts, 2018 - 2030 (Kilotons) (USD Million)
- Table 11. U.S. Coated Steel Market Estimates And Forecasts, By Region, 2018 - 2030 (Kilotons) (USD Million)
- Table 12. South U.S. Coated Steel Market Estimates And Forecasts, By Product, 2018 - 2030 (Kilotons) (USD Million)
- Table 13. South U.S. Coated Steel Market Estimates And Forecasts, By Application, 2018 - 2030 (Kilotons) (USD Million)
- Table 14. West U.S. Coated Steel Market Estimates And Forecasts, By Product, 2018 - 2030 (Kilotons) (USD Million)
- Table 15. West U.S. Coated Steel Market Estimates And Forecasts, By Application, 2018 - 2030 (Kilotons) (USD Million)
- Table 16. Midwest U.S. Coated Steel Market Estimates And Forecasts, By Product, 2018 - 2030 (Kilotons) (USD Million)
- Table 17. Midwest U.S. Coated Steel Market Estimates And Forecasts, By Application, 2018 - 2030 (Kilotons) (USD Million)
- Table 18. Northeast U.S. Coated Steel Market Estimates And Forecasts, By Product, 2018 - 2030 (Kilotons) (USD Million)
- Table 19. Northeast U.S. Coated Steel Market Estimates And Forecasts, By Application, 2018 - 2030 (Kilotons) (USD Million)
List of Figures
- Fig. 1 Market Segmentation
- Fig. 2 Information Procurement
- Fig. 3 Data Analysis Models
- Fig. 4 Market Formulation and Validation
- Fig. 5 Market Snapshot
- Fig. 6 Segmental Outlook- Product, and Application
- Fig. 7 Competitive Outlook
- Fig. 8 Value Chain Analysis
- Fig. 9 Market Dynamics
- Fig. 10 Porter's Analysis
- Fig. 11 PESTEL analysis
- Fig. 12 U.S. Coated Steel Market, By Product: Key Takeaways
- Fig. 13 U.S. Coated Steel Market, By Product: Market Share, 2024 & 2030
- Fig. 14 U.S. Coated Steel Market, By Application: Key Takeaways
- Fig. 15 U.S. Coated Steel Market, By Application: Market Share, 2024 & 2030
- Fig. 16 U.S. Coated Steel Market, By Region: Key Takeaways
- Fig. 17 U.S. Coated Steel Market, By Region: Market Share, 2024 & 2030
U.S. Coated Steel Market Growth & Trends:
The U.S. coated steel market size is expected to reach USD 36.71 billion by 2030, expanding at a CAGR of 3.9% from 2025 to 2030, according to a new report by Grand View Research, Inc. Increasing demand for lightweight automotive parts coupled with a rising trend toward the aesthetic appearance of steel products is anticipated to drive market growth across the projected period.
Steel is coated with various materials such as zinc and tin to prevent it from corrosion and increase its life cycle. Coated steel is vastly used in applications where food safety, aesthetic appearance, and corrosion resistance are of vital significance. The product thus finds applications in construction, automotive, appliances, packaging, furniture, and many other industries.
Based on product, the market is segmented into galvanized, pre-painted, and others. Galvanized constituted the largest share in 2024 and is expected to maintain its dominance over the forecast period. The product owing to its characteristics is widely used for doors and windows. Benefits of steel profiles with galvanized coating are high structural characteristics, high strength, low coefficient of expansion, and modern as well as traditional designs.
Moreover, the growing significance of metal roofing in U.S. houses in extreme climates has propelled the demand for galvanized steel as it offers better and long-lasting performance. The benefits of installing a metal roof are easy installation, fire resistance, lightweight, and low heat conduction. These benefits are propelling demand for a metal roof in the U.S. and thus, are anticipated to positively influence galvanized steel consumption over the forecast period.
Growing demand product demand in the U.S. is attracting international players to set up new plants in the country. For instance, as of September 2021, Australia-based BlueScope is eyeing to construct a new steel painting and coating facility in the eastern U.S. to pursue downstream opportunities. Other players such as Nucor and Steel Dynamics Inc. are also planning to expand their production capacities.
U.S. Coated Steel Market Report Highlights:
- Based on product, galvanized held the largest revenue share of over 82.3% in 2024. The share is mainly attributable to galvanized steel's ability to avert erosion, easy maintenance, and self-healing characteristics
- Based on application, building and construction dominated the market with a revenue share of over 45.2% in 2024. The growing construction activities in the U.S. and large-scale infrastructure projects are propelling product demand
- Based on region, Northeast U.S. is anticipated to register a CAGR of 4.9%, in terms of revenue, over the forecast period, on account of increasing construction of private homes in the region
- Increasing product demand as a lightweight material in industries including automotive and aerospace is propelling its production, thus, eventually benefitting market growth
Table of Contents
Chapter 1. Methodology and Scope
- 1.1. Market Segmentation & Scope
- 1.2. Market Definition
- 1.3. Information Procurement
- 1.3.1. Purchased Database
- 1.3.2. GVR's Internal Database
- 1.3.3. Secondary Sources & Third-Party Perspectives
- 1.3.4. Primary Research
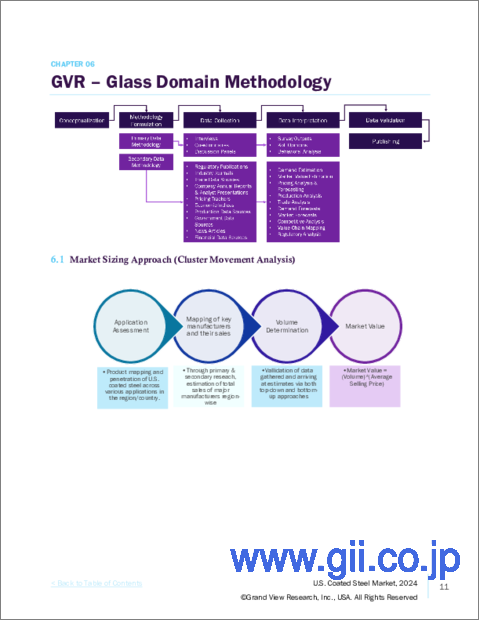
- 1.4. Information Analysis
- 1.4.1. Data Analysis Models
- 1.5. Market Formulation & Data Visualization
- 1.6. Data Validation & Publishing
Chapter 2. Executive Summary
- 2.1. Market Insights
- 2.2. Segmental Outlook
- 2.3. Competitive Outlook
Chapter 3. U.S. Coated Steel Market Variables, Trends & Scope
- 3.1. U.S. Coated Steel Market Outlook
- 3.2. Industry Value Chain Analysis
- 3.3. Average Price Trend Analysis
- 3.4. Supply-Demand Gap Analysis, 2024
- 3.5. Regulatory Framework
- 3.5.1. Policies and Incentive Plans
- 3.5.2. Standards and Compliances
- 3.5.3. Regulatory Impact Analysis
- 3.6. Market Dynamics
- 3.6.1. Market Driver Analysis
- 3.6.2. Market Restraint Analysis
- 3.6.3. Industry Challenges
- 3.7. Porter's Five Forces Analysis
- 3.7.1. Supplier Power
- 3.7.2. Buyer Power
- 3.7.3. Substitution Threat
- 3.7.4. Threat From New Entrant
- 3.7.5. Competitive Rivalry
- 3.8. PESTEL Analysis
- 3.8.1. Political Landscape
- 3.8.2. Economic Landscape
- 3.8.3. Social Landscape
- 3.8.4. Technological Landscape
- 3.8.5. Environmental Landscape
- 3.8.6. Legal Landscape
Chapter 4. U.S. Coated Steel Market: Product Outlook Estimates & Forecasts
- 4.1. U.S. Coated Steel Market: Product Movement Analysis, 2024 & 2030
- 4.1.1. Galvanized
- 4.1.1.1. Market Estimates and Forecast, 2018 - 2030 (Kilotons) (USD Million)
- 4.1.2. Pre-painted
- 4.1.2.1. Market Estimates and Forecast, 2018 - 2030 (Kilotons) (USD Million)
- 4.1.3. Other
- 4.1.3.1. Market Estimates and Forecast, 2018 - 2030 (Kilotons) (USD Million)
- 4.1.1. Galvanized
Chapter 5. U.S. Coated Steel Market: Application Outlook Estimates & Forecasts
- 5.1. U.S. Coated Steel Market: Application Movement Analysis, 2024 & 2030
- 5.1.1. Building & Construction
- 5.1.1.1. Market Estimates and Forecast, 2018 - 2030 (Kilotons) (USD Million)
- 5.1.2. Appliances
- 5.1.2.1. Market Estimates and Forecast, 2018 - 2030 (Kilotons) (USD Million)
- 5.1.3. Automotive
- 5.1.3.1. Market Estimates and Forecast, 2018 - 2030 (Kilotons) (USD Million)
- 5.1.4. Others
- 5.1.4.1. Market Estimates and Forecast, 2018 - 2030 (Kilotons) (USD Million)
- 5.1.1. Building & Construction
Chapter 6. U.S. Coated Steel Market: Region Outlook Estimates & Forecasts
- 6.1. Regional Snapshot
- 6.2. U.S. Coated Steel Market: Regional Movement Analysis, 2024 & 2030
- 6.3. South U.S.
- 6.3.1. Market Estimates and Forecast, 2018 - 2030 (Kilotons) (USD Million)
- 6.3.2. Market Estimates and Forecast, By Product, 2018 - 2030 (Kilotons) (USD Million)
- 6.3.3. Market Estimates and Forecast, By Application, 2018 - 2030 (Kilotons) (USD Million)
- 6.4. West U.S.
- 6.4.1. Market Estimates and Forecast, 2018 - 2030 (Kilotons) (USD Million)
- 6.4.2. Market Estimates and Forecast, By Product, 2018 - 2030 (Kilotons) (USD Million)
- 6.4.3. Market Estimates and Forecast, By Application, 2018 - 2030 (Kilotons) (USD Million)
- 6.5. Midwest U.S.
- 6.5.1. Market Estimates and Forecast, 2018 - 2030 (Kilotons) (USD Million)
- 6.5.2. Market Estimates and Forecast, By Product, 2018 - 2030 (Kilotons) (USD Million)
- 6.5.3. Market Estimates and Forecast, By Application, 2018 - 2030 (Kilotons) (USD Million)
- 6.6. Northeast U.S.
- 6.6.1. Market Estimates and Forecast, 2018 - 2030 (Kilotons) (USD Million)
- 6.6.2. Market Estimates and Forecast, By Product, 2018 - 2030 (Kilotons) (USD Million)
- 6.6.3. Market Estimates and Forecast, By Application, 2018 - 2030 (Kilotons) (USD Million)
Chapter 7. Competitive Landscape
- 7.1. Recent Developments & Impact Analysis, By Key Market Participants
- 7.2. Vendor Landscape
- 7.2.1. Company Categorization
- 7.2.2. List Of Key Distributors and Channel Partners
- 7.2.3. List Of Potential Customers/End Users
- 7.3. Competitive Dynamics
- 7.3.1. Competitive Benchmarking
- 7.3.2. Strategy Mapping
- 7.3.3. Heat Map Analysis
- 7.4. Company Profiles/Listing
- 7.4.1. JSW Steel
- 7.4.1.1. Participant's Overview
- 7.4.1.2. Financial Performance
- 7.4.1.3. Product Benchmarking
- 7.4.1.4. Strategic Initiatives
- 7.4.2. United States Steel
- 7.4.2.1. Participant's Overview
- 7.4.2.2. Financial Performance
- 7.4.2.3. Product Benchmarking
- 7.4.2.4. Strategic Initiatives
- 7.4.3. Nippon Steel & Sumitomo Metal Corporation
- 7.4.3.1. Participant's Overview
- 7.4.3.2. Financial Performance
- 7.4.3.3. Product Benchmarking
- 7.4.3.4. Strategic Initiatives
- 7.4.4. SSAB
- 7.4.4.1. Participant's Overview
- 7.4.4.2. Financial Performance
- 7.4.4.3. Product Benchmarking
- 7.4.4.4. Strategic Initiatives
- 7.4.5. ArcelorMittal
- 7.4.5.1. Participant's Overview
- 7.4.5.2. Financial Performance
- 7.4.5.3. Product Benchmarking
- 7.4.5.4. Strategic Initiatives
- 7.4.6. Salzgitter AG
- 7.4.6.1. Participant's Overview
- 7.4.6.2. Financial Performance
- 7.4.6.3. Product Benchmarking
- 7.4.6.4. Strategic Initiatives
- 7.4.7. NLMK
- 7.4.7.1. Participant's Overview
- 7.4.7.2. Financial Performance
- 7.4.7.3. Product Benchmarking
- 7.4.7.4. Strategic Initiatives
- 7.4.8. Steel Dynamics, Inc
- 7.4.8.1. Participant's Overview
- 7.4.8.2. Financial Performance
- 7.4.8.3. Product Benchmarking
- 7.4.8.4. Strategic Initiatives
- 7.4.9. VOESTALPINE
- 7.4.9.1. Participant's Overview
- 7.4.9.2. Financial Performance
- 7.4.9.3. Product Benchmarking
- 7.4.9.4. Strategic Initiatives
- 7.4.10. California Steel Industries
- 7.4.10.1. Participant's Overview
- 7.4.10.2. Financial Performance
- 7.4.10.3. Product Benchmarking
- 7.4.10.4. Strategic Initiatives
- 7.4.11. Metals USA
- 7.4.11.1. Participant's Overview
- 7.4.11.2. Financial Performance
- 7.4.11.3. Product Benchmarking
- 7.4.11.4. Strategic Initiatives
- 7.4.12. MST Steel Inc.
- 7.4.12.1. Participant's Overview
- 7.4.12.2. Financial Performance
- 7.4.12.3. Product Benchmarking
- 7.4.12.4. Strategic Initiatives
- 7.4.13. POSCO
- 7.4.13.1. Participant's Overview
- 7.4.13.2. Financial Performance
- 7.4.13.3. Product Benchmarking
- 7.4.13.4. Strategic Initiatives
- 7.4.14. SeAH Group
- 7.4.14.1. Participant's Overview
- 7.4.14.2. Financial Performance
- 7.4.14.3. Product Benchmarking
- 7.4.14.4. Strategic Initiatives
- 7.4.15. The Thompson Companies
- 7.4.15.1. Participant's Overview
- 7.4.15.2. Financial Performance
- 7.4.15.3. Product Benchmarking
- 7.4.15.4. Strategic Initiatives
- 7.4.16. AK Steel Corporation
- 7.4.16.1. Participant's Overview
- 7.4.16.2. Financial Performance
- 7.4.16.3. Product Benchmarking
- 7.4.16.4. Strategic Initiatives
- 7.4.17. Commercial Metals Company
- 7.4.17.1. Participant's Overview
- 7.4.17.2. Financial Performance
- 7.4.17.3. Product Benchmarking
- 7.4.17.4. Strategic Initiatives
- 7.4.18. EVRAZ plc.
- 7.4.18.1. Participant's Overview
- 7.4.18.2. Financial Performance
- 7.4.18.3. Product Benchmarking
- 7.4.18.4. Strategic Initiatives
- 7.4.19. GERDAU S.A.
- 7.4.19.1. Participant's Overview
- 7.4.19.2. Financial Performance
- 7.4.19.3. Product Benchmarking
- 7.4.19.4. Strategic Initiatives
- 7.4.20. JFE Steel Corporation.
- 7.4.20.1. Participant's Overview
- 7.4.20.2. Financial Performance
- 7.4.20.3. Product Benchmarking
- 7.4.20.4. Strategic Initiatives
- 7.4.1. JSW Steel
