|
|
市場調査レポート
商品コード
1611730
コーディング・マーキング装置市場規模、シェア、動向分析レポート:製品別、最終用途別、地域別、セグメント予測、2025年~2030年Coding And Marking Equipment Market Size, Share & Trends Analysis Report By Product (Continuous Inkjet Printer, Thermal Inkjet Printer, Piezo Inkjet Printer Laser Printer), By End Use, By Region, And Segment Forecasts, 2025 - 2030 |
||||||

|
|||||||
カスタマイズ可能
|
|||||||

| コーディング・マーキング装置市場規模、シェア、動向分析レポート:製品別、最終用途別、地域別、セグメント予測、2025年~2030年 |
|
出版日: 2024年11月18日
発行: Grand View Research
ページ情報: 英文 100 Pages
納期: 2~10営業日
|

全表示
- 概要
- 図表
- 目次
コーディング・マーキング装置市場の成長と動向:
Grand View Research, Inc.の最新レポートによると、世界のコーディング・マーキング装置市場規模は、2025年から2030年にかけてCAGR 6.1%を記録し、2030年には249億3,000万米ドルに達すると予測されています。
同市場の成長は、消費者の健康志向の高まりに起因しています。消費者の間で、包装されラベルが貼られた飲食品への嗜好が高まっていることが、特に飲食品メーカーにコーディング・マーキング装置の導入を促し、市場の成長を促進しています。
多機能インクジェットプリンターのコーディング・マーキング目的での採用は、予測期間中に大きな牽引力を獲得すると予想されます。多機能インクジェットプリンターは、スキャン、コピー、ファックス、印刷など様々な機能をサポートしているため、汎用性が高いです。さらに、多機能インクジェット・プリンターのコストは、従来のインクジェット・プリンターよりも低い傾向にあります。多機能インクジェットプリンターの運用コストは、消費電力やメンテナンスの必要性から一般的に高いが、USB、Bluetooth、Wi-Fi接続、LCDタッチスクリーンなどの機能により、非常にユーザーフレンドリーなものとなっています。そのため、中小企業や大企業は、コーディングやマーキングの目的で多機能インクジェット・プリンターを好んで使用しています。
しかし、コーディング・マーキング装置の導入に必要な設備投資が高額であることが、予測期間中、市場の主な抑制要因になると予想されます。特に中小企業や零細企業では、コーディング・マーキング装置の導入に必要な財源やインフラが不足しています。その一方で、コーディング・マーキング装置に関連する投資収益率(ROI)はほとんど定量化できないため、大手食品生産者がコーディング・マーキング装置を採用する意欲をそぐ要因にもなっています。
COVID-19パンデミックの発生は、コーディング・マーキング装置市場に深刻な打撃を与えました。ウイルスの蔓延を抑えるための予防措置として世界各地で実施された閉鎖措置は、原材料の供給と完成品の移動に影響を与えました。中国の工場の一時閉鎖も、コーディング・マーキング装置に使用されるインクの供給に影響を与えました。
コーディング・マーキング装置市場のレポートハイライト
- 機械システムとインクの厚さを制御し、プリントヘッドのつまずきを防止するソフトウェアと技術の進歩が、予測期間中に最新のコーディング・マーキング装置の採用を促進する決定的な役割を果たすと予想されます。
- コンティニュアスインクジェット(CIJ)プリンター分野は2024年に市場を独占し、予測期間中も市場を独占し続けると予想されます。コンティニュアスインクジェットプリンタに関連する使いやすさ、柔軟性の高さ、高速印刷は、このセグメントの成長にとって良い兆候です。
- 医薬品分野は、予測期間中に最も高いCAGRで成長すると予想されています。コーディング・マーキング装置は、製薬業界の既存企業のラベリングやパッケージングのニーズに応える上で重要な役割を果たします。
- 原材料の入手が容易であること、食品生産量の増加が止まらないこと、製品の高品質確保が重視されていることなどが、アジア太平洋地域の市場成長を促進すると予想されます。
- ブランドの海賊行為や偽造に対抗する取り組みの一環として、完成品の適切なラベリングに関する政府の厳しい規制が、アジア太平洋地域市場の成長を促進する上で決定的な役割を果たすと予想されます。
目次
第1章 調査手法と範囲
第2章 エグゼクティブサマリー
第3章 コーディング・マーキング装置市場の変数、動向、範囲
- 市場系統の見通し
- 市場力学
- 市場 促進要因分析
- 市場抑制要因分析
- 業界の課題
- 業界分析ツール
- PORTERの分析
- PESTEL分析
第4章 コーディング・マーキング装置市場:製品推定・動向分析
- セグメントダッシュボード
- コーディング・マーキング装置:製品変動分析、2024年および2030年
- 連続インクジェット(CIJ)プリンター
- サーマルインクジェット(TIJ)プリンター
- ピエゾインクジェットプリンター
- レーザーインクジェットプリンター
- その他
第5章 コーディング・マーキング装置:最終用途の推定・動向分析
- セグメントダッシュボード
- コーディング・マーキング装置市場:最終用途変動分析、2024年および2030年
- 食品・飲料
- 食品・飲料市場収益推計と予測、2018年~2030年
- 製薬
- 医薬品市場収益推計と予測、2018年-2030年
- 建設
- 建設市場収益推計と予測、2018年-2030年
- 化粧品
- 化粧品市場収益推計と予測、2018年~2030年
- その他
- その他の市場収益推計と予測、2018年-2030年
第6章 コーディング・マーキング装置市場:地域推定・動向分析
- コーディング・マーキング装置の市場シェア、地域別、2024年および2030年
- 北米
- 米国
- カナダ
- メキシコ
- 欧州
- 英国
- ドイツ
- フランス
- アジア太平洋
- 中国
- インド
- 日本
- オーストラリア
- 韓国
- ラテンアメリカ
- ブラジル
- 中東・アフリカ
- アラブ首長国連邦
- サウジアラビア王国
- 南アフリカ
第7章 競合情勢
- 企業分類
- 企業の市場ポジショニング
- 企業ヒートマップ分析
- 企業プロファイル/上場企業
- Danaher Corporation
- Domino Printing Sciences plc
- Hitachi, Ltd.
- Markem-Imaje, a Dover Company
- Matthews International Corporation
- Leibinger Group
- REA Systeme GmbH
- ProMach Inc.
- Koenig &Bauer Coding GmbH
- HSA Systems A/S
List of Tables
- Table 1 Global coding and marking equipment market, by region, 2018 - 2030 (USD Million)
- Table 2 Global coding and marking equipment market, by product, 2018 - 2030 (USD Million)
- Table 3 Global coding and marking equipment market, by end use, 2018 - 2030 (USD Million)
- Table 4 North America coding and marking equipment market, by region, 2018 - 2030 (USD Million)
- Table 5 North America coding and marking equipment market, by product, 2018 - 2030 (USD Million)
- Table 6 North America coding and marking equipment market, by end use type, 2018 - 2030 (USD Million)
- Table 7 U.S. coding and marking equipment market, by product, 2018 - 2030 (USD Million)
- Table 8 U.S. coding and marking equipment market, by end use, 2018 - 2030 (USD Million)
- Table 9 Canada coding and marking equipment market, by product, 2018 - 2030 (USD Million)
- Table 10 Canada coding and marking equipment market, by end use, 2018 - 2030 (USD Million)
- Table 11 Mexico coding and marking equipment market, by product, 2018 - 2030 (USD Million)
- Table 12 Mexico coding and marking equipment market, by end use, 2018 - 2030 (USD Million)
- Table 13 Europe coding and marking equipment market, by region, 2018 - 2030 (USD Million)
- Table 14 Europe coding and marking equipment market, by product, 2018 - 2030 (USD Million)
- Table 15 Europe coding and marking equipment market, by end use, 2018 - 2030 (USD Million)
- Table 16 U.K. coding and marking equipment market, by product, 2018 - 2030 (USD Million)
- Table 17 U.K. coding and marking equipment market, by end use, 2018 - 2030 (USD Million)
- Table 18 Germany coding and marking equipment market, by product, 2018 - 2030 (USD Million)
- Table 19 Germany coding and marking equipment market, by end use, 2018 - 2030 (USD Million)
- Table 20 France coding and marking equipment market, by product, 2018 - 2030 (USD Million)
- Table 21 France coding and marking equipment market, by end use, 2018 - 2030 (USD Million)
- Table 22 Asia Pacific coding and marking equipment market, by region, 2018 - 2030 (USD Million)
- Table 23 Asia Pacific coding and marking equipment market, by product, 2018 - 2030 (USD Million)
- Table 24 Asia Pacific coding and marking equipment market, by end use, 2018 - 2030 (USD Million)
- Table 25 China coding and marking equipment market, by product, 2018 - 2030 (USD Million)
- Table 26 China coding and marking equipment market, by end use, 2018 - 2030 (USD Million)
- Table 27 Japan coding and marking equipment market, by product, 2018 - 2030 (USD Million)
- Table 28 Japan coding and marking equipment market, by end use, 2018 - 2030 (USD Million)
- Table 29 India coding and marking equipment market, by product, 2018 - 2030 (USD Million)
- Table 30 India coding and marking equipment market, by end use, 2018 - 2030 (USD Million)
- Table 31 Australia coding and marking equipment market, by product, 2018 - 2030 (USD Million)
- Table 32 Australia coding and marking equipment market, by end use, 2018 - 2030 (USD Million)
- Table 33 South Korea coding and marking equipment market, by product, 2018 - 2030 (USD Million)
- Table 34 South Korea coding and marking equipment market, by end use, 2018 - 2030 (USD Million)
- Table 35 Latin America coding and marking equipment market, by region, 2018 - 2030 (USD Million)
- Table 36 Latin America coding and marking equipment market, by product, 2018 - 2030 (USD Million)
- Table 37 Latin America coding and marking equipment market, by end use, 2018 - 2030 (USD Million)
- Table 38 Brazil coding and marking equipment market, by product, 2018 - 2030 (USD Million)
- Table 39 Brazil coding and marking equipment market, by end use, 2018 - 2030 (USD Million)
- Table 40 MEA coding and marking equipment market, by region, 2018 - 2030 (USD Million)
- Table 41 MEA coding and marking equipment market, by product, 2018 - 2030 (USD Million)
- Table 42 MEA coding and marking equipment market, by end use, 2018 - 2030 (USD Million)
- Table 43 Saudi Arabia coding and marking equipment market, by product, 2018 - 2030 (USD Million)
- Table 44 Saudi Arabia coding and marking equipment market, by end use, 2018 - 2030 (USD Million)
- Table 45 UAE coding and marking equipment market, by product, 2018 - 2030 (USD Million)
- Table 46 UAE coding and marking equipment market, by end use, 2018 - 2030 (USD Million)
- Table 47 South Africa coding and marking equipment market, by product, 2018 - 2030 (USD Million)
- Table 48 South Africa coding and marking equipment market, by end use, 2018 - 2030 (USD Million)
List of Figures
- Fig. 1 Coding and marking equipment market segmentation
- Fig. 2 Market research process
- Fig. 3 Information procurement
- Fig. 4 Primary research pattern
- Fig. 5 Market research approaches
- Fig. 6 Value chain-based sizing & forecasting
- Fig. 7 Parent market analysis
- Fig. 8 Market formulation & validation
- Fig. 9 Coding and marking equipment market snapshot
- Fig. 10 Coding and marking equipment market segment snapshot
- Fig. 11 Coding and marking equipment market competitive landscape snapshot
- Fig. 12 Market research process
- Fig. 13 Market driver relevance analysis (Current & future impact)
- Fig. 14 Market restraint relevance analysis (Current & future impact)
- Fig. 15 Coding and marking equipment market: Product outlook key takeaways (USD Million)
- Fig. 16 Coding and marking equipment market: Product movement analysis 2024 & 2030 (USD Million)
- Fig. 17 Continuous Inkjet (CIJ) printer market revenue estimates and forecasts, 2018 - 2030 (USD Million)
- Fig. 18 Thermal Inkjet (CIJ) printer market revenue estimates and forecasts, 2018 - 2030 (USD Million)
- Fig. 19 Piezo Inkjet (CIJ) printer market revenue estimates and forecasts, 2018 - 2030 (USD Million)
- Fig. 20 Laser printer market revenue estimates and forecasts, 2018 - 2030 (USD Million)
- Fig. 21 Others market revenue estimates and forecasts, 2018 - 2030 (USD Million)
- Fig. 22 Coding and marking equipment market: Mobility outlook key takeaways (USD Million)
- Fig. 23 Coding and marking equipment market: End use industry outlook key takeaways (USD Million)
- Fig. 24 Coding and marking equipment market: End use industry movement analysis 2024 & 2030 (USD Million)
- Fig. 25 Food and beverage coding and marking equipment market revenue estimates and forecasts, 2018 - 2030 (USD Million)
- Fig. 26 Pharmaceutical coding and marking equipment market revenue estimates and forecasts, 2018 - 2030 (USD Million)
- Fig. 27 Construction coding and marking equipment market revenue estimates and forecasts, 2018 - 2030 (USD Million)
- Fig. 28 Cosmetics coding and marking equipment market revenue estimates and forecasts, 2018 - 2030 (USD Million)
- Fig. 29 Other coding and marking equipment market revenue estimates and forecasts, 2018 - 2030 (USD Million)
- Fig. 30 Coding and marking equipment market: Region outlook, 2024 & 2030 (USD Million)
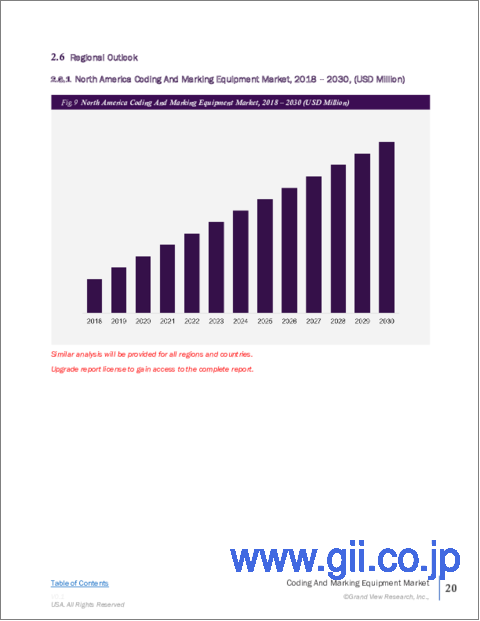
- Fig. 31 North America coding and marking equipment market estimates and forecasts, 2018 - 2030 (USD Million)
- Fig. 32 U.S. coding and marking equipment market estimates and forecasts, 2018 - 2030 (USD Million)
- Fig. 33 Canada coding and marking equipment market estimates and forecasts, 2018 - 2030 (USD Million)
- Fig. 34 Mexico coding and marking equipment market estimates and forecasts, 2018 - 2030 (USD Million)
- Fig. 35 Europe coding and marking equipment market estimates and forecasts, 2018 - 2030 (USD Million)
- Fig. 36 U.K. coding and marking equipment market estimates and forecasts, 2018 - 2030 (USD Million)
- Fig. 37 Germany coding and marking equipment market estimates and forecasts, 2018 - 2030 (USD Million)
- Fig. 38 France coding and marking equipment market estimates and forecasts, 2018 - 2030 (USD Million)
- Fig. 39 Asia Pacific coding and marking equipment market estimates and forecasts, 2018 - 2030 (USD Million)
- Fig. 40 China coding and marking equipment market estimates and forecasts, 2018 - 2030 (USD Million)
- Fig. 41 India coding and marking equipment market estimates and forecasts, 2018 - 2030 (USD Million)
- Fig. 42 Japan coding and marking equipment market estimates and forecasts, 2018 - 2030 (USD Million)
- Fig. 43 Australia coding and marking equipment market estimates and forecasts, 2018 - 2030 (USD Million)
- Fig. 44 South Korea coding and marking equipment market estimates and forecasts, 2018 - 2030 (USD Million)
- Fig. 45 Latin America coding and marking equipment market estimates and forecasts, 2018 - 2030 (USD Million)
- Fig. 46 Brazil coding and marking equipment market estimates and forecasts, 2018 - 2030 (USD Million)
- Fig. 47 MEA coding and marking equipment market estimates and forecasts, 2018 - 2030 (USD Million)
- Fig. 48 UAE coding and marking equipment market estimates and forecasts, 2018 - 2030 (USD Million)
- Fig. 49 Kingdom of Saudi Arabia coding and marking equipment market estimates and forecasts, 2018 - 2030 (USD Million)
- Fig. 50 South Africa coding and marking equipment market estimates and forecasts, 2018 - 2030 (USD Million)
- Fig. 51 Strategy framework
- Fig. 52 Company categorization
Coding And Marking Equipment Market Growth & Trends:
The global coding and marking equipment market size is expected to reach USD 24.93 billion by 2030, registering a CAGR of 6.1% from 2025 to 2030, according to a new report by Grand View Research, Inc. The growth of the market can be attributed to the growing health consciousness among consumers. The growing preference among consumers for packaged and labeled food and beverages is particularly encouraging food and beverage manufacturers to deploy coding and marking equipment, thereby driving the growth of the market.
The adoption of multifunctional inkjet printers for coding and marking purposes is expected to gain significant traction over the forecast period. Multifunctional inkjet printers are highly versatile as they support various functions, including scanning, copying, fax, and printing. Moreover, the cost of multifunctional inkjet printers also tends to be lower than that of conventional inkjet printers. Even though the operating cost of multifunctional inkjet printers is typically high owing to the power they consume and the maintenance they require; their features, such as USB, Bluetooth, and Wi-Fi connectivity, and LCD touchscreen, make them highly user-friendly. Hence, small businesses and enterprises prefer multifunctional inkjet printers for coding and marking purposes.
However, the high capital investment required for implementing coding and marking equipment is expected to emerge as a major market restraint over the forecast period. Small businesses and enterprises particularly lack the financial resources and the infrastructure required to implement coding and marking equipment. On the other hand, the return on investment (ROI) associated with coding and marking equipment is hardly quantifiable, which is also discouraging major food producers from adopting it.
The outbreak of the COVID-19 pandemic took a severe toll on the coding and marking equipment market. The lockdowns implemented in different parts of the world as a precaution to control the spread of the virus affected the supply of raw materials and the movement of finished products. The temporary closure of factories in China also affected the supply of the inks used in coding and marking machinery.
Coding And Marking Equipment Market Report Highlights:
- Advances in software and technology to control the mechanical systems and the thickness of the ink and to prevent the print head from stumbling are expected to play a decisive role in driving the adoption of the latest coding and marking equipment over the forecast period
- The continuous inkjet (CIJ) printer segment dominated the market in 2024 and is expected to continue dominating the market over the forecast period. The ease of use, greater flexibility, and high-speed printing associated with continuous inkjet printers bode well for the growth of the segment
- The pharmaceutical sector is expected to grow at the highest CAGR during the forecast period. Coding and marking equipment can play a vital role in catering to the labeling and packaging needs of the incumbents of the pharmaceutical industry
- Easy availability of raw materials, the unabated increase in food production, and the strong emphasis on ensuring high product quality are expected to propel the growth of the Asia Pacific regional market
- Stringent government regulations regarding appropriate labeling of the finished products as part of the efforts to counter brand piracy and counterfeiting are expected to play a decisive role in driving the growth of the Asia Pacific regional market
Table of Contents
Chapter 1. Methodology and Scope
- 1.1. Market Segmentation and Scope
- 1.2. Research Methodology
- 1.2.1. Information Procurement
- 1.3. Information or Data Analysis
- 1.4. Methodology
- 1.5. Research Scope and Assumptions
- 1.6. Market Formulation & Validation
- 1.7. Country Based Segment Share Calculation
- 1.8. List of Data Sources
Chapter 2. Executive Summary
- 2.1. Market Outlook
- 2.2. Segment Outlook
- 2.3. Competitive Insights
Chapter 3. Coding and Marking Equipment Market Variables, Trends, & Scope
- 3.1. Market Lineage Outlook
- 3.2. Market Dynamics
- 3.2.1. Market Driver Analysis
- 3.2.2. Market Restraint Analysis
- 3.2.3. Industry Challenge
- 3.3. Industry Analysis Tools
- 3.3.1. PORTER's Analysis
- 3.3.1.1. Bargaining power of the suppliers
- 3.3.1.2. Bargaining power of the buyers
- 3.3.1.3. Threats of substitution
- 3.3.1.4. Threats from new entrants
- 3.3.1.5. Competitive rivalry
- 3.3.2. PESTEL Analysis
- 3.3.2.1. Political landscape
- 3.3.2.2. Economic and social landscape
- 3.3.2.3. Technological landscape
- 3.3.1. PORTER's Analysis
Chapter 4. Coding and Marking Equipment Market: Product Estimates & Trend Analysis
- 4.1. Segment Dashboard
- 4.2. Coding and Marking Equipment: Product Movement Analysis, 2024 & 2030 (USD Million)
- 4.3. Continuous Inkjet (CIJ) Printer
- 4.3.1. Continuous Inkjet (CIJ) Printer Market Revenue Estimates and Forecasts, 2018 - 2030 (USD Million)
- 4.4. Thermal Inkjet (TIJ) Printer
- 4.4.1. Thermal Inkjet (TIJ) Printer Market Revenue Estimates and Forecasts, 2018 - 2030 (USD Million)
- 4.5. Piezo Inkjet Printer
- 4.5.1. Piezo Inkjet Printer Market Revenue Estimates and Forecasts, 2018 - 2030 (USD Million)
- 4.6. Laser Inkjet Printer
- 4.6.1. Laser Inkjet Printer Market Revenue Estimates and Forecasts, 2018 - 2030 (USD Million)
- 4.7. Others
- 4.7.1. Others Market Revenue Estimates and Forecasts, 2018 - 2030 (USD Million)
Chapter 5. Coding and Marking Equipment: End Use Estimates & Trend Analysis
- 5.1. Segment Dashboard
- 5.2. Coding and Marking Equipment Market: End Use Movement Analysis, 2024 & 2030 (USD Million)
- 5.3. Food and Beverage
- 5.3.1. Food and Beverage Market Revenue Estimates and Forecasts, 2018 - 2030 (USD Million)
- 5.4. Pharmaceutical
- 5.4.1. Pharmaceutical Market Revenue Estimates and Forecasts, 2018 - 2030 (USD Million)
- 5.5. Construction
- 5.5.1. Construction Market Revenue Estimates and Forecasts, 2018 - 2030 (USD Million)
- 5.6. Cosmetics
- 5.6.1. Cosmetics Market Revenue Estimates and Forecasts, 2018 - 2030 (USD Million
- 5.7. Others
- 5.7.1. Other Market Revenue Estimates and Forecasts, 2018 - 2030 (USD Million)
Chapter 6. Coding and Marking Equipment Market: Region Estimates & Trend Analysis)
- 6.1. Coding and Marking Equipment Market Share, By Region, 2024 & 2030 (USD Million)
- 6.2. North America
- 6.2.1. North America Coding and Marking Equipment Market Estimates and Forecasts, 2018 - 2030 (USD Million)
- 6.2.2. U.S.
- 6.2.2.1. U.S. Coding and Marking Equipment Market Estimates and Forecasts, 2018 - 2030 (USD Million)
- 6.2.3. Canada
- 6.2.3.1. Canada Coding and Marking Equipment Market Estimates and Forecasts, 2018 - 2030 (USD Million)
- 6.2.4. Mexico
- 6.2.4.1. Mexico Coding and Marking Equipment Market Estimates and Forecasts, 2018 - 2030 (USD Million)
- 6.3. Europe
- 6.3.1. Europe Coding and Marking Equipment Market Estimates and Forecasts, 2018 - 2030 (USD Million)
- 6.3.2. U.K.
- 6.3.2.1. U.K. Coding and Marking Equipment Market Estimates and Forecasts, 2018 - 2030 (USD Million)
- 6.3.3. Germany
- 6.3.3.1. Germany Coding and Marking Equipment Market Estimates and Forecasts, 2018 - 2030 (USD Million)
- 6.3.4. France
- 6.3.4.1. France Coding and Marking Equipment Market Estimates and Forecasts, 2018 - 2030 (USD Million)
- 6.4. Asia Pacific
- 6.4.1. Asia Pacific Coding and Marking Equipment Market Estimates and Forecasts, 2018 - 2030 (USD Million)
- 6.4.2. China
- 6.4.2.1. China Coding and Marking Equipment Market Estimates and Forecasts, 2018 - 2030 (USD Million)
- 6.4.3. India
- 6.4.3.1. India Coding and Marking Equipment Market Estimates and Forecasts, 2018 - 2030 (USD Million)
- 6.4.4. Japan
- 6.4.4.1. Japan Coding and Marking Equipment Market Estimates and Forecasts, 2018 - 2030 (USD Million)
- 6.4.5. Australia
- 6.4.5.1. Australia Coding and Marking Equipment Market Estimates and Forecasts, 2018 - 2030 (USD Million)
- 6.4.6. South Korea
- 6.4.6.1. South Korea Coding and Marking Equipment Market Estimates and Forecasts, 2018 - 2030 (USD Million)
- 6.5. Latin America
- 6.5.1. Latin America Coding and Marking Equipment Market Estimates and Forecasts, 2018 - 2030 (USD Million)
- 6.5.2. Brazil
- 6.5.2.1. Brazil Coding and Marking Equipment Market Estimates and Forecasts, 2018 - 2030 (USD Million)
- 6.6. MEA
- 6.6.1. MEA Coding and Marking Equipment Market Estimates and Forecasts, 2018 - 2030 (USD Million)
- 6.6.2. UAE
- 6.6.2.1. UAE Coding and Marking Equipment Market Estimates and Forecasts, 2018 - 2030 (USD Million)
- 6.6.3. Kingdom of Saudi Arabia
- 6.6.3.1. Kingdom of Saudi Arabia Coding and Marking Equipment Robots Market Estimates and Forecasts, 2018 - 2030 (USD Million)
- 6.6.4. South Africa
- 6.6.4.1. South Africa Coding and Marking Equipment Market Estimates and Forecasts, 2018 - 2030 (USD Million)
Chapter 7. Competitive Landscape
- 7.1. Company Categorization
- 7.2. Company Market Positioning
- 7.3. Company Heat Map Analysis
- 7.4. Company Profiles/Listing
- 7.4.1. Danaher Corporation
- 7.4.1.1. Participant's Overview
- 7.4.1.2. Financial Performance
- 7.4.1.3. Product Benchmarking
- 7.4.1.4. Strategic Initiatives
- 7.4.2. Domino Printing Sciences plc
- 7.4.2.1. Participant's Overview
- 7.4.2.2. Financial Performance
- 7.4.2.3. Product Benchmarking
- 7.4.2.4. Strategic Initiatives
- 7.4.3. Hitachi, Ltd.
- 7.4.3.1. Participant's Overview
- 7.4.3.2. Financial Performance
- 7.4.3.3. Product Benchmarking
- 7.4.3.4. Strategic Initiatives
- 7.4.4. Markem-Imaje, a Dover Company
- 7.4.4.1. Participant's Overview
- 7.4.4.2. Financial Performance
- 7.4.4.3. Product Benchmarking
- 7.4.4.4. Strategic Initiatives
- 7.4.5. Matthews International Corporation
- 7.4.5.1. Participant's Overview
- 7.4.5.2. Financial Performance
- 7.4.5.3. Product Benchmarking
- 7.4.5.4. Strategic Initiatives
- 7.4.6. Leibinger Group
- 7.4.6.1. Participant's Overview
- 7.4.6.2. Financial Performance
- 7.4.6.3. Product Benchmarking
- 7.4.6.4. Strategic Initiatives
- 7.4.7. REA Systeme GmbH
- 7.4.7.1. Participant's Overview
- 7.4.7.2. Financial Performance
- 7.4.7.3. Product Benchmarking
- 7.4.7.4. Strategic Initiatives
- 7.4.8. ProMach Inc.
- 7.4.8.1. Participant's Overview
- 7.4.8.2. Financial Performance
- 7.4.8.3. Product Benchmarking
- 7.4.8.4. Strategic Initiatives
- 7.4.9. Koenig & Bauer Coding GmbH
- 7.4.9.1. Participant's Overview
- 7.4.9.2. Financial Performance
- 7.4.9.3. Product Benchmarking
- 7.4.9.4. Strategic Initiatives
- 7.4.10. HSA Systems A/S
- 7.4.10.1. Participant's Overview
- 7.4.10.2. Financial Performance
- 7.4.10.3. Product Benchmarking
- 7.4.10.4. Strategic Initiatives
- 7.4.1. Danaher Corporation
