|
|
市場調査レポート
商品コード
1588717
身体増強フィラーの市場規模、シェア、動向分析レポート:製品別、用途別、プレフィルドシリンジ別、地域別、セグメント予測、2025年~2030年Body Augmentation Fillers Market Size, Share & Trends Analysis Report By Product (Hyaluronic Acid, Calcium Hydroxylapatite ), By Application, By Pre-filled Syringes, By Region, And Segment Forecasts, 2025 - 2030 |
||||||

|
|||||||
カスタマイズ可能
|
|||||||

| 身体増強フィラーの市場規模、シェア、動向分析レポート:製品別、用途別、プレフィルドシリンジ別、地域別、セグメント予測、2025年~2030年 |
|
出版日: 2024年10月28日
発行: Grand View Research
ページ情報: 英文 150 Pages
納期: 2~10営業日
|

全表示
- 概要
- 図表
- 目次
身体増強フィラー市場の成長と動向:
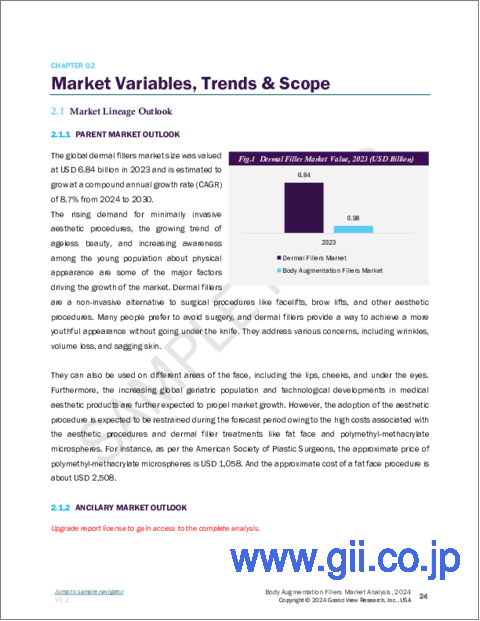
Grand View Research, Inc.の最新レポートによると、世界の身体増強フィラー市場規模は2030年までに30億3,000万米ドルに達すると予測され、2025年から2030年にかけて17.8%のCAGRで成長すると予測されています。
非侵襲的な美容施術に対する需要の増加が、主に市場成長の原動力となっています。社会規範が進化するにつれて、外科的介入を受けることなく、手、胸、臀部などの身体部位の構造を改善することによって身体的外観を向上させたいという個人の受け入れと願望が高まっています。この動向は特に若い層で広まっており、彼らは最小限のダウンタイムで即効性のある豊胸フィラーによる美的向上を求める傾向が強くなっています。
身体増大フィラー技術の進歩はこの成長に大きく寄与しており、最新のフィラーはより長持ちする効果と改善された安全性プロファイルを提供し、消費者にとってより魅力的なものとなっています。ASPSが発表した2023年の手術統計によると、豊胸手術は合計304,181件で、初回埋入とインプラントの再置換の両方を含んでいます。さらに、乳房吊り上げ術の件数は大幅に増加し、合計153,600件で、前年と比較して7%増加しました。
個人の美とセルフケアに関する意識の高まりが市場成長に寄与しています。ソーシャル・メディアや有名人文化の影響により、個人はヒアルロン酸フィラーによる美容強化を追求し、希望の外見を手に入れる意欲が高まっています。この外見への関心の高まりは、手の若返り、豊胸、豊尻、その他の豊胸治療を含む様々な豊胸手術への需要の急増につながった。2024年7月、臀部増大に対するHA皮膚フィラーの安全性と有効性を実証する5年間の研究が終了しました。イタリアとアラブ首長国連邦で、HYAcorp MLF1とMLF2を使用した91人の患者を対象に実施されたこの調査では、従来のインプラントを使用した方法と比較して有害事象のリスクが低いことが強調され、約4年7ヶ月の追跡調査期間にわたって、非外科的な臀部強化に対するHAフィラーの高い安全性と有効性が確認されました。
体増大フィラー市場レポートハイライト:
- ヒアルロン酸(HA)セグメントは、2024年に79.8%の最大収益シェアで市場をリードし、予測期間中に最も速いCAGRで成長すると予測されます。これは、その生体適合性と自然な仕上がりを提供する能力、および低侵襲の美容整形に対する消費者の需要の増加によるものです。
- 用途別では、手の若返り分野が2024年に44.7%の最大売上シェアで市場をリードしたが、これは手の見た目を改善しようとする高齢化した人々の間で美容処置の需要が増加していることと、より長持ちし自然な仕上がりを提供するフィラー技術の進歩によるものです。
- 用途別では、美的向上に対する消費者の需要の増加や、ダウンタイムを最小限に抑えた非外科的処置の人気の高まりにより、臀部増大分野が予測期間中に最も速いCAGRで成長する見込みです。
- プレフィルドシリンジに基づくと、5ml未満のセグメントは2024年に最大の収益シェアを占めました。これは、市場成長に大きく貢献する、改善された安全性プロファイルと長持ちする結果を提供するフィラー製剤の進歩によるものです。
- プレフィルドシリンジに基づくと、10mlセグメントは予測期間中に最も速いCAGRで成長することが予想されます。これは、低侵襲の美容整形に対する需要の増加と、効率性を高め、塗布時の無駄を減らす、すぐに使える製品の利便性のためです。
- 2024年3月、Prollenium Medical Technologies社はRevanesse製品群にRevise+という新たな製品を追加しました。この皮膚充填剤は、涙袋のような敏感なスポットの治療を目的としています。高分子ヒアルロン酸で作られ、12mg HA/mlの濃度が特徴で、眼窩周囲の治療に最適です。Revise+は、ソフトで柔軟性のあるジェル状で、膨潤が少なく、効果的な組織統合と粘性を保証し、表層と深層の両方の眼窩周囲への適用に適していると評価されています。
目次
第1章 調査手法と範囲
第2章 エグゼクティブサマリー
第3章 身体増強フィラー市場の変数、動向、範囲
- 市場系統の見通し
- 親市場の見通し
- 関連/補助的な市場見通し。
- 市場力学
- 市場牽引要因分析
- 市場抑制要因分析
- 身体増強フィラー市場分析ツール
- 業界分析- ポーターのファイブフォース分析
- PESTEL分析
第4章 身体増強フィラー市場:製品推定・動向分析
- セグメントダッシュボード
- 世界の身体増強フィラー市場の製品変動分析
- 2018年から2030年までの製品別世界身体増強フィラー市場規模と動向分析
- ヒアルロン酸(HA)
- カルシウムヒドロキシアパタイト(CaHA)
- ポリメチルメタクリレート(PMMA)とポリカプロラクトン(PCL)
第5章 身体増強フィラー市場:用途推定・動向分析
- セグメントダッシュボード
- 世界の身体増強フィラー市場の用途変動分析
- 2018年から2030年までの身体増強フィラーの世界市場規模と動向分析、用途別
- 手の若返り
- 豊胸手術
- 臀部増強術
- その他
第6章 身体増強フィラー市場:プレフィルドシリンジの推定・動向分析
- セグメントダッシュボード
- 世界の身体増強フィラー市場プレフィルドシリンジ変動分析
- 2018年から2030年までのプレフィルドシリンジ別身体増強フィラーの世界市場規模と動向分析
- 5ml未満
- 10ml
- 20ml
第7章 身体増強フィラー市場:地域推定・動向分析
- 地域別市場シェア分析、2024年および2030年
- 地域市場ダッシュボード
- 市場規模、予測動向分析、2018年から2030年:
- 北米
- 米国
- カナダ
- メキシコ
- 欧州
- 英国
- ドイツ
- フランス
- イタリア
- スペイン
- デンマーク
- スウェーデン
- ノルウェー
- アジア太平洋
- 日本
- 中国
- インド
- オーストラリア
- 韓国
- タイ
- ラテンアメリカ
- ブラジル
- アルゼンチン
- 中東・アフリカ
- トルコ
- イラン
- 南アフリカ
- サウジアラビア
- アラブ首長国連邦
- クウェート
第8章 競合情勢
- 企業/競合の分類
- 戦略マッピング
- 企業市況分析、2024年
- 企業プロファイル/上場企業
- AbbVie
- Galderma
- Merz GmbH and Co. KGaA
- IBSA Farmaceutici Italia Srl
- Teoxane
- Sinclair
- BioScience GmbH
- Hugel
- BioPlus
- Medytox, Inc.
List of Tables
- Table 1 List of abbreviation
- Table 2 Global body augmentation fillers market, by region, 2018 - 2030 (USD Million)
- Table 3 Global body augmentation fillers market, by product, 2018 - 2030 (USD Million)
- Table 4 Global body augmentation fillers market, by application, 2018 - 2030 (USD Million)
- Table 5 Global body augmentation fillers market, by pre-filled syringes, 2018 - 2030 (USD Million)
- Table 6 North America body augmentation fillers market, by country, 2018 - 2030 (USD Million)
- Table 7 North America body augmentation fillers market, by product, 2018 - 2030 (USD Million)
- Table 8 North America body augmentation fillers market, by application, 2018 - 2030 (USD Million)
- Table 9 North America body augmentation fillers market, by pre-filled syringes, 2018 - 2030 (USD Million)
- Table 10 U.S body augmentation fillers market, by product, 2018 - 2030 (USD Million)
- Table 11 U.S body augmentation fillers market, by application, 2018 - 2030 (USD Million)
- Table 12 U.S body augmentation fillers market, by pre-filled syringes, 2018 - 2030 (USD Million)
- Table 13 Canada body augmentation fillers market, by product, 2018 - 2030 (USD Million)
- Table 14 Canada body augmentation fillers market, by application, 2018 - 2030 (USD Million)
- Table 15 Canada body augmentation fillers market, by pre-filled syringes, 2018 - 2030 (USD Million)
- Table 16 Mexico body augmentation fillers market, by product, 2018 - 2030 (USD Million)
- Table 17 Mexico body augmentation fillers market, by application, 2018 - 2030 (USD Million)
- Table 18 Mexico body augmentation fillers market, by pre-filled syringes, 2018 - 2030 (USD Million)
- Table 19 Europe body augmentation fillers market, by country, 2018 - 2030 (USD Million)
- Table 20 Europe body augmentation fillers market, by product, 2018 - 2030 (USD Million)
- Table 21 Europe body augmentation fillers market, by application, 2018 - 2030 (USD Million)
- Table 22 Europe body augmentation fillers market, by pre-filled syringes, 2018 - 2030 (USD Million)
- Table 23 UK body augmentation fillers market, by product, 2018 - 2030 (USD Million)
- Table 24 UK body augmentation fillers market, by application, 2018 - 2030 (USD Million)
- Table 25 UK body augmentation fillers market, by pre-filled syringes, 2018 - 2030 (USD Million)
- Table 26 Germany body augmentation fillers market, by product, 2018 - 2030 (USD Million)
- Table 27 Germany body augmentation fillers market, by application, 2018 - 2030 (USD Million)
- Table 28 Germany body augmentation fillers market, by pre-filled syringes, 2018 - 2030 (USD Million)
- Table 29 France body augmentation fillers market, by product, 2018 - 2030 (USD Million)
- Table 30 France body augmentation fillers market, by application, 2018 - 2030 (USD Million)
- Table 31 France body augmentation fillers market, by pre-filled syringes, 2018 - 2030 (USD Million)
- Table 32 Italy body augmentation fillers market, by product, 2018 - 2030 (USD Million)
- Table 33 Italy body augmentation fillers market, by application, 2018 - 2030 (USD Million)
- Table 34 Italy body augmentation fillers market, by pre-filled syringes, 2018 - 2030 (USD Million)
- Table 35 Spain body augmentation fillers market, by product, 2018 - 2030 (USD Million)
- Table 36 Spain body augmentation fillers market, by application, 2018 - 2030 (USD Million)
- Table 37 Spain body augmentation fillers market, by pre-filled syringes, 2018 - 2030 (USD Million)
- Table 38 Denmark body augmentation fillers market, by product, 2018 - 2030 (USD Million)
- Table 39 Denmark body augmentation fillers market, by application, 2018 - 2030 (USD Million)
- Table 40 Denmark body augmentation fillers market, by pre-filled syringes, 2018 - 2030 (USD Million)
- Table 41 Sweden body augmentation fillers market, by product, 2018 - 2030 (USD Million)
- Table 42 Sweden body augmentation fillers market, by application, 2018 - 2030 (USD Million)
- Table 43 Sweden body augmentation fillers market, by pre-filled syringes, 2018 - 2030 (USD Million)
- Table 44 Norway body augmentation fillers market, by product, 2018 - 2030 (USD Million)
- Table 45 Norway body augmentation fillers market, by application, 2018 - 2030 (USD Million)
- Table 46 Norway body augmentation fillers market, by pre-filled syringes, 2018 - 2030 (USD Million)
- Table 47 Asia Pacific body augmentation fillers market, by country, 2018 - 2030 (USD Million)
- Table 48 Asia Pacific body augmentation fillers market, by product, 2018 - 2030 (USD Million)
- Table 49 Asia Pacific body augmentation fillers market, by application, 2018 - 2030 (USD Million)
- Table 50 Asia Pacific body augmentation fillers market, by pre-filled syringes, 2018 - 2030 (USD Million)
- Table 51 Japan body augmentation fillers market, by type, 2018 - 2030 (USD Million)
- Table 52 Japan body augmentation fillers market, by product, 2018 - 2030 (USD Million)
- Table 53 Japan body augmentation fillers market, by application, 2018 - 2030 (USD Million)
- Table 54 Japan body augmentation fillers market, by pre-filled syringes, 2018 - 2030 (USD Million)
- Table 55 China body augmentation fillers market, by product, 2018 - 2030 (USD Million)
- Table 56 China body augmentation fillers market, by application, 2018 - 2030 (USD Million)
- Table 57 China body augmentation fillers market, by pre-filled syringes, 2018 - 2030 (USD Million)
- Table 58 India body augmentation fillers market, by product, 2018 - 2030 (USD Million)
- Table 59 India body augmentation fillers market, by application, 2018 - 2030 (USD Million)
- Table 60 India body augmentation fillers market, by end-use, 2018 - 2030 (USD Million)
- Table 61 Australia body augmentation fillers market, by product, 2018 - 2030 (USD Million)
- Table 62 Australia body augmentation fillers market, by application, 2018 - 2030 (USD Million)
- Table 63 Australia body augmentation fillers market, by pre-filled syringes, 2018 - 2030 (USD Million)
- Table 64 South Korea body augmentation fillers market, by product, 2018 - 2030 (USD Million)
- Table 65 South Korea body augmentation fillers market, by application, 2018 - 2030 (USD Million)
- Table 66 South Korea body augmentation fillers market, by pre-filled syringes, 2018 - 2030 (USD Million)
- Table 67 Thailand body augmentation fillers market, by product, 2018 - 2030 (USD Million)
- Table 68 Thailand body augmentation fillers market, by application, 2018 - 2030 (USD Million)
- Table 69 Thailand body augmentation fillers market, by pre-filled syringes, 2018 - 2030 (USD Million)
- Table 70 Latin America body augmentation fillers market, by country, 2018 - 2030 (USD Million)
- Table 71 Latin America body augmentation fillers market, by product, 2018 - 2030 (USD Million)
- Table 72 Latin America body augmentation fillers market, by application, 2018 - 2030 (USD Million)
- Table 73 Latin America body augmentation fillers market, by pre-filled syringes, 2018 - 2030 (USD Million)
- Table 74 Brazil body augmentation fillers market, by product, 2018 - 2030 (USD Million)
- Table 75 Brazil body augmentation fillers market, by application, 2018 - 2030 (USD Million)
- Table 76 Brazil body augmentation fillers market, by pre-filled syringes, 2018 - 2030 (USD Million)
- Table 77 Argentina body augmentation fillers market, by product, 2018 - 2030 (USD Million)
- Table 78 Argentina body augmentation fillers market, by application, 2018 - 2030 (USD Million)
- Table 79 Argentina body augmentation fillers market, by pre-filled syringes, 2018 - 2030 (USD Million)
- Table 80 MEA body augmentation fillers market, by country, 2018 - 2030 (USD Million)
- Table 81 MEA body augmentation fillers market, by product, 2018 - 2030 (USD Million)
- Table 82 MEA body augmentation fillers market, by application, 2018 - 2030 (USD Million)
- Table 83 MEA body augmentation fillers market, by pre-filled syringes, 2018 - 2030 (USD Million)
- Table 84 Turkey body augmentation fillers market, by product, 2018 - 2030 (USD Million)
- Table 85 Turkey body augmentation fillers market, by application, 2018 - 2030 (USD Million)
- Table 86 Turkey body augmentation fillers market, by pre-filled syringes, 2018 - 2030 (USD Million)
- Table 87 Iran body augmentation fillers market, by product, 2018 - 2030 (USD Million)
- Table 88 Iran body augmentation fillers market, by application, 2018 - 2030 (USD Million)
- Table 89 Iran body augmentation fillers market, by pre-filled syringes, 2018 - 2030 (USD Million)
- Table 90 South Africa body augmentation fillers market, by product, 2018 - 2030 (USD Million)
- Table 91 South Africa body augmentation fillers market, by application, 2018 - 2030 (USD Million)
- Table 92 South Africa body augmentation fillers market, by pre-filled syringes, 2018 - 2030 (USD Million)
- Table 93 Saudi Arabia body augmentation fillers market, by product, 2018 - 2030 (USD Million)
- Table 94 Saudi Arabia body augmentation fillers market, by application, 2018 - 2030 (USD Million)
- Table 95 Saudi Arabia body augmentation fillers market, by pre-filled syringes, 2018 - 2030 (USD Million)
- Table 96 UAE body augmentation fillers market, by product, 2018 - 2030 (USD Million)
- Table 97 UAE body augmentation fillers market, by application, 2018 - 2030 (USD Million)
- Table 98 UAE body augmentation fillers market, by pre-filled syringes, 2018 - 2030 (USD Million)
- Table 99 Kuwait body augmentation fillers market, by product, 2018 - 2030 (USD Million)
- Table 100 Kuwait body augmentation fillers market, by application, 2018 - 2030 (USD Million)
- Table 101 Kuwait body augmentation fillers market, by pre-filled syringes, 2018 - 2030 (USD Million)
List of Figures
- Fig. 1 Body augmentation fillers market segmentation
- Fig. 2 Data analysis models
- Fig. 3 Market formulation and validation
- Fig. 4 Data validating & publishing
- Fig. 5 Market research process
- Fig. 6 Information procurement
- Fig. 7 Primary research
- Fig. 8 Value-chain-based sizing & forecasting
- Fig. 9 QFD modelling for market share assessment
- Fig. 10 Market formulation & validation
- Fig. 11 Commodity flow analysis
- Fig. 12 Market outlook
- Fig. 13 Segment snapshot-1
- Fig. 14 Segment snapshot-2
- Fig. 15 Competitive landscape snapshot
- Fig. 16 Market trends & outlook
- Fig. 17 Porter's five force analysis
- Fig. 18 PESTEL analysis
- Fig. 19 Body augmentation fillers market: Product outlook key takeaways
- Fig. 20 Body augmentation fillers market: Product movement analysis
- Fig. 21 Hyaluronic acid (HA) market estimates and forecasts, 2018 - 2030 (USD Million)
- Fig. 22 Calcium hydroxylapatite (CaHA) market estimates and forecasts, 2018 - 2030 (USD Million)
- Fig. 23 Polymethylmethacrylate (PMMA) & polycaprolactone (PCL) market estimates and forecasts, 2018 - 2030 (USD Million)
- Fig. 24 Body augmentation fillers market: Application outlook key takeaways
- Fig. 25 Body augmentation fillers market: Application movement analysis
- Fig. 26 Hand rejuvenation market estimates and forecasts, 2018 - 2030 (USD Million)
- Fig. 27 Breast augmentation market estimates and forecasts, 2018 - 2030 (USD Million)
- Fig. 28 Buttock augmentation market estimates and forecasts, 2018 - 2030 (USD Million)
- Fig. 29 Body augmentation fillers market: Pre-filled syringes outlook key takeaways
- Fig. 30 Body augmentation fillers market: Pre-filled syringes movement analysis
- Fig. 31 <5ml market estimates and forecasts, 2018 - 2030 (USD Million)
- Fig. 32 10ml market estimates and forecasts, 2018 - 2030 (USD Million)
- Fig. 33 20ml market estimates and forecasts, 2018 - 2030 (USD Million)
- Fig. 34 Regional marketplace outlook, 2024 & 2030 (USD million)
- Fig. 35 Regional marketplace: Key takeaways
- Fig. 36 Global body augmentation fillers market: Regional outlook and key takeaways
- Fig. 37 Global body augmentation fillers market: Regional movement analysis
- Fig. 38 North America body augmentation fillers market estimates and forecasts, 2018 - 2030 (USD Million)
- Fig. 39 US body augmentation fillers market estimates and forecasts, 2018 - 2030 (USD Million)
- Fig. 40 Canada body augmentation fillers market estimates and forecasts, 2018 - 2030 (USD Million)
- Fig. 41 Mexico body augmentation fillers market estimates and forecasts, 2018 - 2030 (USD Million)
- Fig. 42 Europe body augmentation fillers market estimates and forecasts, 2018 - 2030 (USD Million)
- Fig. 43 UK body augmentation fillers market estimates and forecasts, 2018 - 2030 (USD Million)
- Fig. 44 Germany body augmentation fillers market estimates and forecasts, 2018 - 2030 (USD Million)
- Fig. 45 France body augmentation fillers market estimates and forecasts, 2018 - 2030 (USD Million)
- Fig. 46 Italy body augmentation fillers market estimates and forecasts, 2018 - 2030 (USD Million)
- Fig. 47 Spain body augmentation fillers market estimates and forecasts, 2018 - 2030 (USD Million)
- Fig. 48 Denmark body augmentation fillers market estimates and forecasts, 2018 - 2030 (USD Million)
- Fig. 49 Sweden body augmentation fillers market estimates and forecasts, 2018 - 2030 (USD Million)
- Fig. 50 Norway body augmentation fillers market estimates and forecasts, 2018 - 2030 (USD Million)
- Fig. 51 Asia Pacific body augmentation fillers market estimates and forecasts, 2018 - 2030 (USD Million)
- Fig. 52 China body augmentation fillers market estimates and forecasts, 2018 - 2030 (USD Million)
- Fig. 53 Japan body augmentation fillers market estimates and forecasts, 2018 - 2030 (USD Million)
- Fig. 54 India body augmentation fillers market estimates and forecasts, 2018 - 2030 (USD Million)
- Fig. 55 Thailand body augmentation fillers market estimates and forecasts, 2018 - 2030 (USD Million)
- Fig. 56 South Korea cannula market estimates and forecasts, 2018 - 2030 (USD Million)
- Fig. 57 Australia body augmentation fillers market estimates and forecasts, 2018 - 2030 (USD Million)
- Fig. 58 Latin America body augmentation fillers market estimates and forecasts, 2018 - 2030 (USD Million)
- Fig. 59 Brazil body augmentation fillers market estimates and forecasts, 2018 - 2030 (USD Million)
- Fig. 60 Argentina body augmentation fillers market estimates and forecasts, 2018 - 2030 (USD Million)
- Fig. 61 Middle East and Africa body augmentation fillers market estimates and forecasts, 2018 - 2030 (USD Million)
- Fig. 62 Turkey body augmentation fillers market estimates and forecasts, 2018 - 2030 (USD Million)
- Fig. 63 Iran body augmentation fillers market estimates and forecasts, 2018 - 2030 (USD Million)
- Fig. 64 South Africa body augmentation fillers market estimates and forecasts, 2018 - 2030 (USD Million)
- Fig. 65 Saudi Arabia body augmentation fillers market estimates and forecasts, 2018 - 2030 (USD Million)
- Fig. 66 UAE body augmentation fillers market estimates and forecasts, 2018 - 2030 (USD Million)
- Fig. 67 Kuwait body augmentation fillers market estimates and forecasts, 2018 - 2030 (USD Million)
Body Augmentation Fillers Market Growth & Trends:
The global body augmentation fillers market size is anticipated to reach USD 3.03 billion by 2030 and is projected to grow at a CAGR of 17.8% from 2025 to 2030, according to a new report by Grand View Research, Inc. The increasing demand for non-invasive cosmetic procedures primarily drives market growth. As societal norms evolve, there is a growing acceptance and desire among individuals to enhance their physical appearance by improving the structure of their body parts, such as hands, breasts, and buttocks, without undergoing surgical interventions. This trend is particularly prevalent among younger demographics, who are more inclined to seek out aesthetic enhancements through body augmentation fillers that offer immediate results with minimal downtime.
Advancements in body augmentation filler technology contribute significantly to this growth, as modern fillers provide longer-lasting effects and improved safety profiles, making them more appealing to consumers. Based on the 2023 procedural statistics released by the ASPS, there were a total of 304,181 breast augmentation procedures, encompassing both initial placements and revisions of implants. Furthermore, there was a significant uptick in the number of breast lifts performed, totaling 153,600, representing a 7 percent increase compared to the previous year.
Rising awareness regarding personal aesthetics and self-care contributes to market growth. With the influence of social media and celebrity culture, individuals are increasingly motivated to pursue cosmetic enhancements through hyaluronic acid fillers to achieve desired looks. This heightened focus on physical appearance led to a surge in demand for various body augmentation procedures, including hand rejuvenation, breast augmentation, buttock augmentation, and other body augmentation treatments. In July 2024, a five-year study was concluded, demonstrating the safety and effectiveness of HA dermal fillers for buttock augmentation. Conducted in Italy and the UAE on 91 patients using HYAcorp MLF1 and MLF2, the research highlighted a lower risk of adverse events compared to traditional implant-based methods, confirming the high safety and efficacy of HA fillers for nonsurgical gluteal enhancement over a follow-up period of almost 4 years and 7 months.
Body Augmentation Fillers Market Report Highlights:
- The Hyaluronic acid (HA) segment led the market with the largest revenue share of 79.8% in 2024, and is expected to grow at the fastest CAGR over the forecast period, due to its biocompatibility and ability to provide natural-looking results, as well as increase consumer demand for minimally invasive cosmetic procedures.
- Based on application, the hand rejuvenation segment led the market with the market with the largest revenue share of 44.7% in 2024, due to increasing demand for aesthetic procedures among aging populations seeking to improve the appearance of their hands, along with advancements in filler technologies that offer longer-lasting and more natural-looking results
- Based on application, the buttock augmentation segment is expected to grow at the fastest CAGR over the forecast period owing to increasing consumer demand for aesthetic enhancements and the growing popularity of non-surgical procedures that offer minimal downtime.
- Based on pre-filled syringes, the <5ml segment accounted for the largest revenue share in 2024, due to advancements in filler formulations that offer improved safety profiles and longer-lasting results that contribute significantly to market growth.
- Based on pre-filled syringes, the 10ml segment is expected to grow at the fastest CAGR over the forecast period, owing to increasing demand for minimally invasive cosmetic procedures and the convenience of ready-to-use products that enhance efficiency and reduce waste during application.
- In March 2024, Prollenium Medical Technologies introduced a new addition to their Revanesse line, called Revise+. This dermal filler is aimed at treating sensitive spots such as the tear trough. It's made with high molecular weight hyaluronic acid, featuring a 12mg HA/ml concentration, perfect for periorbital treatments. Revise+ is praised for its soft, malleable gel form, which ensures low swelling and effective tissue integration and viscosity, making it suitable for both superficial and deep periorbital applications.
Table of Contents
Chapter 1. Methodology and Scope
- 1.1. Market Segmentation & Scope
- 1.2. Market Definitions
- 1.2.1. Product Segment
- 1.2.2. Application Segment
- 1.2.3. Pre-filled Syringes Segment
- 1.3. Information analysis
- 1.3.1. Market formulation & data visualization
- 1.4. Data validation & publishing
- 1.5. Information Procurement
- 1.5.1. Primary Research
- 1.6. Information or Data Analysis
- 1.7. Market Formulation & Validation
- 1.8. Market Model
- 1.9. Total Market: CAGR Calculation
- 1.10. Objectives
Chapter 2. Executive Summary
- 2.1. Market Outlook
- 2.2. Segment Snapshot
- 2.3. Competitive Insights Landscape
Chapter 3. Body Augmentation Fillers Market Variables, Trends & Scope
- 3.1. Market Lineage Outlook
- 3.1.1. Parent market outlook
- 3.1.2. Related/ancillary market outlook.
- 3.2. Market Dynamics
- 3.2.1. Market driver analysis
- 3.2.1.1. Increasing demand for aesthetic procedures
- 3.2.1.2. Advancements in filler technologies
- 3.2.1.3. Growing awareness of non-surgical cosmetic enhancements
- 3.2.2. Market restraint analysis
- 3.2.2.1. High costs
- 3.2.2.2. Regulatory challenges
- 3.2.1. Market driver analysis
- 3.3. Body Augmentation Fillers Market Analysis Tools
- 3.3.1. Industry Analysis - Porter's
- 3.3.2. PESTEL Analysis
Chapter 4. Body Augmentation Fillers Market: Product Estimates & Trend Analysis
- 4.1. Segment Dashboard
- 4.2. Global Body Augmentation Fillers Market Product Movement Analysis
- 4.3. Global Body Augmentation Fillers Market Size & Trend Analysis, by Product 2018 to 2030 (USD Million)
- 4.4. Hyaluronic Acid (HA)
- 4.4.1. Hyaluronic acid (HA) market estimates and forecasts, 2018 to 2030 (USD Million)
- 4.5. Calcium Hydroxylapatite (CaHA)
- 4.5.1. Calcium hydroxylapatite (CaHA) market estimates and forecasts, 2018 to 2030 (USD Million)
- 4.6. Polymethylmethacrylate (PMMA) & Polycaprolactone (PCL)
- 4.6.1. Polymethylmethacrylate (PMMA) & polycaprolactone (PCL) market estimates and forecasts, 2018 to 2030 (USD Million)
Chapter 5. Body Augmentation Fillers Market: Application Estimates & Trend Analysis
- 5.1. Segment Dashboard
- 5.2. Global Body Augmentation Fillers Market Application Movement Analysis
- 5.3. Global Body Augmentation Fillers Market Size & Trend Analysis, by Application, 2018 to 2030 (USD Million)
- 5.4. Hand Rejuvenation
- 5.4.1. Hand rejuvenation market estimates and forecasts, 2018 to 2030 (USD Million)
- 5.5. Breast Augmentation
- 5.5.1. Breast augmentation market estimates and forecasts, 2018 to 2030 (USD Million)
- 5.6. Buttock Augmentation
- 5.6.1. Buttock augmentation market estimates and forecasts, 2018 to 2030 (USD Million)
- 5.7. Others
- 5.7.1. Others market estimates and forecasts, 2018 to 2030 (USD Million)
Chapter 6. Body Augmentation Fillers Market: Pre-filled Syringes Estimates & Trend Analysis
- 6.1. Segment Dashboard
- 6.2. Global Body Augmentation Fillers Market Pre-filled Syringes Movement Analysis
- 6.3. Global Body Augmentation Fillers Market Size & Trend Analysis, by Pre-filled Syringes 2018 to 2030 (USD Million)
- 6.4. <5ml
- 6.4.1. <5ml market estimates and forecasts, 2018 to 2030 (USD Million)
- 6.5. 10ml
- 6.5.1. 10ml market estimates and forecasts, 2018 to 2030 (USD Million)
- 6.6. 20ml
- 6.6.1. 20ml market estimates and forecasts, 2018 to 2030 (USD Million)
Chapter 7. Body Augmentation Fillers Market: Regional Estimates & Trend Analysis
- 7.1. Regional Market Share Analysis, 2024 & 2030
- 7.2. Regional Market Dashboard
- 7.3. Market Size, & Forecasts Trend Analysis, 2018 to 2030:
- 7.4. North America
- 7.4.1. North America market estimates and forecasts, 2018 to 2030 (USD Million)
- 7.4.2. U.S.
- 7.4.2.1. Key country dynamics
- 7.4.2.2. Competitive scenario
- 7.4.2.3. Regulatory framework
- 7.4.2.4. U.S. market estimates and forecasts, 2018 to 2030 (USD Million)
- 7.4.3. Canada
- 7.4.3.1. Key country dynamics
- 7.4.3.2. Competitive scenario
- 7.4.3.3. Regulatory framework
- 7.4.3.4. Canada market estimates and forecasts, 2018 to 2030 (USD Million)
- 7.4.4. Mexico
- 7.4.4.1. Key country dynamics
- 7.4.4.2. Competitive scenario
- 7.4.4.3. Regulatory framework
- 7.4.4.4. Mexico market estimates and forecasts, 2018 to 2030 (USD Million)
- 7.5. Europe
- 7.5.1. Europe market estimates and forecasts, 2018 to 2030 (USD Million)
- 7.5.2. UK
- 7.5.2.1. Key country dynamics
- 7.5.2.2. Competitive scenario
- 7.5.2.3. Regulatory framework
- 7.5.2.4. UK market estimates and forecasts, 2018 to 2030 (USD Million)
- 7.5.3. Germany
- 7.5.3.1. Key country dynamics
- 7.5.3.2. Competitive scenario
- 7.5.3.3. Regulatory framework
- 7.5.3.4. Germany market estimates and forecasts, 2018 to 2030 (USD Million)
- 7.5.4. France
- 7.5.4.1. Key country dynamics
- 7.5.4.2. Competitive scenario
- 7.5.4.3. Regulatory framework
- 7.5.4.4. France market estimates and forecasts, 2018 to 2030 (USD Million)
- 7.5.5. Italy
- 7.5.5.1. Key country dynamics
- 7.5.5.2. Competitive scenario
- 7.5.5.3. Regulatory framework
- 7.5.5.4. Italy market estimates and forecasts, 2018 to 2030 (USD Million)
- 7.5.6. Spain
- 7.5.6.1. Key country dynamics
- 7.5.6.2. Competitive scenario
- 7.5.6.3. Regulatory framework
- 7.5.6.4. Spain market estimates and forecasts, 2018 to 2030 (USD Million)
- 7.5.7. Denmark
- 7.5.7.1. Key country dynamics
- 7.5.7.2. Competitive scenario
- 7.5.7.3. Regulatory framework
- 7.5.7.4. Denmark market estimates and forecasts, 2018 to 2030 (USD Million)
- 7.5.8. Sweden
- 7.5.8.1. Key country dynamics
- 7.5.8.2. Competitive scenario
- 7.5.8.3. Regulatory framework
- 7.5.8.4. Sweden market estimates and forecasts, 2018 to 2030 (USD Million)
- 7.5.9. Norway
- 7.5.9.1. Key country dynamics
- 7.5.9.2. Competitive scenario
- 7.5.9.3. Regulatory framework
- 7.5.9.4. Norway market estimates and forecasts, 2018 to 2030 (USD Million)
- 7.6. Asia Pacific
- 7.6.1. Asia Pacific market estimates and forecasts, 2018 to 2030 (USD Million)
- 7.6.2. Japan
- 7.6.2.1. Key country dynamics
- 7.6.2.2. Competitive scenario
- 7.6.2.3. Regulatory framework
- 7.6.2.4. Japan market estimates and forecasts, 2018 to 2030 (USD Million)
- 7.6.3. China
- 7.6.3.1. Key country dynamics
- 7.6.3.2. Competitive scenario
- 7.6.3.3. Regulatory framework
- 7.6.3.4. China market estimates and forecasts, 2018 to 2030 (USD Million)
- 7.6.4. India
- 7.6.4.1. Key country dynamics
- 7.6.4.2. Competitive scenario
- 7.6.4.3. Regulatory framework
- 7.6.4.4. India market estimates and forecasts, 2018 to 2030 (USD Million)
- 7.6.5. Australia
- 7.6.5.1. Key country dynamics
- 7.6.5.2. Competitive scenario
- 7.6.5.3. Regulatory framework
- 7.6.5.4. Australia market estimates and forecasts, 2018 to 2030 (USD Million)
- 7.6.6. South Korea
- 7.6.6.1. Key country dynamics
- 7.6.6.2. Competitive scenario
- 7.6.6.3. Regulatory framework
- 7.6.6.4. South Korea market estimates and forecasts, 2018 to 2030 (USD Million)
- 7.6.7. Thailand
- 7.6.7.1. Key country dynamics
- 7.6.7.2. Competitive scenario
- 7.6.7.3. Regulatory framework
- 7.6.7.4. Thailand market estimates and forecasts, 2018 to 2030 (USD Million)
- 7.7. Latin America
- 7.7.1. Latin America market estimates and forecasts, 2018 to 2030 (USD Million)
- 7.7.2. Brazil
- 7.7.2.1. Key country dynamics
- 7.7.2.2. Competitive scenario
- 7.7.2.3. Regulatory framework
- 7.7.2.4. Brazil market estimates and forecasts, 2018 to 2030 (USD Million)
- 7.7.3. Argentina
- 7.7.3.1. Key country dynamics
- 7.7.3.2. Competitive scenario
- 7.7.3.3. Regulatory framework
- 7.7.3.4. Argentina market estimates and forecasts, 2018 to 2030 (USD Million)
- 7.8. MEA
- 7.8.1. MEA market estimates and forecasts, 2018 to 2030 (USD Million)
- 7.8.2. Turkey
- 7.8.2.1. Key country dynamics
- 7.8.2.2. Competitive scenario
- 7.8.2.3. Regulatory framework
- 7.8.2.4. Turkey market estimates and forecasts, 2018 to 2030 (USD Million)
- 7.8.3. Iran
- 7.8.3.1. Key country dynamics
- 7.8.3.2. Competitive scenario
- 7.8.3.3. Regulatory framework
- 7.8.3.4. Iran market estimates and forecasts, 2018 to 2030 (USD Million)
- 7.8.4. South Africa
- 7.8.4.1. Key country dynamics
- 7.8.4.2. Competitive scenario
- 7.8.4.3. Regulatory framework
- 7.8.4.4. South Africa market estimates and forecasts, 2018 to 2030 (USD Million)
- 7.8.5. Saudi Arabia
- 7.8.5.1. Key country dynamics
- 7.8.5.2. Competitive scenario
- 7.8.5.3. Regulatory framework
- 7.8.5.4. Saudi Arabia market estimates and forecasts, 2018 to 2030 (USD Million)
- 7.8.6. UAE
- 7.8.6.1. Key country dynamics
- 7.8.6.2. Competitive scenario
- 7.8.6.3. Regulatory framework
- 7.8.6.4. UAE market estimates and forecasts, 2018 to 2030 (USD Million)
- 7.8.7. Kuwait
- 7.8.7.1. Key country dynamics
- 7.8.7.2. Competitive scenario
- 7.8.7.3. Regulatory framework
- 7.8.7.4. Kuwait market estimates and forecasts, 2018 to 2030 (USD Million)
Chapter 8. Competitive Landscape
- 8.1. Company/Competition Categorization
- 8.2. Strategy Mapping
- 8.3. Company Market Position Analysis, 2024
- 8.4. Company Profiles/Listing
- 8.4.1. AbbVie
- 8.4.1.1. Company overview
- 8.4.1.2. Financial performance
- 8.4.1.3. Product benchmarking
- 8.4.1.4. Strategic initiatives
- 8.4.2. Galderma
- 8.4.2.1. Company overview
- 8.4.2.2. Financial performance
- 8.4.2.3. Product benchmarking
- 8.4.2.4. Strategic initiatives
- 8.4.3. Merz GmbH and Co. KGaA
- 8.4.3.1. Company overview
- 8.4.3.2. Financial performance
- 8.4.3.3. Product benchmarking
- 8.4.3.4. Strategic initiatives
- 8.4.4. IBSA Farmaceutici Italia Srl
- 8.4.4.1. Company overview
- 8.4.4.2. Financial performance
- 8.4.4.3. Product benchmarking
- 8.4.4.4. Strategic initiatives
- 8.4.5. Teoxane
- 8.4.5.1. Company overview
- 8.4.5.2. Financial performance
- 8.4.5.3. Product benchmarking
- 8.4.5.4. Strategic initiatives
- 8.4.6. Sinclair
- 8.4.6.1. Company overview
- 8.4.6.2. Financial performance
- 8.4.6.3. Product benchmarking
- 8.4.6.4. Strategic initiatives
- 8.4.7. BioScience GmbH
- 8.4.7.1. Company overview
- 8.4.7.2. Financial performance
- 8.4.7.3. Product benchmarking
- 8.4.7.4. Strategic initiatives
- 8.4.8. Hugel
- 8.4.8.1. Company overview
- 8.4.8.2. Financial performance
- 8.4.8.3. Product benchmarking
- 8.4.8.4. Strategic initiatives
- 8.4.9. BioPlus
- 8.4.9.1. Company overview
- 8.4.9.2. Financial performance
- 8.4.9.3. Product benchmarking
- 8.4.9.4. Strategic initiatives
- 8.4.10. Medytox, Inc.
- 8.4.10.1. Company overview
- 8.4.10.2. Financial performance
- 8.4.10.3. Product benchmarking
- 8.4.10.4. Strategic initiatives
- 8.4.1. AbbVie
