|
|
市場調査レポート
商品コード
1728449
宝くじ市場規模、シェア、動向分析レポート:カテゴリー別、用途別、地域別、セグメント予測、2025年~2030年Lottery Market Size, Share & Trends Analysis Report By Category (Draw-based Games, Instant Games, Sports Games), By Application (Online, Offline), By Region (North America, Asia Pacific, Europe), And Segment Forecasts, 2025 - 2030 |
||||||

|
|||||||
カスタマイズ可能
|
|||||||

| 宝くじ市場規模、シェア、動向分析レポート:カテゴリー別、用途別、地域別、セグメント予測、2025年~2030年 |
|
出版日: 2025年04月22日
発行: Grand View Research
ページ情報: 英文 150 Pages
納期: 2~10営業日
|

全表示
- 概要
- 図表
- 目次
宝くじ市場規模と動向
世界の宝くじ市場規模は2024年に3,532億9,000万米ドルと推定され、2025~2030年にかけてCAGR 5.3%で成長すると予測されています。
宝くじ産業は、技術の進歩、消費者行動の変化、規制環境の進化によってダイナミックな動向に見舞われています。成長を促進する主要因の1つは、オンライン宝くじの人気が高まっていることで、宝くじゲームとの関わり方に革命をもたらしています。このオンラインプラットフォームへのシフトは、暗号化やデジタルツールなどのセキュリティの向上にも裏付けられており、取引を保護し、ユーザー間の信頼関係を構築するのに役立っています。
デジタルプラットフォームへのシフトが進むにつれ、宝くじサービスの提供方法も変化しており、オペレーターは現代の消費者の嗜好の変化に対応するため、オンラインやモバイルのソリューションを取り入れています。伝統的紙ベースの宝くじは、特に技術に精通したユーザーや若い視聴者にとって、よりアクセスしやすいデジタルに取って代わられつつあります。オンライン宝くじプラットフォームは、ユーザー体験を向上させるために、ユーザーフレンドリーなインターフェース、安全な決済オプション、リアルタイムの結果更新を統合しています。このようなデジタルの進化により、市場参入企業の利便性が向上すると同時に、インターネットへのアクセスの増加や、世界市場でのスマートフォンの普及に後押しされ、宝くじ産業のリーチも拡大しています。
さらに、政府の規制の進化が宝くじ市場の成長に大きく影響しています。多くの国が、特にデジタル空間において、宝くじシステムの合法化と正式化を進めているからです。この変化は、当局に新たな収益機会をもたらすと同時に、産業にさらなる構造と透明性をもたらしています。税収や違法賭博の減少など、管理された宝くじシステムの利点が政府によって認識されるようになり、世界市場の拡大に拍車をかける規制への取り組みが推進されています。
さまざまな年齢層で消費者の嗜好が変化しているため、宝くじへの参加パターンに明らかな変化が見られます。若い世代は、即座に勝てるゲームやゲーム化された体験など、デジタルでモバイルフレンドリーな宝くじフォーマットにますます惹かれています。一方、年配の消費者は、店頭でのチケット購入など、伝統的方法を依然として好んでいます。この世代交代は、提供されるゲームタイプや提供方法に影響を与え、宝くじ産業の情勢をより多様でダイナミックなものにしています。
さらに、宝くじ会社は、スポーツ、eコマース、エンターテイメントなどの産業と戦略的提携を結び、観客の裾野を広げています。このようなコラボレーションは、共同ブランドのゲーム、共同プロモーション、または宝くじ産業の経験と大衆文化を融合させるスポンサーシップ契約を通じて、しばしば具体化されます。動向のイベントや広く認知されたプラットフォームと連携することで、こうしたパートナーシップはエンゲージメントを促進し、新しい顧客層を惹きつけるのに役立ちます。主要企業によるこのような戦略は、今後数年の宝くじ産業の成長を促進すると予想されます。
目次
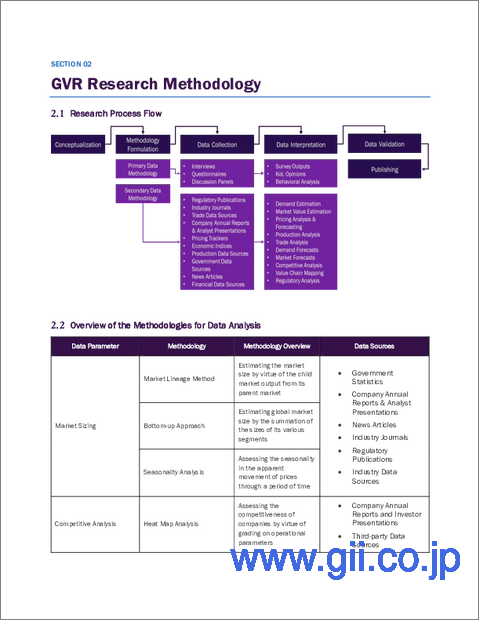
第1章 調査手法と範囲
第2章 エグゼクティブサマリー
第3章 宝くじ市場の変数、動向、範囲
- 市場系統の展望
- 市場力学
- 市場促進要因分析
- 市場抑制要因分析
- 技術チャレンジ
- 宝くじ市場分析ツール
- 技術分析-ポーターのファイブフォース分析
- PESTEL分析
- 経済情勢
第4章 宝くじ市場:カテゴリー、推定・動向分析
- セグメントダッシュボード
- 宝くじ市場:カテゴリーの変動分析、2024年と2030年
- 抽選型宝くじ
- インスタントゲーム
- スポーツゲーム
第5章 宝くじ市場:応募推定・動向分析
- セグメントダッシュボード
- 宝くじ市場:申込変動分析、2024年と2030年
- オンライン
- オフライン
第6章 地域別、推定・動向分析
- 地域別宝くじ市場、2024年と2030年
- 北米
- 北米の宝くじ市場の推定と予測、2018~2030年
- 米国
- カナダ
- メキシコ
- 欧州
- 欧州の宝くじ市場推定・予測、2018~2030年
- 英国
- ドイツ
- フランス
- イタリア
- スペイン
- アジア太平洋
- アジア太平洋の宝くじ市場推定・予測、2018~2030年
- 中国
- 日本
- インド
- 韓国
- オーストラリアとニュージーランド
- 中南米
- 中南米の宝くじ市場推定・予測、2018~2030年
- ブラジル
- 中東・アフリカ
- 中東・アフリカの宝くじ市場推定・予測、2018~2030年
第7章 競合情勢
- 企業分類
- 企業の市場ポジショニング
- 企業ヒートマップ分析
- 企業プロファイル/上場企業
- International Game Technology(IGT)
- Scientific Games Corporation
- Francaise des Jeux(FDJ)
- Lottomatica SpA
- Camelot Group
- China Welfare Lottery
- China Sports Lottery
- Hong Kong Jockey Club
- New York State Lottery
- California Lottery
- Florida Lottery
- Singapore Pools
- Ontario Lottery and Gaming Corporation(OLG)
- Mizuho Bank Ltd.
- The Government Lottery Office
- Sazka Group
- INTRALOT
- BCLC(British Columbia Lottery Corporation)
- Loto-Quebec
- Lotto.com
List of Tables
- Table 1 Lottery market size estimates & forecasts 2018 - 2030 (USD Billion)
- Table 2 Lottery market, by category 2018 - 2030 (USD Billion)
- Table 3 Draw-based lottery market estimates & forecasts, 2018 - 2030 (USD Billion)
- Table 4 Instant games market estimates & forecasts, 2018 - 2030 (USD Billion)
- Table 5 Sports game market estimates & forecasts, 2018 - 2030 (USD Billion)
- Table 6 Lottery market, by application 2018 - 2030 (USD Billion)
- Table 7 Online market estimates & forecasts, 2018 - 2030 (USD Billion)
- Table 8 Offline market estimates & forecasts, 2018 - 2030 (USD Billion)
- Table 9 North America lottery market estimates & forecasts, 2018 - 2030 (USD Billion)
- Table 10 North America lottery market revenue estimates and forecast by category, 2018 - 2030 (USD Billion)
- Table 11 North America lottery market revenue estimates and forecast by application, 2018 - 2030 (USD Billion)
- Table 12 U.S. Lottery market estimates and forecast, 2018 - 2030 (USD Billion)
- Table 13 U.S. Lottery market revenue estimates and forecast by category, 2018 - 2030 (USD Billion)
- Table 14 U.S. Lottery market revenue estimates and forecast by application, 2018 - 2030 (USD Billion)
- Table 15 Canada lottery market estimates and forecast, 2018 - 2030 (USD Billion)
- Table 16 Canada lottery market revenue estimates and forecast by category, 2018 - 2030 (USD Billion)
- Table 17 Canada lottery market revenue estimates and forecast by application, 2018 - 2030 (USD Billion)
- Table 18 Mexico lottery market estimates and forecast, 2018 - 2030 (USD Billion)
- Table 19 Mexico lottery market revenue estimates and forecast by category, 2018 - 2030 (USD Billion)
- Table 20 Mexico lottery market revenue estimates and forecast by application, 2018 - 2030 (USD Billion)
- Table 21 Europe lottery market estimates and forecast, 2018 - 2030 (USD Billion)
- Table 22 Europe lottery market revenue estimates and forecast by category, 2018 - 2030 (USD Billion)
- Table 23 Europe lottery market revenue estimates and forecast by application, 2018 - 2030 (USD Billion)
- Table 24 Germany lottery market estimates and forecast, 2018 - 2030 (USD Billion)
- Table 25 Germany lottery market revenue estimates and forecast by category, 2018 - 2030 (USD Billion)
- Table 26 Germany lottery market revenue estimates and forecast by application, 2018 - 2030 (USD Billion)
- Table 27 UK lottery market estimates and forecast, 2018 - 2030 (USD Billion)
- Table 28 UK lottery market revenue estimates and forecast by category, 2018 - 2030 (USD Billion)
- Table 29 UK lottery market revenue estimates and forecast by application, 2018 - 2030 (USD Billion)
- Table 30 France lottery market estimates and forecast, 2018 - 2030 (USD Billion)
- Table 31 France lottery market revenue estimates and forecast by category, 2018 - 2030 (USD Billion)
- Table 32 France lottery market revenue estimates and forecast by application, 2018 - 2030 (USD Billion)
- Table 33 Italy lottery market estimates and forecast, 2018 - 2030 (USD Billion)
- Table 34 Italy lottery market revenue estimates and forecast by category, 2018 - 2030 (USD Billion)
- Table 35 Italy lottery market revenue estimates and forecast by application, 2018 - 2030 (USD Billion)
- Table 36 Spain lottery market estimates and forecast, 2018 - 2030 (USD Billion)
- Table 37 Spain lottery market revenue estimates and forecast by category, 2018 - 2030 (USD Billion)
- Table 38 Spain lottery market revenue estimates and forecast by application, 2018 - 2030 (USD Billion)
- Table 39 Asia pacific lottery market estimates and forecast, 2018 - 2030 (USD Billion)
- Table 40 Asia pacific lottery market revenue estimates and forecast by category, 2018 - 2030 (USD Billion)
- Table 41 Asia pacific lottery market revenue estimates and forecast by application, 2018 - 2030 (USD Billion)
- Table 42 China lottery market estimates and forecast, 2018 - 2030 (USD Billion)
- Table 43 China lottery market revenue estimates and forecast by category, 2018 - 2030 (USD Billion)
- Table 44 China lottery market revenue estimates and forecast by application, 2018 - 2030 (USD Billion)
- Table 45 Japan lottery market estimates and forecast, 2018 - 2030 (USD Billion)
- Table 46 Japan lottery market revenue estimates and forecast by category, 2018 - 2030 (USD Billion)
- Table 47 Japan lottery market revenue estimates and forecast by application, 2018 - 2030 (USD Billion)
- Table 48 India lottery market estimates and forecast, 2018 - 2030 (USD Billion)
- Table 49 India lottery market revenue estimates and forecast by category, 2018 - 2030 (USD Billion)
- Table 50 India lottery market revenue estimates and forecast by application, 2018 - 2030 (USD Billion)
- Table 51 Australia & New Zealand lottery market estimates and forecast, 2018 - 2030 (USD Billion)
- Table 52 Australia & New Zealand lottery market revenue estimates and forecast by category, 2018 - 2030 (USD Billion)
- Table 53 Australia & New Zealand lottery market revenue estimates and forecast by application, 2018 - 2030 (USD Billion)
- Table 54 South Korea lottery market estimates and forecast, 2018 - 2030 (USD Billion)
- Table 55 South Korea lottery market revenue estimates and forecast by category, 2018 - 2030 (USD Billion)
- Table 56 South Korea lottery market revenue estimates and forecast by application, 2018 - 2030 (USD Billion)
- Table 57 Central & South America lottery market estimates and forecast, 2018 - 2030 (USD Billion)
- Table 58 Central & South America lottery market revenue estimates and forecast by category, 2018 - 2030 (USD Billion)
- Table 59 Central & South America lottery market revenue estimates and forecast by application, 2018 - 2030 (USD Billion)
- Table 60 Brazil macro-economic outlay
- Table 61 Brazil lottery market estimates and forecast, 2018 - 2030 (USD Billion)
- Table 62 Brazil lottery market revenue estimates and forecast by category, 2018 - 2030 (USD Billion)
- Table 63 Brazil lottery market revenue estimates and forecast by application, 2018 - 2030 (USD Billion)
- Table 64 Middle east & Africa lottery market estimates and forecast, 2018 - 2030 (USD Billion)
- Table 65 Middle east & Africa lottery market revenue estimates and forecast by category, 2018 - 2030 (USD Billion)
- Table 66 Middle east & Africa lottery market revenue estimates and forecast by application, 2018 - 2030 (USD Billion)
List of Figures
- Fig. 1 Lottery market segmentation
- Fig. 2 Information procurement
- Fig. 3 Data analysis models
- Fig. 4 Market formulation and validation
- Fig. 5 Data validating & publishing
- Fig. 6 Lottery market snapshot
- Fig. 7 Lottery market segment snapshot
- Fig. 8 Lottery market competitive landscape snapshot
- Fig. 9 Market research process
- Fig. 10 Market driver relevance analysis (current & future impact)
- Fig. 11 Market restraint relevance analysis (current & future impact)
- Fig. 12 Lottery market, by category, key takeaways
- Fig. 13 Lottery market, by category, market share, 2024 & 2030
- Fig. 14 Draw-based lottery market estimates & forecasts, 2018 - 2030 (USD Billion)
- Fig. 15 Instant games market estimates & forecasts, 2018 - 2030 (USD Billion)
- Fig. 16 Sports games market estimates & forecasts, 2018 - 2030 (USD Billion)
- Fig. 17 Lottery Market, by application, key takeaways
- Fig. 18 Lottery Market, by application, market share, 2024 & 2030
- Fig. 19 Online market estimates & forecasts, 2018 - 2030 (USD Billion)
- Fig. 20 Offline market estimates & forecasts, 2018 - 2030 (USD Billion)
- Fig. 21 Regional marketplace: key takeaways
- Fig. 22 North America Lottery market estimates & forecast, 2018 - 2030 (USD Billion)
- Fig. 23 U.S. Lottery Market estimates & forecast, 2018 - 2030 (USD Billion)
- Fig. 24 Canada Lottery Market estimates & forecast, 2018 - 2030 (USD Billion)
- Fig. 25 Mexico Lottery Market estimates & forecast, 2018 - 2030 (USD Billion)
- Fig. 26 Europe Lottery Market estimates & forecast, 2018 - 2030 (USD Billion)
- Fig. 27 UK Lottery Market estimates & forecast, 2018 - 2030 (USD Billion)
- Fig. 28 Germany Lottery Market estimates & forecast, 2018 - 2030 (USD Billion)
- Fig. 29 France Lottery Market estimates & forecast, 2018 - 2030 (USD Billion)
- Fig. 30 Italy Lottery Market estimates & forecast, 2018 - 2030 (USD Billion)
- Fig. 31 Spain Lottery Market estimates & forecast, 2018 - 2030 (USD Billion)
- Fig. 32 Asia Pacific Lottery Market estimates & forecast, 2018 - 2030 (USD Billion)
- Fig. 33 China Lottery Market estimates & forecast, 2018 - 2030 (USD Billion)
- Fig. 34 Japan Lottery Market estimates & forecast, 2018 - 2030 (USD Billion)
- Fig. 35 India Lottery Market estimates & forecast, 2018 - 2030 (USD Billion)
- Fig. 36 Australia & New Zealand Lottery Market estimates & forecast, 2018 - 2030 (USD Billion)
- Fig. 37 South Korea Lottery Market estimates & forecast, 2018 - 2030 (USD Billion)
- Fig. 38 Central & South America Lottery Market estimates & forecast, 2018 - 2030 (USD Billion)
- Fig. 39 Brazil Lottery Market estimates & forecast, 2018 - 2030 (USD Billion)
- Fig. 40 Middle East & Africa Lottery Market estimates & forecast, 2018 - 2030 (USD Billion)
- Fig. 41 Key company categorization
- Fig. 42 Strategy framework
Lottery Market Size & Trends:
The global lottery market size was estimated at USD 353.29 billion in 2024 and is projected to grow at a CAGR of 5.3% from 2025 to 2030. The lottery industry is experiencing dynamic trends driven by technological advancements, changing consumer behaviors, and evolving regulatory environments. One of the key factors driving growth is the rising popularity of online lotteries, which have revolutionized the way people interact with lottery games. The widespread use of smartphones, along with enhanced internet access, has significantly simplified the process for users to buy tickets and join games from virtually any location, at any time This shift towards online platforms is also backed by better security, including encryption and digital tools, which help protect transactions and build trust among users, which is expected to drive the lottery industry expansion in the coming years.
The growing shift towards digital platforms is transforming how lottery services are delivered, as operators embrace online and mobile solutions to meet the changing preferences of modern consumers. Traditional paper-based lotteries are being replaced with digital alternatives that offer greater accessibility, especially for tech-savvy users and younger audiences. Online lottery platforms are integrating user-friendly interfaces, secure payment options, and real-time result updates to enhance the user experience. This digital evolution is making participation more convenient while simultaneously expanding the reach of the lottery industry, fueled by growing internet access and widespread smartphone usage across global markets.
Additionally, evolving government regulations are significantly influencing the lottery market's growth, as many countries are moving towards legalizing and formalizing lottery systems, especially in the digital space. This shift is creating new revenue opportunities for authorities while bringing more structure and transparency to the industry. The increasing recognition by governments of the benefits of controlled lottery systems, including tax revenue and reduced illegal gambling, is driving regulatory efforts that fuel the expansion of the global market.
There is a clear shift in lottery participation patterns, driven by evolving consumer preferences across different age groups. Younger generations are increasingly drawn to digital and mobile-friendly lottery formats, such as instant-win games and gamified experiences. Meanwhile, older consumers still prefer traditional methods, such as in-store ticket purchases. This generational shift is influencing the types of games offered and how they are delivered, leading to a more diverse and dynamic lottery industry landscape.
Moreover, lottery companies are forming strategic alliances with industries like sports, e-commerce, and entertainment to broaden their audience base. These collaborations often take shape through co-branded games, joint promotions, or sponsorship deals that blend lottery industry experiences with popular culture. Aligning with trending events or widely recognized platforms, such partnerships help drive engagement and attract newer customer segments. Such strategies by key companies are expected to drive the lottery industry's growth in the coming years.
Global Lottery Market Report Segmentation
This report forecasts revenue growth at global, regional, and country levels and provides an analysis of the latest technology trends in each of the sub-segments from 2018 to 2030. For this study, Grand View Research has segmented the global lottery market report based on category, application, and region:
- Category Outlook (Revenue, USD Billion, 2018 - 2030)
- Draw-based lottery
- Instant games
- Sports game
- Application Outlook (Revenue, USD Billion, 2018 - 2030)
- Online
- Offline
- Regional Outlook (Revenue, USD Billion, 2018 - 2030)
- North America
- U.S.
- Canada
- Mexico
- Europe
- Germany
- UK
- France
- Italy
- Spain
- Asia Pacific
- China
- Japan
- India
- Australia & New Zealand
- South Korea
- Central & South America
- Brazil
- Middle East & Africa
Table of Contents
Chapter 1. Methodology and Scope
- 1.1. Market Segmentation and Scope
- 1.2. Market Definitions
- 1.2.1. Information analysis
- 1.2.2. Market formulation & data visualization
- 1.2.3. Data validation & publishing
- 1.3. Research Scope and Assumptions
- 1.3.1. List of Data Sources
Chapter 2. Executive Summary
- 2.1. Market Outlook
- 2.2. Segment Outlook
- 2.3. Competitive Insights
Chapter 3. Lottery Market Variables, Trends, & Scope
- 3.1. Market Lineage Outlook
- 3.2. Market Dynamics
- 3.2.1. Market Driver Analysis
- 3.2.2. Market Restraint Analysis
- 3.2.3. Technology Challenge
- 3.3. Lottery Market Analysis Tools
- 3.3.1. Technology Analysis - Porter's
- 3.3.1.1. Bargaining power of the suppliers
- 3.3.1.2. Bargaining power of the buyers
- 3.3.1.3. Threats of substitution
- 3.3.1.4. Threats from new entrants
- 3.3.1.5. Competitive rivalry
- 3.3.2. PESTEL Analysis
- 3.3.2.1. Political landscape
- .3.2.2. Economic landscape
- 3.3.2.3. Social landscape
- 3.3.2.4. Technological landscape
- 3.3.2.5. Environmental landscape
- 3.3.2.6. Legal landscape
- 3.3.1. Technology Analysis - Porter's
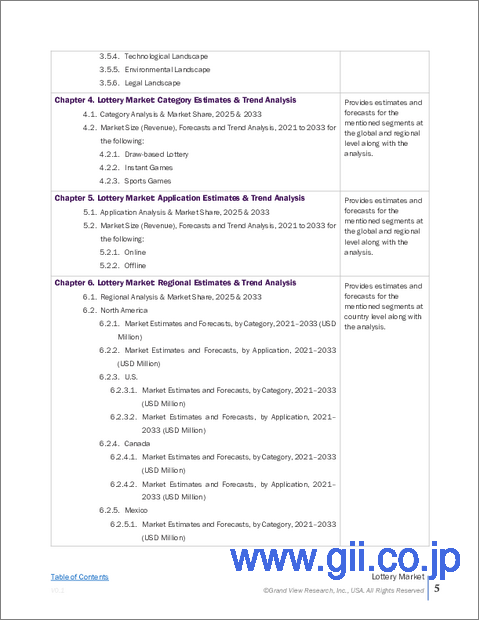
Chapter 4. Lottery Market: Category Estimates & Trend Analysis
- 4.1. Segment Dashboard
- 4.2. Lottery Market: Category Movement Analysis, 2024 & 2030 (USD Billion)
- 4.3. Draw-based lottery
- 4.3.1. Draw-based Lottery Market Revenue Estimates and Forecasts, 2018 - 2030 (USD Billion)
- 4.4. Instant games
- 4.4.1. Instant games Market Revenue Estimates and Forecasts, 2018 - 2030 (USD Billion)
- 4.5. Sports games
- 4.5.1. Sports games Market Revenue Estimates and Forecasts, 2018 - 2030 (USD Billion)
Chapter 5. Lottery Market: Application Estimates & Trend Analysis
- 5.1. Segment Dashboard
- 5.2. Lottery Market: Application Movement Analysis, 2024 & 2030 (USD Billion)
- 5.3. Online
- 5.3.1. Online Market Revenue Estimates and Forecasts, 2018 - 2030 (USD Billion)
- 5.4. Offline
- 5.4.1. Offline Market Revenue Estimates and Forecasts, 2018 - 2030 (USD Billion)
Chapter 6. Regional Estimates & Trend Analysis
- 6.1. Lottery Market by Region, 2024 & 2030
- 6.2. North America
- 6.2.1. North America Lottery Market Estimates & Forecasts, 2018 - 2030 (USD Billion)
- 6.2.2. U.S.
- 6.2.2.1. U.S. Lottery Market Estimates and Forecasts, 2018 - 2030 (USD Billion)
- 6.2.3. Canada
- 6.2.3.1. Canada Lottery Market Estimates and Forecasts, 2018 - 2030 (USD Billion)
- 6.2.4. Mexico
- 6.2.4.1. Mexico Lottery Market Estimates and Forecasts, 2018 - 2030 (USD Billion)
- 6.3. Europe
- 6.3.1. Europe Lottery Market Estimates and Forecasts, 2018 - 2030 (USD Billion)
- 6.3.2. U.K.
- 6.3.2.1. U.K. Lottery Market Estimates and Forecasts, 2018 - 2030 (USD Billion)
- 6.3.3. Germany
- 6.3.3.1. Germany Lottery Market Estimates and Forecasts, 2018 - 2030 (USD Billion)
- 6.3.4. France
- 6.3.4.1. France Lottery Market Estimates and Forecasts, 2018 - 2030 (USD Billion)
- 6.3.5. Italy
- 6.3.5.1. Italy Lottery Market Estimates and Forecasts, 2018 - 2030 (USD Billion)
- 6.3.6. Spain
- 6.3.6.1. Spain Lottery Market Estimates and Forecasts, 2018 - 2030 (USD Billion)
- 6.4. Asia Pacific
- 6.4.1. Asia Pacific Lottery Market Estimates and Forecasts, 2018 - 2030 (USD Billion)
- 6.4.2. China
- 6.4.2.1. China Lottery Market Estimates and Forecasts, 2018 - 2030 (USD Billion)
- 6.4.3. Japan
- 6.4.3.1. Japan Lottery Market Estimates and Forecasts, 2018 - 2030 (USD Billion)
- 6.4.4. India
- 6.4.4.1. India Lottery Market Estimates and Forecasts, 2018 - 2030 (USD Billion)
- 6.4.5. South Korea
- 6.4.5.1. South Korea Lottery Market Estimates and Forecasts, 2018 - 2030 (USD Billion)
- 6.4.6. Australia & New Zealand
- 6.4.6.1. Australia & New Zealand Lottery Market Estimates and Forecasts, 2018 - 2030 (USD Billion)
- 6.5. Central & South America
- 6.5.1. Central & South America Lottery Market Estimates and Forecasts, 2018 - 2030 (USD Billion)
- 6.5.2. Brazil
- 6.5.2.1. Brazil Lottery Market Estimates and Forecasts, 2018 - 2030 (USD Billion)
- 6.6. Middle East and Africa
- 6.6.1. Middle East and Africa Lottery Market Estimates and Forecasts, 2018 - 2030 (USD Billion)
Chapter 7. Competitive Landscape
- 7.1. Company Categorization
- 7.2. Company Market Positioning
- 7.3. Company Heat Map Analysis
- 7.4. Company Profiles/Listing
- 7.4.1. International Game Technology (IGT.
- 7.4.1.1. Participant's Overview
- 7.4.1.2. Financial Performance
- 7.4.1.3. Product Benchmarking
- 7.4.1.4. Strategic Initiatives
- 7.4.2. Scientific Games Corporation
- 7.4.2.1. Participant's Overview
- 7.4.2.2. Financial Performance
- 7.4.2.3. Product Benchmarking
- 7.4.2.4. Strategic Initiatives
- 7.4.3. Francaise des Jeux (FDJ)
- 7.4.3.1. Participant's Overview
- 7.4.3.2. Financial Performance
- 7.4.3.3. Product Benchmarking
- 7.4.3.4. Strategic Initiatives
- 7.4.4. Lottomatica S.p.A.
- 7.4.4.1. Participant's Overview
- 7.4.4.2. Financial Performance
- 7.4.4.3. Product Benchmarking
- 7.4.4.4. Strategic Initiatives
- 7.4.5. Camelot Group
- 7.4.5.1. Participant's Overview
- 7.4.5.2. Financial Performance
- 7.4.5.3. Product Benchmarking
- 7.4.5.4. Strategic Initiatives
- 7.4.6. China Welfare Lottery
- 7.4.6.1. Participant's Overview
- 7.4.6.2. Financial Performance
- 7.4.6.3. Product Benchmarking
- 7.4.6.4. Strategic Initiatives
- 7.4.7. China Sports Lottery
- 7.4.7.1. Participant's Overview
- 7.4.7.2. Financial Performance
- 7.4.7.3. Product Benchmarking
- 7.4.7.4. Strategic Initiatives
- 7.4.8. Hong Kong Jockey Club
- 7.4.8.1. Participant's Overview
- 7.4.8.2. Financial Performance
- 7.4.8.3. Product Benchmarking
- 7.4.8.4. Strategic Initiatives
- 7.4.9. New York State Lottery
- 7.4.9.1. Participant's Overview
- 7.4.9.2. Financial Performance
- 7.4.9.3. Product Benchmarking
- 7.4.9.4. Strategic Initiatives
- 7.4.10. California Lottery
- 7.4.10.1. Participant's Overview
- 7.4.10.2. Financial Performance
- 7.4.10.3. Product Benchmarking
- 7.4.10.4. Strategic Initiatives
- 7.4.11. Florida Lottery
- 7.4.11.1. Participant's Overview
- 7.4.11.2. Financial Performance
- 7.4.11.3. Product Benchmarking
- 7.4.11.4. Strategic Initiatives
- 7.4.12. Singapore Pools
- 7.4.12.1. Participant's Overview
- 7.4.12.2. Financial Performance
- 7.4.12.3. Product Benchmarking
- 7.4.12.4. Strategic Initiatives
- 7.4.13. Ontario Lottery and Gaming Corporation (OLG)
- 7.4.13.1. Participant's Overview
- 7.4.13.2. Financial Performance
- 7.4.13.3. Product Benchmarking
- 7.4.13.4. Strategic Initiatives
- 7.4.14. Mizuho Bank Ltd.
- 7.4.14.1. Participant's Overview
- 7.4.14.2. Financial Performance
- 7.4.14.3. Product Benchmarking
- 7.4.14.4. Strategic Initiatives
- 7.4.15. The Government Lottery Office
- 7.4.15.1. Participant's Overview
- 7.4.15.2. Financial Performance
- 7.4.15.3. Product Benchmarking
- 7.4.15.4. Strategic Initiatives
- 7.4.16. Sazka Group
- 7.4.16.1. Participant's Overview
- 7.4.16.2. Financial Performance
- 7.4.16.3. Product Benchmarking
- 7.4.16.4. Strategic Initiatives
- 7.4.17. INTRALOT
- 7.4.17.1. Participant's Overview
- 7.4.17.2. Financial Performance
- 7.4.17.3. Product Benchmarking
- 7.4.17.4. Strategic Initiatives
- 7.4.18. BCLC (British Columbia Lottery Corporation)
- 7.4.18.1. Participant's Overview
- 7.4.18.2. Financial Performance
- 7.4.18.3. Product Benchmarking
- 7.4.18.4. Strategic Initiatives
- 7.4.19. Loto-Quebec
- 7.4.19.1. Participant's Overview
- 7.4.19.2. Financial Performance
- 7.4.19.3. Product Benchmarking
- 7.4.19.4. Strategic Initiatives
- 7.4.20. Lotto.com
- 7.4.20.1. Participant's Overview
- 7.4.20.2. Financial Performance
- 7.4.20.3. Product Benchmarking
- 7.4.20.4. Strategic Initiatives
- 7.4.1. International Game Technology (IGT.

