|
|
市場調査レポート
商品コード
1587472
北米の獣医オンコロジーの市場規模、シェア、動向分析レポート:動物別、治療別、がん別、国別、セグメント別予測、2025年~2030年North America Veterinary Oncology Market Size, Share & Trends Analysis Report By Animal (Canine, Feline), By Therapy (Radiotherapy, Surgery, Chemotherapy), By Cancer (Skin Cancer, Lymphoma), By Country, And Segment Forecasts, 2025 - 2030 |
||||||
カスタマイズ可能
|
|||||||
| 北米の獣医オンコロジーの市場規模、シェア、動向分析レポート:動物別、治療別、がん別、国別、セグメント別予測、2025年~2030年 |
|
出版日: 2024年10月11日
発行: Grand View Research
ページ情報: 英文 150 Pages
納期: 2~10営業日
|
全表示
- 概要
- 図表
- 目次
北米の獣医オンコロジー市場の成長と動向:
Grand View Research, Inc.の最新レポートによると、北米の獣医オンコロジー市場規模は2030年までに12億2,000万米ドルに達し、2025年から2030年までのCAGRは10.70%で拡大すると予測されています。
この市場を牽引しているのは、ペットのがん罹患率の上昇、様々ながん治療の安全性と有効性を調査する獣医臨床試験の数、ペット保険の普及率の上昇です。さらに、コンパニオンアニマルのがんに対する標的療法の研究開発のための戦略的イニシアチブの増加が市場の成長を後押ししています。例えば、2023年7月、アーデントアニマルヘルス社はFidoCure社と提携し、後者のゲノム検査と精密医療プラットフォームを活用することで、動物医療における腫瘍学イノベーションへのアクセスを拡大しています。
COVID-19の間、市場はいくつかの課題により成長が鈍化しました。パンデミックは、動物用がんの研究開発努力と重要なペット用医薬品の物流供給に影響を与えました。また、獣医療へのアクセスも制限されました。世界・アニマルヘルス・アソシエーションの2020年版報告書によると、ペットの飼い主の調査によると、多くの国で獣医師によるペットの治療が遅れたり、省略されたりして、獣医師のサービスが妨げられているといいます。しかし、パンデミックはまた、ケアを強化するためのデジタル技術の採用を加速させました。2020年3月、PetCure Oncology社はTelehealthオプションをアップグレードし、ペットの家族や紹介した獣医師が、同社の認定放射線腫瘍医と遠隔でつながることを可能にしました。
小規模から大規模の市場プレーヤーが複数存在するため、市場は断片化され競合が多いです。プレーヤーは市場シェアを獲得するために戦略的イニシアチブを積極的に展開しています。例えば、2022年1月、デクラ社は米国におけるラベルディア-CA1(ベルジネクソール錠)の販売・マーケティング・サポート権をアニバイブ・ライフサイエンス社から取得しました。2022年6月、ベーリンガーインゲルハイム・インターナショナルGmbHは、バイオファーマのCarthroniX社と、犬のがん領域における低分子治療薬の開発に関する研究提携を締結しました。2023年4月、Torigen PharmaceuticalsはVeterinary Management Groups(VMG)と提携し、VMGの2,000を超える会員診療所ネットワークに同社の実験的な自家処方製品とサービスを提供します。
北米の獣医オンコロジー市場レポートハイライト
- 動物タイプ別では、イヌのセグメントが2024年の市場を独占し、86.25%以上の売上高シェアを占めました。一方、ネコ科セグメントは予測期間中12.38%以上のCAGRで最も急速に成長すると予測されています。この背景には、信頼性の高い動物用がん治療薬の開発と上市を促進するための提携や共同研究の増加があります。例えば、2022年10月、アーデントアニマルヘルス社は、犬のがん治療のための新規チェックポイント阻害剤のライセンス契約を完了しました。
- 治療法別では、2024年には外科手術分野が36.09%以上の売上シェアで市場を独占しました。免疫療法分野は予測期間中最も速いCAGRで成長すると予測されます。
- がんの種類別では、皮膚がん分野が2024年に39.01%以上の収益シェアで市場を独占しました。その他のセグメントは予測期間中最も速いCAGRで成長すると予測されています。
- 国別では、米国の動物用腫瘍市場が2024年に北米地域で89.02%の最大シェアを占めました。米国の成長は、主要プレイヤーの存在と市場プレイヤーの戦略的イニシアティブによるものです。2023年4月、Torigen Pharmaceuticals社は米国コネチカット州ファーミントンに新しい生産施設と本社を開設しました。
目次
第1章 調査手法と範囲
第2章 エグゼクティブサマリー
第3章 北米の獣医オンコロジー市場の変数、動向、範囲
- 市場系統の見通し
- 親市場の見通し
- 関連/補助市場見通し
- 市場力学
- 市場促進要因分析
- 市場抑制要因分析
- 市場機会分析
- 市場の課題分析
- 北米の獣医オンコロジー市場分析ツール
- ポーターの分析
- PESTEL分析
- COVID-19分析
- 主要国別の推定ペット数
第4章 北米の獣医オンコロジー市場:動物の推定・動向分析
- セグメントダッシュボード
- 北米の獣医オンコロジー市場変動分析
- 北米の獣医オンコロジー市場規模と動向分析、動物別、2018~2030年
- イヌ
- ネコ
- ウマ
第5章 北米の獣医オンコロジー市場:治療の推定・動向分析
- セグメントダッシュボード
- 北米の獣医オンコロジー市場変動分析
- 北米の獣医オンコロジー市場規模と動向分析、治療別、2018~2030年
- 放射線治療
- 定位放射線治療
- 従来の放射線療法
- 手術
- 化学療法
- 免疫療法
- その他の治療
第6章 北米の獣医オンコロジー市場:がんタイプの推定・動向分析
- セグメントダッシュボード
- 北米の獣医オンコロジー市場変動分析
- 北米の獣医オンコロジー市場規模と動向分析、がんタイプ別、2018~2030年
- 皮膚がん
- リンパ腫
- 肉腫
- その他
第7章 北米の獣医オンコロジー市場:地域の推定・動向分析
- 地域ダッシュボード
- 市場規模と予測および動向分析、2018年から2030年
- 北米
- 米国
- カナダ
- メキシコ
第8章 競合情勢
- 市場参入企業の分類
- 企業市況分析/ヒートマップ分析
- 2023年の企業市場シェアの推定分析
- 戦略マッピング
- 合併と買収
- パートナーシップとコラボレーション
- その他
- 企業プロファイル
- Elanco
- Boehringer Ingelheim International GmbH.
- Zoetis
- PetCure Oncology
- Accuray Incorporated
- Varian Medical Systems, Inc.
- Elekta AB.
- Karyopharm Therapeutics, Inc.
- Virbac.
- Merck &Co., Inc.
- Dechra Pharmaceuticals PLC
- NovaVive Inc.
- Ardent Animal Health, LLC(A BreakthrU Company).
第9章 重要なポイント
List of Tables
- Table 1 List of Secondary Sources
- Table 2 List of Abbreviations
- Table 3 North America Veterinary Oncology Market, by Animal, 2018 - 2030 (USD Million)
- Table 4 North America Veterinary Oncology Market, by Therapy, 2018 - 2030 (USD Million)
- Table 5 North America Veterinary Oncology Market, by Cancer Type, 2018 - 2030 (USD Million)
- Table 6 U.S. Veterinary Oncology Market, by Animal, 2018 - 2030 (USD Million)
- Table 7 U.S. Veterinary Oncology Market, by Therapy, 2018 - 2030 (USD Million)
- Table 8 U.S. Veterinary Oncology Market, by Cancer Type, 2018 - 2030 (USD Million)
- Table 9 Canada Veterinary Oncology Market, by Animal, 2018 - 2030 (USD Million)
- Table 10 Canada Veterinary Oncology Market, by Therapy, 2018 - 2030 (USD Million)
- Table 11 Canada Veterinary Oncology Market, by Cancer Type, 2018 - 2030 (USD Million)
- Table 12 Mexico Veterinary Oncology Market, by Animal, 2018 - 2030 (USD Million)
- Table 13 Mexico Veterinary Oncology Market, by Therapy, 2018 - 2030 (USD Million)
- Table 14 Mexico Veterinary Oncology Market, by Cancer Type, 2018 - 2030 (USD Million)
- Table 15 Company Overview
- Table 16 Service Benchmarking
- Table 17 Financial Performance
- Table 18 Strategic Initiatives
List of Figures
- Fig. 1 North America Veterinary Oncology Market segmentation
- Fig. 2 Market research process
- Fig. 3 Information procurement
- Fig. 4 Primary research pattern
- Fig. 5 Data Analysis Models
- Fig. 6 Market Formulation And Validation
- Fig. 7 Data Validating & Publishing
- Fig. 8 General methodology for a commodity flow analysis of North America Veterinary Oncology Market
- Fig. 9 Commodity flow analysis
- Fig. 10 Parent market analysis
- Fig. 11 Market snapshot
- Fig. 12 Segment snapshot
- Fig. 13 Segment snapshot
- Fig. 14 Competitive landscape snapshot
- Fig. 15 Parent market value, 2023 (USD Billion)
- Fig. 16 Ancillary market outlook, 2023
- Fig. 17 North America Veterinary Oncology Market Dynamics
- Fig. 18 Estimated animal population, 2018-2023 by key species and key countries
- Fig. 19 North America Veterinary Oncology Market: PORTER's analysis
- Fig. 20 North America Veterinary Oncology Market: PESTEL analysis
- Fig. 21 North America Veterinary Oncology Market by Animal: Key Takeaways
- Fig. 22 North America Veterinary Oncology Market by Animal, 2024 & 2030
- Fig. 23 Canine market, 2018 - 2030 (USD Million)
- Fig. 24 Feline market, 2018 - 2030 (USD Million)
- Fig. 25 Equine market, 2018 - 2030 (USD Million)
- Fig. 26 Horses market, 2018 - 2030 (USD Million)
- Fig. 27 North America Veterinary Oncology Market by Therapy: Key Takeaways
- Fig. 28 North America Veterinary Oncology Market by Therapy, Market Share, 2024 & 2030
- Fig. 29 Radiotherapy market, 2018 - 2030 (USD Million)
- Fig. 30 Stereotactic Radiation Therapy market, 2018 - 2030 (USD Million)
- Fig. 31 LINAC market, 2018 - 2030 (USD Million)
- Fig. 32 Other Stereotactic Radiation Therapy market, 2018 - 2030 (USD Million)
- Fig. 33 Conventional Radiation Therapy market, 2018 - 2030 (USD Million)
- Fig. 34 Surgery market, 2018 - 2030 (USD Million)
- Fig. 35 Chemotherapy market, 2018 - 2030 (USD Million)
- Fig. 36 Immunotherapy market, 2018 - 2030 (USD Million)
- Fig. 37 Other therapies market, 2018 - 2030 (USD Million)
- Fig. 38 North America Veterinary Oncology Market by Cancer Type: Key Takeaways
- Fig. 39 North America Veterinary Oncology Market by Cancer Type, Market Share, 2024 & 2030
- Fig. 40 Skin Cancers market, 2018 - 2030 (USD Million)
- Fig. 41 Lymphomas market, 2018 - 2030 (USD Million)
- Fig. 42 Sarcomas market, 2018 - 2030 (USD Million)
- Fig. 43 Other market, 2018 - 2030 (USD Million)
- Fig. 44 Regional market share analysis, 2024 & 2030
- Fig. 45 Regional marketplace: Key takeaways
- Fig. 46 North America Veterinary Oncology Market estimates and forecasts, 2018 - 2030 (USD Million)
- Fig. 47 Key country dynamics
- Fig. 48 U.S. Veterinary Oncology Market estimates and forecasts, 2018 - 2030 (USD Million)
- Fig. 49 Key country dynamics
- Fig. 50 Canada Veterinary Oncology Market estimates and forecasts, 2018 - 2030 (USD Million)
- Fig. 51 Key country dynamics
- Fig. 52 Mexico Veterinary Oncology Market estimates and forecasts, 2018 - 2030 (USD Million)
- Fig. 53 Market Participant Categorization
- Fig. 54 Heat map analysis
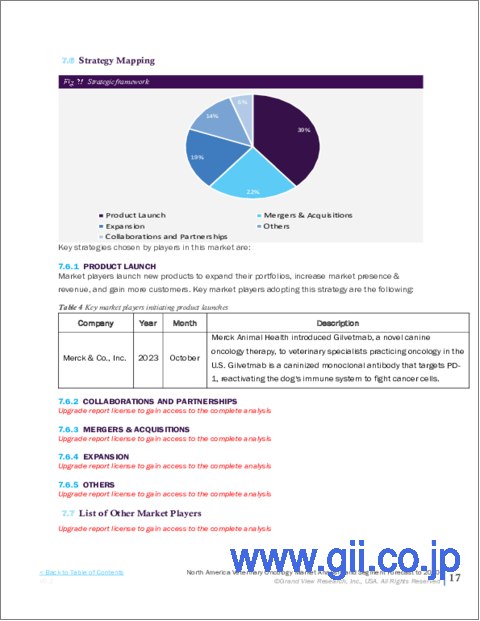
- Fig. 55 Strategic Framework
North America Veterinary Oncology Market Growth & Trends:
The North America veterinary oncology market size is expected to reach USD 1.22 billion by 2030, expanding at a CAGR of 10.70% from 2025 to 2030, according to a new report by Grand View Research, Inc. The market is driven by the rising incidence of cancer in pets, the number of veterinary clinical trials investigating the safety and effectiveness of various oncologic therapies, and the increasing penetration of pet insurance. Moreover, increasing strategic initiatives for R&D of targeted therapies for cancer in companion animals is boosting market growth. For instance, in July 2023, Ardent Animal Health partnered with FidoCure to expand access to oncology innovation in veterinary medicine by leveraging the latter's genomic testing and precision medicine platform.
During COVID-19, the market witnessed dampened growth owing to several challenges. The pandemic impacted veterinary cancer research & development efforts and the logistics supply of crucial pet pharmaceuticals. It also limited access to veterinary care. According to the Global Animal Health Association's 2020 report, pet owners in a study said that in many countries, veterinarian services were hampered by delayed or skipped care for pets. The pandemic, however, also accelerated the adoption of digital technologies to enhance care. In March 2020, PetCure Oncology upgraded its Telehealth options to enable pet families and referring veterinarians to remotely connect with its board-certified radiation oncologists.
The market is fragmented and competitive due to the presence of several small-to-large market players. Players are actively involved in deploying strategic initiatives to gain market share. For instance, in January 2022, Dechra acquired the rights to sell, market, and support Laverdia-CA1 (verdinexor tablets) in the U.S. from Anivive Lifesciences, Inc. In June 2022, Boehringer Ingelheim International GmbH entered into a research partnership with CarthroniX, a biopharma company, to develop small molecule therapeutics in canine oncology. In April 2023, Torigen Pharmaceuticals partnered with Veterinary Management Groups (VMG) to provide their experimental autologous prescription products and services to the latter's more than 2,000 member clinics network.
North America Veterinary Oncology Market Report Highlights:
- Based on animal type, the canine segment dominated the market in 2024 with a revenue share of over 86.25%. The feline segment, on the other hand, is projected to grow at the fastest CAGR of over 12.38% over the forecast period. This is attributed to the increasing partnerships and collaborations to further the development and launch of reliable veterinary cancer therapies. In October 2022, Ardent Animal Health, for example, completed a license agreement for a novel checkpoint inhibitor for canine cancer treatment
- In terms of therapy, the surgery segment dominated the market in 2024 with a revenue share of over 36.09%. Immunotherapy segment is estimated to grow at the fastest CAGR over the forecast period.
- Based on cancer type, the skin cancers segment dominated the market in 2024 with a revenue share of over 39.01%. The others segment is expected to grow at the fastest CAGR over the forecast period.
- Based on country, The veterinary oncology market in the U.S. held the largest share of 89.02% in the North American region in 2024 The growth in the U.S. is attributed to the presence of key players and strategic initiatives by market players. In April 2023, Torigen Pharmaceuticals opened a new production facility and headquarters in Farmington, Connecticut, U.S.
Table of Contents
Chapter 1. Methodology and Scope
- 1.1. Market Segmentation and Scope
- 1.1.1. Scope
- 1.1.2. Estimates And Forecast Timeline
- 1.2. Market Definitions
- 1.3. Research Methodology
- 1.4. Information Procurement
- 1.4.1. Purchased Database
- 1.4.2. GVR's Internal Database
- 1.5. Market Formulation & Validation
- 1.6. Model Details
- 1.6.1. Commodity flow analysis
- 1.6.2. Global Market: CAGR Calculation
- 1.7. Research Scope and Assumptions
- 1.7.1. List of Secondary Sources
- 1.7.2. List of Primary Sources
- 1.7.3. Objectives
Chapter 2. Executive Summary
- 2.1. Market Outlook
- 2.2. Segment Outlook
- 2.3. Competitive Insights
Chapter 3. North America Veterinary Oncology Market Variables, Trends, & Scope
- 3.1. Market Lineage Outlook
- 3.1.1. Parent Market Outlook
- 3.1.2. Related/Ancillary Market Outlook
- 3.2. Market Dynamics
- 3.2.1. Market Drivers Analysis
- 3.2.1.1. Increasing Prevalence Of Cancer In Pets
- 3.2.1.2. Increasing R&D In Pet Cancer Therapy
- 3.2.1.3. Growing Focus On Animal Safety
- 3.2.1.4. Growing Uptake Of Pet Insurance
- 3.2.1.5. Technological Advancements In Pet Cancer Treatment
- 3.2.1.6. Increase In Pet Population
- 3.2.2. Market Restraints Analysis
- 3.2.2.1. High cost of treatment
- 3.2.2.2. Adverse effects associated with therapies
- 3.2.2.3. Complex Regulatory Guidelines
- 3.2.3. Market Opportunity Analysis
- 3.2.4. Market Challenges Analysis
- 3.2.1. Market Drivers Analysis
- 3.3. North America Veterinary Oncology Market Analysis Tools
- 3.3.1. Porter's Analysis
- 3.3.1.1. Bargaining power of the suppliers
- 3.3.1.2. Bargaining power of the buyers
- 3.3.1.3. Threats of substitution
- 3.3.1.4. Threats from new entrants
- 3.3.1.5. Competitive rivalry
- 3.3.2. PESTEL Analysis
- 3.3.2.1. Political landscape
- 3.3.2.2. Economic and Social Landscape
- 3.3.2.3. Technological landscape
- 3.3.2.4. Environmental Landscape
- 3.3.2.5. Legal landscape
- 3.3.1. Porter's Analysis
- 3.4. Covid-19 Analysis
- 3.5. Estimated Pet Population, by key countries
Chapter 4. North America Veterinary Oncology Market: Animal Estimates & Trend Analysis
- 4.1. Segment Dashboard
- 4.2. North America Veterinary Oncology Market Movement Analysis
- 4.3. North America Veterinary Oncology Market Size & Trend Analysis, by Animal, 2018 to 2030 (USD Million)
- 4.4. Canine
- 4.4.1. Market estimates and forecasts, 2018 - 2030 (USD Million)
- 4.5. Feline
- 4.5.1. Market estimates and forecasts, 2018 - 2030 (USD Million)
- 4.6. Equine
- 4.6.1. Market estimates and forecasts, 2018 - 2030 (USD Million)
Chapter 5. North America Veterinary Oncology Market: Therapy Estimates & Trend Analysis
- 5.1. Segment Dashboard
- 5.2. North America Veterinary Oncology Market Movement Analysis
- 5.3. North America Veterinary Oncology Market Size & Trend Analysis, by Therapy, 2018 to 2030 (USD Million)
- 5.4. Radiotherapy
- 5.4.1. Market estimates and forecasts, 2018 - 2030 (USD Million)
- 5.4.2. Stereotactic Radiation Therapy
- 5.4.2.1. Market estimates and forecasts, 2018 - 2030 (USD Million)
- 5.4.2.2. LINAC
- 5.4.2.2.1. Market estimates and forecasts, 2018 - 2030 (USD Million)
- 5.4.2.3. Other Type
- 5.4.2.3.1. Market estimates and forecasts, 2018 - 2030 (USD Million)
- 5.4.3. Conventional Radiation Therapy
- 5.4.3.1. Market estimates and forecasts, 2018 - 2030 (USD Million)
- 5.5. Surgery
- 5.5.1. Market estimates and forecasts, 2018 - 2030 (USD Million)
- 5.6. Chemotherapy
- 5.6.1. Market estimates and forecasts, 2018 - 2030 (USD Million)
- 5.7. Immunotherapy
- 5.7.1. Market estimates and forecasts, 2018 - 2030 (USD Million)
- 5.8. Other Therapies
- 5.8.1. Market estimates and forecasts, 2018 - 2030 (USD Million)
Chapter 6. North America Veterinary Oncology Market: Cancer Type Estimates & Trend Analysis
- 6.1. Segment Dashboard
- 6.2. North America Veterinary Oncology Market Movement Analysis
- 6.3. North America Veterinary Oncology Market Size & Trend Analysis, by Cancer type, 2018 to 2030 (USD Million)
- 6.4. Skin Cancer
- 6.4.1. Market estimates and forecasts, 2018 - 2030 (USD Million)
- 6.5. Lymphomas
- 6.5.1. Market estimates and forecasts, 2018 - 2030 (USD Million)
- 6.6. Sarcomas
- 6.6.1. Market estimates and forecasts, 2018 - 2030 (USD Million)
- 6.7. Others
- 6.7.1. Market estimates and forecasts, 2018 - 2030 (USD Million)
Chapter 7. North America Veterinary Oncology Market: Regional Estimates & Trend Analysis
- 7.1. Regional Dashboard
- 7.2. Market Size & Forecasts and Trend Analysis, 2018 to 2030
- 7.3. North America
- 7.3.1. Market estimates and forecasts, 2018 - 2030 (USD Million)
- 7.3.2. U.S.
- 7.3.2.1. Key Country Dynamics
- 7.3.2.2. Competitive Insights
- 7.3.2.3. U.S. Veterinary Oncology Market Estimates and Forecasts, 2018 - 2030 (USD Million)
- 7.3.3. Canada
- 7.3.3.1. Key Country Dynamics
- 7.3.3.2. Competitive Insights
- 7.3.3.3. Canada Veterinary Oncology Market Estimates and Forecasts, 2018 - 2030 (USD Million)
- 7.3.4. Mexico
- 7.3.4.1. Key Country Dynamics
- 7.3.4.2. Competitive Insights
- 7.3.4.3. Canada Veterinary Oncology Market Estimates and Forecasts, 2018 - 2030 (USD Million)
Chapter 8. Competitive Landscape
- 8.1. Market Participant Categorization
- 8.2. Company Market Position Analysis/ Heat Map Analysis
- 8.3. Estimated Company Market Share Analysis, 2023
- 8.4. Strategy Mapping
- 8.4.1. Mergers & Acquisitions
- 8.4.2. Partnerships & Collaborations
- 8.4.3. Others
- 8.5. Company Profiles
- 8.5.1. Elanco
- 8.5.1.1. Participant's Overview
- 8.5.1.2. Financial Performance
- 8.5.1.3. Product Benchmarking
- 8.5.1.4. Strategic Initiatives
- 8.5.2. Boehringer Ingelheim International GmbH.
- 8.5.2.1. Participant's Overview
- 8.5.2.2. Financial Performance
- 8.5.2.3. Product Benchmarking
- 8.5.2.4. Strategic Initiatives
- 8.5.3. Zoetis
- 8.5.3.1. Participant's Overview
- 8.5.3.2. Financial Performance
- 8.5.3.3. Product Benchmarking
- 8.5.3.4. Strategic Initiatives
- 8.5.4. PetCure Oncology
- 8.5.4.1. Participant's Overview
- 8.5.4.2. Financial Performance
- 8.5.4.3. Product Benchmarking
- 8.5.4.4. Strategic Initiatives
- 8.5.5. Accuray Incorporated
- 8.5.5.1. Participant's Overview
- 8.5.5.2. Financial Performance
- 8.5.5.3. Product Benchmarking
- 8.5.5.4. Strategic Initiatives
- 8.5.6. Varian Medical Systems, Inc.
- 8.5.6.1. Participant's Overview
- 8.5.6.2. Financial Performance
- 8.5.6.3. Product Benchmarking
- 8.5.6.4. Strategic Initiatives
- 8.5.7. Elekta AB.
- 8.5.7.1. Participant's Overview
- 8.5.7.2. Financial Performance
- 8.5.7.3. Product Benchmarking
- 8.5.7.4. Strategic Initiatives
- 8.5.8. Karyopharm Therapeutics, Inc.
- 8.5.8.1. Participant's Overview
- 8.5.8.2. Financial Performance
- 8.5.8.3. Product Benchmarking
- 8.5.8.4. Strategic Initiatives
- 8.5.9. Virbac.
- 8.5.9.1. Participant's Overview
- 8.5.9.2. Financial Performance
- 8.5.9.3. Product Benchmarking
- 8.5.9.4. Strategic Initiatives
- 8.5.10. Merck & Co., Inc.
- 8.5.10.1. Participant's Overview
- 8.5.10.2. Financial Performance
- 8.5.10.3. Product Benchmarking
- 8.5.10.4. Strategic Initiatives
- 8.5.11. Dechra Pharmaceuticals PLC
- 8.5.11.1. Participant's Overview
- 8.5.11.2. Financial Performance
- 8.5.11.3. Product Benchmarking
- 8.5.11.4. Strategic Initiatives
- 8.5.12. NovaVive Inc.
- 8.5.12.1. Participant's Overview
- 8.5.12.2. Financial Performance
- 8.5.12.3. Product Benchmarking
- 8.5.12.4. Strategic Initiatives
- 8.5.13. Ardent Animal Health, LLC (A BreakthrU Company).
- 8.5.13.1. Participant's Overview
- 8.5.13.2. Financial Performance
- 8.5.13.3. Product Benchmarking
- 8.5.13.4. Strategic Initiatives
- 8.5.1. Elanco


