|
|
市場調査レポート
商品コード
1530554
IoTセンサーの市場規模、シェア、動向分析レポート:タイプ別、最終用途別、地域別、セグメント予測、2024年~2030年IoT Sensors Market Size, Share & Trends Analysis Report By Type, By End Use, By Region, And Segment Forecasts, 2024 - 2030 |
||||||
カスタマイズ可能
|
|||||||
| IoTセンサーの市場規模、シェア、動向分析レポート:タイプ別、最終用途別、地域別、セグメント予測、2024年~2030年 |
|
出版日: 2024年07月29日
発行: Grand View Research
ページ情報: 英文 150 Pages
納期: 2~10営業日
|
全表示
- 概要
- 図表
- 目次
IoTセンサーの市場規模と動向
世界のIoTセンサー市場規模は、2023年に133億6,000万米ドルと推定され、2024~2030年にかけてCAGR 36.8%で成長すると予測されています。この市場成長の背景には、自動車、小売、医療、航空宇宙、防衛、ビルディングオートメーション、製造業など、さまざまな業界でコネクテッドデバイスへの関心が高まっていることがあります。さらに、プロセスやワークフローを最適化し、エラーを特定し、応答時間を改善し、データ主導の戦略を立てるためのリアルタイムデータの重要性が高まっていることが、IoTセンサー市場に有利な機会を生み出しています。
世界各地の急速な都市化とスマートシティの同時開拓、スマートホームの普及は、IoTセンサー市場展望にプラスの影響を与えています。スマートホームやスマートビルの普及は、温度、湿度、照明、居住に関するデータを収集するセンサーの需要を促進しています。このデータは、遠隔監視、自動制御、エネルギー効率の改善を促進します。また、ナビゲーション、安全機能、自律走行技術のためにIoTセンサーを搭載したコネクテッドカーに対する需要の増加も、市場に大きな成長の道をもたらしています。
さらに、フィットネス意識の高まり、可処分所得の増加、スマートガジェットに対する消費者需要の増加といった要因が、IoTセンサー市場に大きな成長の道をもたらしています。スマートウォッチ、フィットネストラッカー、ヘルスモニターへの需要の高まりは、ハイエンドセンサーへの需要を刺激しています。一部のスマートウォッチには、高度な健康モニタリングのために血中酸素センサーや心電図(ECG)センサーが搭載されています。これらのガジェットは基本的にIoTセンサーに依存しているため、製品需要がさらに高まり、市場拡大が加速しています。
IoTセンサー市場の開拓は、進化する消費者ニーズに効果的に応えることができる最先端のセンサーソリューションを開発するために、市場参入企業が技術革新と技術進歩に重点を置くようになっていることによって、さらに推進されています。例えば、Sensirion AGは2024年5月、皮下プロセスにおけるドラッグデリバリー用の小型液体フローセンサープラットフォームSLD3xを発表しました。このソリューションは、様々な皮下治療において正確な投与と患者ケアの向上を保証するために設計されています。このような発展は、今後数年間の市場成長を後押しすると期待されています。
世界のIoTセンサー市場レポート区分
本レポートでは、2018~2030年の各サブセグメントにおける最新の市場動向と機会の分析とともに、世界、地域、国レベルでの収益成長を推定・予測しています。この調査において、Grand View Research, Inc.は世界のIoTセンサー市場レポートをタイプ、最終用途、地域に基づいてさらに細分化しています。
目次
第1章 調査手法と範囲
第2章 エグゼクティブサマリー
第3章 IoTセンサー市場-業界展望
- 市場系統の展望
- 業界バリューチェーン分析
- 市場力学
- 業界分析ツール
第4章 IoTセンサー市場:タイプ、推定・動向分析
- タイプ変動分析と市場シェア、2023年と2030年
- タイプ別
第5章 IoTセンサー市場:最終用途、推定・動向分析
- 最終用途変動分析と市場シェア、2023年と2030年
- 最終用途別
第6章 地域別、推定・動向分析
- 地域別IoTセンサー市場、2023年と2030年
- 北米
- 北米のIoTセンサー市場の推定と予測、2018~2030年
- 米国
- カナダ
- 欧州
- 欧州のIoTセンサー市場の推定と予測、2018~2030年
- ドイツ
- 英国
- フランス
- アジア太平洋
- アジア太平洋のIoTセンサー市場の推定と予測、2018~2030年
- 日本
- 中国
- インド
- 韓国
- オーストラリア
- ラテンアメリカ
- ラテンアメリカのIoTセンサー市場の推定と予測、2018~2030年
- ブラジル
- メキシコ
- 中東・アフリカ
- 中東・アフリカのIoTセンサー市場の推定と予測、2018~2030年
- アラブ首長国連邦
- サウジアラビア
- 南アフリカ
第7章 IoTセンサー市場-競合情勢
- 主要市場参入企業による最近の動向と影響分析
- 企業分類
- 参入企業概要
- 企業市場シェア分析、2023年
- 企業ヒートマップ分析
- 戦略マッピング
- 拡大
- 合併と買収
- コラボレーション/パートナーシップ
- 新製品の発売
- 企業プロファイル
- Texas Instruments
- TE Connectivity Corporation
- STMicroelectronics International NV
- NXP Semiconductor NV
- Infineon Technologies AG
- Honeywell International Inc.
- Siemens AG
- General Electric
- OMRON Corporation
- Murata Manufacturing Co., Ltd.
- Analog Devices, Inc.
- Robert Bosch GmbH
- Infineon Technologies AG
- Sensirion AG
List of Tables
- Table 1 IoT Sensors Market - Key Market Driver Impact
- Table 2 IoT Sensors Market - Key Market Restraint Impact
- Table 3 IoT Sensors Market Revenue Estimates and Forecast, By Type, 2018 - 2030 (USD Million)
- Table 4 IoT Sensors Market Revenue Estimates and Forecast, By End Use, 2018 - 2030 (USD Million)
- Table 5 IoT Sensors Market Revenue Estimates and Forecast, By End Use, 2018 - 2030 (USD Million)
- Table 6 Recent Developments & Impact Analysis, By Key Market Participants
- Table 7 Company Heat Map Analysis
- Table 8 Key companies undergoing expansions/divestitures
- Table 9 Key companies involved in mergers & acquisitions
- Table 10 Key companies undergoing collaborations.
- Table 11 Key companies launching new products
List of Tables
- Fig. 1 IoT Sensors Market Segmentation
- Fig. 2 Information Procurement
- Fig. 3 Data Analysis Models
- Fig. 4 Market Formulation and Validation
- Fig. 5 Data Validating & Publishing
- Fig. 6 Market Snapshot
- Fig. 7 Segment Snapshot (1/2)
- Fig. 8 Segment Snapshot (2/2)
- Fig. 9 Competitive Landscape Snapshot
- Fig. 10 IoT Sensors Market Value, 2023 - 2030 (USD Million)
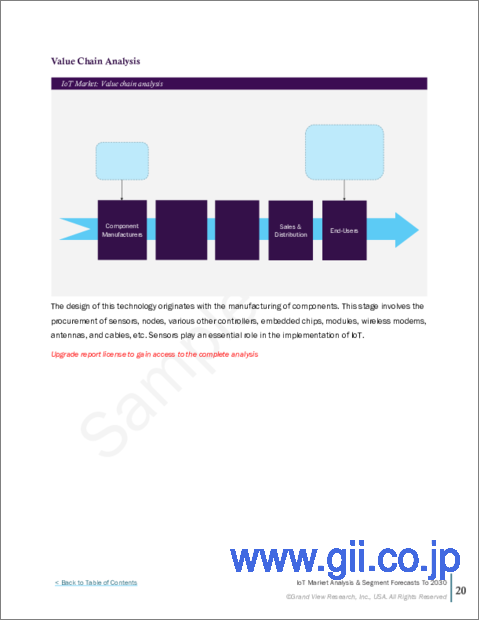
- Fig. 11 IoT Sensors Market- Industry Value Chain Analysis
- Fig. 12 Market Dynamics
- Fig. 13 Key Market Driver Impact
- Fig. 14 Key Market Restraint/Challenges Impact
- Fig. 15 IoT Sensors Market: PORTER's Analysis
- Fig. 16 IoT Sensors Market: PESTEL Analysis
- Fig. 17 IoT Sensors Market, by Type: Key Takeaways
- Fig. 18 IoT Sensors Market, by Type: Market Share, 2023 & 2030
- Fig. 19 Temperature Sensors Market Estimates & Forecasts, 2018 - 2030 (USD Million)
- Fig. 20 Motion Sensors Market Estimates & Forecasts, 2018 - 2030 (USD Million)
- Fig. 21 Light Sensors Market Estimates & Forecasts, 2018 - 2030 (USD Million)
- Fig. 22 Others & Humidity Market Estimates & Forecasts, 2018 - 2030 (USD Million)
- Fig. 23 IoT Sensors Market, by End Use: Key Takeaways
- Fig. 24 IoT Sensors Market, by End Use: Market Share, 2023 & 2030
- Fig. 25 Consumer Electronics Market Estimates & Forecasts, 2018 - 2030 (USD Million)
- Fig. 26 Wearable Devices Market Estimates & Forecasts, 2018 - 2030 (USD Million)
- Fig. 27 Automotive & Transportation Market Estimates & Forecasts, 2018 - 2030 (USD Million)
- Fig. 28 BFSI Estimates & Forecasts, 2018 - 2030 (USD Million)
- Fig. 29 Healthcare Market Estimates & Forecasts, 2018 - 2030 (USD Million)
- Fig. 30 Retail Market Estimates & Forecasts, 2018 - 2030 (USD Million)
- Fig. 31 Building Automation Market Estimates & Forecasts, 2018 - 2030 (USD Million)
- Fig. 32 Oil & Gas Market Estimates & Forecasts, 2018 - 2030 (USD Million)
- Fig. 33 Agriculture Market Estimates & Forecasts, 2018 - 2030 (USD Million)
- Fig. 34 Aerospace & Defense Market Estimates & Forecasts, 2018 - 2030 (USD Million)
- Fig. 35 Others Market Estimates & Forecasts, 2018 - 2030 (USD Million)
- Fig. 36 IoT Sensors Market by Region, 2023 & 2030, Revenue (USD Million)
- Fig. 37 Regional marketplace: Key takeaways
- Fig. 38 North America IoT Sensors Market Estimates & Forecast, 2018 - 2030 (USD Million)
- Fig. 39 U.S. IoT Sensors Market Estimates & Forecasts, 2018 - 2030 (USD Million)
- Fig. 40 Canada IoT Sensors Market Estimates & Forecasts, 2018 - 2030 (USD Million)
- Fig. 41 Europe IoT Sensors Market Estimates & Forecasts, 2018 - 2030 (USD Million)
- Fig. 42 Germany IoT Sensors Market Estimates & Forecasts, 2018 - 2030 (USD Million)
- Fig. 43 UK IoT Sensors Market Estimates & Forecasts, 2018 - 2030 (USD Million)
- Fig. 44 France IoT Sensors Market Estimates & Forecasts, 2018 - 2030 (USD Million)
- Fig. 45 Asia Pacific IoT Sensors Market Estimates & Forecasts, 2018 - 2030 (USD Million)
- Fig. 46 China IoT Sensors Market Estimates & Forecasts, 2018 - 2030 (USD Million)
- Fig. 47 India IoT Sensors Market Estimates & Forecasts, 2018 - 2030 (USD Million)
- Fig. 48 Japan IoT Sensors Market Estimates & Forecasts, 2018 - 2030 (USD Million)
- Fig. 49 South Korea IoT Sensors Market Estimates & Forecasts, 2018 - 2030 (USD Million)
- Fig. 50 Australia IoT Sensors Market Estimates & Forecasts, 2018 - 2030 (USD Million)
- Fig. 51 Latin America IoT Sensors Market Estimates & Forecasts, 2018 - 2030 (USD Million)
- Fig. 52 Brazil IoT Sensors Market Estimates & Forecasts, 2018 - 2030 (USD Million)
- Fig. 53 Mexico IoT Sensors Market Estimates & Forecasts, 2018 - 2030 (USD Million)
- Fig. 54 MEA IoT Sensors Market Estimates & Forecasts, 2018 - 2030 (USD Million)
- Fig. 55 UAE IoT Sensors Market Estimates & Forecasts, 2018 - 2030 (USD Million)
- Fig. 56 Saudi Arabia IoT Sensors Market Estimates & Forecasts, 2018 - 2030 (USD Million)
- Fig. 57 South Africa IoT Sensors Market Estimates & Forecasts, 2018 - 2030 (USD Million)
- Fig. 58 Key Company Categorization
- Fig. 59 Company Market Positioning
- Fig. 60 Strategic Framework
IoT Sensors Market Size & Trends
The global IoT sensors market size was estimated at USD 13.36 billion in 2023 and is expected to grow at a CAGR of 36.8% from 2024 to 2030. The market growth is attributed to the growing inclination for connected devices across several industry verticals, such as automotive, retail, healthcare, aerospace, defense, building automation, manufacturing, etc. Moreover, the growing significance of real-time data to optimize processes and workflows, identify errors, improve response times, and make data-driven strategies is creating lucrative opportunities for IoT sensors market.
Rapid urbanization across different parts of the world and simultaneous development of smart cities and proliferation of smart homes is positively influencing the IoT sensors market outlook. The popularity of smart homes and buildings is driving demand for sensors that collect data on temperature, humidity, lighting, and occupancy. This data facilitates remote monitoring, automated control, and improved energy efficiency. Besides, increasing demand for connected cars that are powered by IoT sensors for navigation, safety features, and autonomous driving technologies is also creating significant growth avenues for the market.
In addition, factors such as growing fitness consciousness, rising disposable incomes, and increasing consumer demand for smart gadgets are creating significant growth avenues for IoT sensors market. Increasing demand for smartwatches, fitness trackers, and health monitors is stimulating the demand for high-end sensors. Some smartwatches now feature blood oxygen sensors or electrocardiogram (ECG) sensors for advanced health monitoring. These gadgets essentially rely on IoT sensors which further fuels the product demand, accelerating the market expansion.
The growth of IoT sensors market is being further driven by the increasing focus of market players on innovation and technological advancements to develop cutting-edge sensor solutions that can effectively cater to the evolving consumer needs. For instance, in May 2024, Sensirion AG launched SLD3x, a miniature liquid flow sensor platform for drug delivery in subcutaneous processes. This solution has been designed to ensure precise dosing and improved patient care during various subcutaneous therapies. Such developments are expected to boost the market growth in coming years
Global IoT Sensors Market Report Segmentation
This report forecasts and estimates revenue growth at the global, regional, and country levels along with analyzes the latest market trends and opportunities in each one of the sub-segments from 2018 to 2030. For this study, Grand View Research has further segmented the global IoT sensors market report based on type, end use, and region:
- Type Outlook (Revenue, USD Million, 2018 - 2030)
- Temperature Sensors
- Motion Sensors
- Light Sensors
- Others
- End Use Outlook (Revenue, USD Million, 2018 - 2030)
- Consumer Electronics
- Wearable Devices
- Automotive & Transportation
- BFSI
- Healthcare
- Retail
- Building Automation
- Oil & Gas
- Agriculture
- Aerospace & Defense
- Others
- Regional Outlook (Revenue, USD Million, 2018 - 2030)
- North America
U.S.
Canada
- Europe
Germany
UK
France
- Asia Pacific
Japan
China
India
South Korea
Australia
- Latin America
Brazil
Mexico
- Middle East and Africa (MEA)
UAE
Saudi Arabia
South Africa
Table of Contents
Chapter 1. Methodology and Scope
- 1.1. Market Segmentation & Scope
- 1.2. Market Definitions
- 1.3. Information Procurement
- 1.3.1. Information analysis
- 1.3.2. Market formulation & data visualization
- 1.3.3. Data validation & publishing
- 1.4. 4 Research Scope and Assumptions
- 1.4.1. List of Data Sources
Chapter 2. Executive Summary
- 2.1. IoT Sensors Market Snapshot
- 2.2. IoT Sensors Market- Segment Snapshot (1/2)
- 2.3. IoT Sensors Market- Segment Snapshot (2/2)
- 2.4. IoT Sensors Market- Competitive Landscape Snapshot
Chapter 3. IoT Sensors Market - Industry Outlook
- 3.1. Market Lineage Outlook
- 3.2. Industry Value Chain Analysis
- 3.3. Market Dynamics
- 3.3.1. Market Driver Analysis
- 3.3.2. Market Restraint Analysis
- 3.3.3. Market Opportunity
- 3.3.4. Market Challenges
- 3.4. Industry Analysis Tools
- 3.4.1. Porter's analysis
- 3.4.2. Macroeconomic analysis
Chapter 4. IoT Sensors Market: Type Estimates & Trend Analysis
- 4.1. Type Movement Analysis & Market Share, 2023 & 2030
- 4.2. IoT Sensors Market Estimates & Forecast, By Type (USD Million)
- 4.2.1. Temperature Sensors
- 4.2.2. Motion Sensors
- 4.2.3. Light Sensors
- 4.2.4. Others
Chapter 5. IoT Sensors Market: End Use Estimates & Trend Analysis
- 5.1. End Use Movement Analysis & Market Share, 2023 & 2030
- 5.2. IoT Sensors Market Estimates & Forecast, By End Use (USD Million)
- 5.2.1. Consumer Electronics
- 5.2.2. Wearable Devices
- 5.2.3. Automotive & Transportation
- 5.2.4. BFSI
- 5.2.5. Healthcare
- 5.2.6. Retail
- 5.2.7. Building Automation
- 5.2.8. Oil & Gas
- 5.2.9. Agriculture
- 5.2.10. Aerospace & Defense
- 5.2.11. Others
Chapter 6. Regional Estimates & Trend Analysis
- 6.1. IoT Sensors Market by Region, 2023 & 2030
- 6.2. North America
- 6.2.1. North America IoT Sensors Market Estimates & Forecasts, 2018 - 2030 (USD Million)
- 6.2.2. U.S.
- 6.2.3. Canada
- 6.3. Europe
- 6.3.1. Europe IoT Sensors Market Estimates & Forecasts, 2018 - 2030 (USD Million)
- 6.3.2. Germany
- 6.3.3. UK
- 6.3.4. France
- 6.4. Asia Pacific
- 6.4.1. Asia Pacific IoT Sensors Market Estimates & Forecasts, 2018 - 2030 (USD Million)
- 6.4.2. Japan
- 6.4.3. China
- 6.4.4. India
- 6.4.5. South Korea
- 6.4.6. Australia
- 6.5. Latin America
- 6.5.1. Latin America IoT Sensors Market Estimates & Forecasts, 2018 - 2030 (USD Million)
- 6.5.2. Brazil
- 6.5.3. Mexico
- 6.6. Middle East & Africa (MEA)
- 6.6.1. MEA IoT Sensors Market Estimates & Forecasts, 2018 - 2030 (USD Million)
- 6.6.2. UAE
- 6.6.3. Saudi Arabia
- 6.6.4. South Africa
Chapter 7. IoT Sensors Market - Competitive Landscape
- 7.1. Recent Developments & Impact Analysis, By Key Market Participants
- 7.2. Company Categorization
- 7.3. Participant's Overview
- 7.4. Financial Performance
- 7.5. Product Benchmarking
- 7.6. Company Market Share Analysis, 2023
- 7.7. Company Heat Map Analysis
- 7.8. Strategy Mapping
- 7.8.1. Expansion
- 7.8.2. Merger & Acquisition
- 7.8.3. Collaborations/Partnerships
- 7.8.4. New Product Launches
- 7.9. Company Profiles
- 7.9.1. Texas Instruments
- 7.9.1.1. Participant's Overview
- 7.9.1.2. Financial Performance
- 7.9.1.3. Product Benchmarking
- 7.9.1.4. Recent Developments
- 7.9.2. TE Connectivity Corporation
- 7.9.2.1. Participant's Overview
- 7.9.2.2. Financial Performance
- 7.9.2.3. Product Benchmarking
- 7.9.2.4. Recent Developments
- 7.9.3. STMicroelectronics International N.V.
- 7.9.3.1. Participant's Overview
- 7.9.3.2. Financial Performance
- 7.9.3.3. Product Benchmarking
- 7.9.3.4. Recent Developments
- 7.9.4. NXP Semiconductor N.V.
- 7.9.4.1. Participant's Overview
- 7.9.4.2. Financial Performance
- 7.9.4.3. Product Benchmarking
- 7.9.4.4. Recent Developments
- 7.9.5. Infineon Technologies AG
- 7.9.5.1. Participant's Overview
- 7.9.5.2. Financial Performance
- 7.9.5.3. Product Benchmarking
- 7.9.5.4. Recent Developments
- 7.9.6. Honeywell International Inc.
- 7.9.6.1. Participant's Overview
- 7.9.6.2. Financial Performance
- 7.9.6.3. Product Benchmarking
- 7.9.6.4. Recent Developments
- 7.9.7. Siemens AG
- 7.9.7.1. Participant's Overview
- 7.9.7.2. Financial Performance
- 7.9.7.3. Product Benchmarking
- 7.9.7.4. Recent Developments
- 7.9.8. General Electric
- 7.9.8.1. Participant's Overview
- 7.9.8.2. Financial Performance
- 7.9.8.3. Product Benchmarking
- 7.9.8.4. Recent Developments
- 7.9.9. OMRON Corporation
- 7.9.9.1. Participant's Overview
- 7.9.9.2. Financial Performance
- 7.9.9.3. Product Benchmarking
- 7.9.9.4. Recent Developments
- 7.9.10. Murata Manufacturing Co., Ltd.
- 7.9.10.1. Participant's Overview
- 7.9.10.2. Financial Performance
- 7.9.10.3. Product Benchmarking
- 7.9.10.4. Recent Developments
- 7.9.11. Analog Devices, Inc.
- 7.9.11.1. Participant's Overview
- 7.9.11.2. Financial Performance
- 7.9.11.3. Product Benchmarking
- 7.9.11.4. Recent Developments
- 7.9.12. Robert Bosch GmbH
- 7.9.12.1. Participant's Overview
- 7.9.12.2. Financial Performance
- 7.9.12.3. Product Benchmarking
- 7.9.12.4. Recent Developments
- 7.9.13. Infineon Technologies AG
- 7.9.13.1. Participant's Overview
- 7.9.13.2. Financial Performance
- 7.9.13.3. Product Benchmarking
- 7.9.13.4. Recent Developments
- 7.9.14. Sensirion AG
- 7.9.14.1. Participant's Overview
- 7.9.14.2. Financial Performance
- 7.9.14.3. Product Benchmarking
- 7.9.14.4. Recent Developments
- 7.9.1. Texas Instruments


