|
|
市場調査レポート
商品コード
1530237
フローイメージング顕微鏡の市場規模、シェア、動向分析レポート:技術別、サンプル別、最終用途別、地域別、セグメント予測、2024年~2030年Flow Imaging Microscopy Market Size, Share & Trends Analysis Report By Technology (Dynamic Image Analysis, Static Image Analysis), By Sample (Large Molecule, Small Molecule, Liquid Sample), By End-use, By Region, and Segment Forecasts, 2024 - 2030 |
||||||

|
|||||||
カスタマイズ可能
|
|||||||

| フローイメージング顕微鏡の市場規模、シェア、動向分析レポート:技術別、サンプル別、最終用途別、地域別、セグメント予測、2024年~2030年 |
|
出版日: 2024年07月16日
発行: Grand View Research
ページ情報: 英文 90 Pages
納期: 2~10営業日
|

全表示
- 概要
- 図表
- 目次
フローイメージング顕微鏡の市場動向
フローイメージング顕微鏡の世界市場規模は、2023年に4,164万米ドルとなり、2024年から2030年にかけてCAGR 7.31%で成長すると予測されています。成長の要因としては、技術の進歩、さまざまな産業でのアプリケーションの増加、自動イメージングソリューションの需要増加、研究開発活動への注目の高まりなどが挙げられます。例えば、2023年4月、株式会社ニコンは、子会社の株式会社ニコンソリューションズを通じて、医療用デジタルイメージング顕微鏡ECLIPSE Uiを日本で発表しました。この革新的な顕微鏡は接眼レンズがなく、病理医の快適性を向上させ、ディスプレイ上での画像共有を可能にし、病理観察プロセスを効率化します。
人工知能や機械学習アルゴリズムの統合などの画像技術の進歩により、フローイメージング顕微鏡システムの機能が大幅に向上しました。これらの技術的進歩は、画質の向上、スループットの向上、データ解析能力の強化を実現しました。例えば、2023年10月、オリンパスは、イメージング技術の進歩からなるFV4000MPE多光子顕微鏡とFLUOVIEW FV4000共焦点レーザー走査型顕微鏡を発表しました。これらの顕微鏡は、低ノイズ、高精度、高感度を実現し、科学的イメージングの新たなスタンダードを確立し、研究者の新たな発見を可能にします。
個別化医療へのシフトにより、研究者の間でフローイメージング顕微鏡の需要が高まっています。ヘルスケアにおいてオーダーメイド医療が注目されるにつれ、個々の患者の特徴を細胞レベルで詳細に把握できる高度なイメージング技術へのニーズが高まっています。フローイメージング顕微鏡は、研究者や臨床医が細胞集団を迅速に分析することを可能にし、特定の患者プロファイルに基づく個別化治療戦略をサポートします。
フローイメージング顕微鏡の世界市場レポートセグメンテーション
このレポートは、世界、地域、国レベルで収益成長を予測し、2018年から2030年までの各サブセグメントにおける最新の業界動向の分析を提供しています。この調査において、Grand View Research社は世界のフローイメージング顕微鏡市場レポートを技術、サンプルタイプ、最終用途、地域に基づいてセグメント化しています。
- 技術展望(売上高、2018年~2030年)
- 動的画像解析。
- 静的画像解析。
- コンビネーションシステム。
- サンプルの展望(売上高、2018年~2030年)
- 大型分子。
- 低分子。
- 液体サンプル。
- その他のサンプル。
- 最終用途の展望(収益、2018年~2030年)
- バイオテクノロジーとライフサイエンス。
- 製薬。
- 材料科学。
- 環境。
- 食品・飲料。
- 化粧品とパーソナルケア。
- 地域別展望(売上高:2018年~2030年)
- 北米.
米国。
カナダ
メキシコ
- 欧州
英国
ドイツ
フランス
イタリア
スペイン
デンマーク
スウェーデン
ノルウェー
- アジア太平洋
日本
中国
インド
オーストラリア
韓国
タイ
- ラテンアメリカ
ブラジル
アルゼンチン
- 中東・アフリカ
南アフリカ
サウジアラビア
アラブ首長国連邦
クウェート
目次
第1章 調査手法と範囲
第2章 エグゼクティブサマリー
第3章 フローイメージング顕微鏡市場の変数、動向、範囲
- 市場系統の見通し
- 親市場の見通し
- 関連/補助的な市場見通し。
- 市場力学
- 市場牽引要因分析
- 市場抑制要因分析
- フローイメージング顕微鏡市場分析ツール
- 業界分析- ポーターのファイブフォース分析
- PESTEL分析
第4章 フローイメージング顕微鏡市場:技術推定・動向分析
- テクノロジー市場シェア、2023年と2030年
- セグメントダッシュボード
- 技術展望による世界のフローイメージング顕微鏡市場
- 2018年から2030年までの市場規模と予測および動向分析
第5章 フローイメージング顕微鏡市場:サンプル推定・動向分析
- 世界フローイメージング顕微鏡市場:サンプルダッシュボード
- 世界のフローイメージング顕微鏡市場:サンプル変動分析
- 世界のフローイメージング顕微鏡市場:治療、収益別
- 巨大分子
- 小分子
- 液体サンプル
- その他のサンプル
第6章 フローイメージング顕微鏡市場:最終用途の推定・動向分析
- 最終用途市場シェア、2023年および2030年
- セグメントダッシュボード
- 最終用途別世界フローイメージング顕微鏡市場展望
- 2018年から2030年までの市場規模と予測および動向分析
第7章 フローイメージング顕微鏡市場:地域推定・動向分析
- 地域別市場シェア分析、2023年および2030年
- 地域市場ダッシュボード
- 世界地域市場スナップショット
- 市場規模、予測動向分析、2018年から2030年:
- 北米
- 北米
- 米国
- カナダ
- メキシコ
- 欧州
- 欧州
- 英国
- ドイツ
- フランス
- イタリア
- スペイン
- デンマーク
- スウェーデン
- ノルウェー
- アジア太平洋
- アジア太平洋
- 日本
- 中国
- インド
- オーストラリア
- 韓国
- タイ
- ラテンアメリカ
- ラテンアメリカ
- ブラジル
- アルゼンチン
- 中東・アフリカ
- 中東・アフリカ
- 南アフリカ
- サウジアラビア
- アラブ首長国連邦
- クウェート
第8章 競合情勢
- 企業プロファイル
- Bettersize Instruments
- Bio-Techne
- Anton Paar
- Yokogawa Electric Corporation
- Microtrac MRB
- Micromeritics Instrument Corporation
- Fritsch
- Haver &Boecker
- Spectris
- HORIBA
- 企業の市況分析
- 企業/競合の分類
- 戦略マッピング
List of Tables
- Table 1 List of abbreviation
- Table 2 North America Flow Imaging Microscopy market, by region, 2018 - 2030 (USD Million)
- Table 3 North America Flow Imaging Microscopy market, by technology, 2018 - 2030 (USD Million)
- Table 4 North America Flow Imaging Microscopy market, by sample type, 2018 - 2030 (USD Million)
- Table 5 North America Flow Imaging Microscopy market, by end use, 2018 - 2030 (USD Million)
- Table 6 U.S. Flow Imaging Microscopy market, by technology, 2018 - 2030 (USD Million)
- Table 7 U.S. Flow Imaging Microscopy market, by sample type, 2018 - 2030 (USD Million)
- Table 8 U.S. Flow Imaging Microscopy market, by end use, 2018 - 2030 (USD Million)
- Table 9 Canada Flow Imaging Microscopy market, by technology, 2018 - 2030 (USD Million)
- Table 10 Canada Flow Imaging Microscopy market, by sample type, 2018 - 2030 (USD Million)
- Table 11 Canada Flow Imaging Microscopy market, by end use, 2018 - 2030 (USD Million)
- Table 12 Mexico Flow Imaging Microscopy market, by technology, 2018 - 2030 (USD Million)
- Table 13 Mexico Flow Imaging Microscopy market, by sample type, 2018 - 2030 (USD Million)
- Table 14 Mexico Flow Imaging Microscopy market, by end use, 2018 - 2030 (USD Million)
- Table 15 Europe Flow Imaging Microscopy market, by region, 2018 - 2030 (USD Million)
- Table 16 Europe Flow Imaging Microscopy market, by technology, 2018 - 2030 (USD Million)
- Table 17 Europe Flow Imaging Microscopy market, by sample type, 2018 - 2030 (USD Million)
- Table 18 Europe Flow Imaging Microscopy market, by end use, 2018 - 2030 (USD Million)
- Table 19 Germany Flow Imaging Microscopy market, by technology, 2018 - 2030 (USD Million)
- Table 20 Germany Flow Imaging Microscopy market, by sample type, 2018 - 2030 (USD Million)
- Table 21 Germany Flow Imaging Microscopy market, by end use, 2018 - 2030 (USD Million)
- Table 22 UK Flow Imaging Microscopy market, by technology, 2018 - 2030 (USD Million)
- Table 23 UK Flow Imaging Microscopy market, by sample type, 2018 - 2030 (USD Million)
- Table 24 UK Flow Imaging Microscopy market, by end use, 2018 - 2030 (USD Million)
- Table 25 France Flow Imaging Microscopy market, by technology, 2018 - 2030 (USD Million)
- Table 26 France Flow Imaging Microscopy market, by sample type, 2018 - 2030 (USD Million)
- Table 27 France Flow Imaging Microscopy market, by end use, 2018 - 2030 (USD Million)
- Table 28 Italy Flow Imaging Microscopy market, by technology, 2018 - 2030 (USD Million)
- Table 29 Italy Flow Imaging Microscopy market, by sample type, 2018 - 2030 (USD Million)
- Table 30 Italy Flow Imaging Microscopy market, by end use, 2018 - 2030 (USD Million)
- Table 31 Spain Flow Imaging Microscopy market, by technology, 2018 - 2030 (USD Million)
- Table 32 Spain Flow Imaging Microscopy market, by sample type, 2018 - 2030 (USD Million)
- Table 33 Spain Flow Imaging Microscopy market, by end use, 2018 - 2030 (USD Million)
- Table 34 Denmark Flow Imaging Microscopy market, by technology, 2018 - 2030 (USD Million)
- Table 35 Denmark Flow Imaging Microscopy market, by sample type, 2018 - 2030 (USD Million)
- Table 36 Denmark Flow Imaging Microscopy market, by end use, 2018 - 2030 (USD Million)
- Table 37 Sweden Flow Imaging Microscopy market, by technology, 2018 - 2030 (USD Million)
- Table 38 Sweden Flow Imaging Microscopy market, by sample type, 2018 - 2030 (USD Million)
- Table 39 Sweden Flow Imaging Microscopy market, by end use, 2018 - 2030 (USD Million)
- Table 40 Norway Flow Imaging Microscopy market, by technology, 2018 - 2030 (USD Million)
- Table 41 Norway Flow Imaging Microscopy market, by sample type, 2018 - 2030 (USD Million)
- Table 42 Norway Flow Imaging Microscopy market, by end use, 2018 - 2030 (USD Million)
- Table 43 Asia Pacific Flow Imaging Microscopy market, by region, 2018 - 2030 (USD Million)
- Table 44 Asia Pacific Flow Imaging Microscopy market, by technology, 2018 - 2030 (USD Million)
- Table 45 Asia Pacific Flow Imaging Microscopy market, by sample type, 2018 - 2030 (USD Million)
- Table 46 Asia Pacific Flow Imaging Microscopy market, by end use, 2018 - 2030 (USD Million)
- Table 47 China Flow Imaging Microscopy market, by technology, 2018 - 2030 (USD Million)
- Table 48 China Flow Imaging Microscopy market, by sample type, 2018 - 2030 (USD Million)
- Table 49 China Flow Imaging Microscopy market, by end use, 2018 - 2030 (USD Million)
- Table 50 Japan Flow Imaging Microscopy market, by technology, 2018 - 2030 (USD Million)
- Table 51 Japan Flow Imaging Microscopy market, by sample type, 2018 - 2030 (USD Million)
- Table 52 Japan Flow Imaging Microscopy market, by end use, 2018 - 2030 (USD Million)
- Table 53 India Flow Imaging Microscopy market, by technology, 2018 - 2030 (USD Million)
- Table 54 India Flow Imaging Microscopy market, by sample type, 2018 - 2030 (USD Million)
- Table 55 India Flow Imaging Microscopy market, by end use, 2018 - 2030 (USD Million)
- Table 56 South Korea Flow Imaging Microscopy market, by technology, 2018 - 2030 (USD Million)
- Table 57 South Korea Flow Imaging Microscopy market, by sample type, 2018 - 2030 (USD Million)
- Table 58 South Korea Flow Imaging Microscopy market, by end use, 2018 - 2030 (USD Million)
- Table 59 Australia Flow Imaging Microscopy market, by technology, 2018 - 2030 (USD Million)
- Table 60 Australia Flow Imaging Microscopy market, by sample type, 2018 - 2030 (USD Million)
- Table 61 Australia Flow Imaging Microscopy market, by end use, 2018 - 2030 (USD Million)
- Table 62 Thailand Flow Imaging Microscopy market, by technology, 2018 - 2030 (USD Million)
- Table 63 Thailand Flow Imaging Microscopy market, by sample type, 2018 - 2030 (USD Million)
- Table 64 Thailand Flow Imaging Microscopy market, by end use, 2018 - 2030 (USD Million)
- Table 65 Latin America Flow Imaging Microscopy market, by technology, 2018 - 2030 (USD Million)
- Table 66 Latin America Flow Imaging Microscopy market, by sample type, 2018 - 2030 (USD Million)
- Table 67 Latin America Flow Imaging Microscopy market, by end use, 2018 - 2030 (USD Million)
- Table 68 Brazil Flow Imaging Microscopy market, by technology, 2018 - 2030 (USD Million)
- Table 69 Brazil Flow Imaging Microscopy market, by sample type, 2018 - 2030 (USD Million)
- Table 70 Brazil Flow Imaging Microscopy market, by end use, 2018 - 2030 (USD Million)
- Table 71 Argentina Flow Imaging Microscopy market, by technology, 2018 - 2030 (USD Million)
- Table 72 Argentina Flow Imaging Microscopy market, by sample type, 2018 - 2030 (USD Million)
- Table 73 Argentina Flow Imaging Microscopy market, by end use, 2018 - 2030 (USD Million)
- Table 74 MEA Flow Imaging Microscopy market, by region, 2018 - 2030 (USD Million)
- Table 75 MEA Flow Imaging Microscopy market, by technology, 2018 - 2030 (USD Million)
- Table 76 MEA Flow Imaging Microscopy market, by sample type, 2018 - 2030 (USD Million)
- Table 77 MEA Flow Imaging Microscopy market, by end use, 2018 - 2030 (USD Million)
- Table 78 South Africa Flow Imaging Microscopy market, by technology, 2018 - 2030 (USD Million)
- Table 79 South Africa Flow Imaging Microscopy market, by sample type, 2018 - 2030 (USD Million)
- Table 80 South Africa Flow Imaging Microscopy market, by end use, 2018 - 2030 (USD Million)
- Table 81 Saudi Arabia Flow Imaging Microscopy market, by technology, 2018 - 2030 (USD Million)
- Table 82 Saudi Arabia Flow Imaging Microscopy market, by sample type, 2018 - 2030 (USD Million)
- Table 83 Saudi Arabia Flow Imaging Microscopy market, by end use, 2018 - 2030 (USD Million)
- Table 84 UAE Flow Imaging Microscopy market, by technology, 2018 - 2030 (USD Million)
- Table 85 UAE Flow Imaging Microscopy market, by sample type, 2018 - 2030 (USD Million)
- Table 86 UAE Flow Imaging Microscopy market, by end use, 2018 - 2030 (USD Million)
- Table 87 Kuwait Flow Imaging Microscopy market, by technology, 2018 - 2030 (USD Million)
- Table 88 Kuwait Flow Imaging Microscopy market, by sample type, 2018 - 2030 (USD Million)
- Table 89 Kuwait Flow Imaging Microscopy market, by end use, 2018 - 2030 (USD Million)
List of Figures
- Fig. 1 Market research process
- Fig. 2 Data triangulation techniques
- Fig. 3 Market research approaches
- Fig. 4 Value-chain-based sizing & forecasting
- Fig. 5 QFD modeling for market share assessment
- Fig. 6 Market formulation & validation
- Fig. 7 Flow Imaging Microscopy market: market outlook
- Fig. 8 Flow Imaging Microscopy competitive insights
- Fig. 9 Parent market outlook
- Fig. 10 Related/ancillary market outlook
- Fig. 11 Penetration and growth prospect mapping
- Fig. 12 Industry value chain analysis
- Fig. 13 Flow Imaging Microscopy market driver impact
- Fig. 14 Flow Imaging Microscopy market restraint impact
- Fig. 15 Flow Imaging Microscopy market strategic initiatives analysis
- Fig. 16 Flow Imaging Microscopy market: technology movement analysis
- Fig. 17 Flow Imaging Microscopy market: technology outlook and key takeaways
- Fig. 18 Dynamic image analysis market estimates and forecast, 2018 - 2030 (USD Million)
- Fig. 19 Static image analysis market estimates and forecast, 2018 - 2030 (USD Million)
- Fig. 20 Combination System market estimates and forecast, 2018 - 2030 (USD Million)
- Fig. 21 Flow Imaging Microscopy market: Sample type movement analysis
- Fig. 22 Flow Imaging Microscopy market: Sample type outlook and key takeaways
- Fig. 23 Large Molecule market estimates and forecast, 2018 - 2030 (USD Million)
- Fig. 24 Small Molecule market estimates and forecast, 2018 - 2030 (USD Million)
- Fig. 25 Liquid Sample market estimates and forecast, 2018 - 2030 (USD Million)
- Fig. 26 Other Samples market estimates and forecast, 2018 - 2030 (USD Million)
- Fig. 27 Flow Imaging Microscopy market: End use movement analysis
- Fig. 28 Flow Imaging Microscopy market: End use outlook and key takeaways
- Fig. 29 Biotechnology and life science market estimates and forecasts, 2018 - 2030 (USD Million)
- Fig. 30 Pharmaceutical market estimates and forecasts, 2018 - 2030 (USD Million)
- Fig. 31 Material science market estimates and forecasts, 2018 - 2030 (USD Million)
- Fig. 32 Environmental market estimates and forecasts, 2018 - 2030 (USD Million)
- Fig. 33 Food and beverage market estimates and forecasts, 2018 - 2030 (USD Million)
- Fig. 34 Cosmetics and personal care market estimates and forecasts, 2018 - 2030 (USD Million)
- Fig. 35 Global Flow Imaging Microscopy market: Regional movement analysis
- Fig. 36 Global Flow Imaging Microscopy market: Regional outlook and key takeaways
- Fig. 37 Global Flow Imaging Microscopy market share and leading players
- Fig. 38 North America market estimates and forecasts, 2018 - 2030 (USD Million)
- Fig. 39 U.S. key country dynamics
- Fig. 40 U.S. market estimates and forecasts, 2018 - 2030 (USD Million)
- Fig. 41 Canada key country dynamics
- Fig. 42 Canada market estimates and forecasts, 2018 - 2030 (USD Million)
- Fig. 43 Mexico key country dynamics
- Fig. 44 Mexico market estimates and forecasts, 2018 - 2030 (USD Million)
- Fig. 45 Europe market estimates and forecasts, 2018 - 2030 (USD Million)
- Fig. 46 UK key country dynamics
- Fig. 47 UK market estimates and forecasts, 2018 - 2030 (USD Million)
- Fig. 48 Germany key country dynamics
- Fig. 49 Germany market estimates and forecasts, 2018 - 2030 (USD Million)
- Fig. 50 France key country dynamics
- Fig. 51 France market estimates and forecasts, 2018 - 2030 (USD Million)
- Fig. 52 Italy key country dynamics
- Fig. 53 Italy market estimates and forecasts, 2018 - 2030 (USD Million)
- Fig. 54 Spain key country dynamics
- Fig. 55 Spain market estimates and forecasts, 2018 - 2030 (USD Million)
- Fig. 56 Denmark key country dynamics
- Fig. 57 Denmark market estimates and forecasts, 2018 - 2030 (USD Million)
- Fig. 58 Sweden key country dynamics
- Fig. 59 Sweden market estimates and forecasts, 2018 - 2030 (USD Million)
- Fig. 60 Norway key country dynamics
- Fig. 61 Norway market estimates and forecasts, 2018 - 2030 (USD Million)
- Fig. 62 Asia Pacific market estimates and forecasts, 2018 - 2030 (USD Million)
- Fig. 63 China key country dynamics
- Fig. 64 China market estimates and forecasts, 2018 - 2030 (USD Million)
- Fig. 65 Japan key country dynamics
- Fig. 66 Japan market estimates and forecasts, 2018 - 2030 (USD Million)
- Fig. 67 India key country dynamics
- Fig. 68 India market estimates and forecasts, 2018 - 2030 (USD Million)
- Fig. 69 Australia key country dynamics
- Fig. 70 Australia market estimates and forecasts, 2018 - 2030 (USD Million)
- Fig. 71 South Korea key country dynamics
- Fig. 72 South Korea market estimates and forecasts, 2018 - 2030 (USD Million)
- Fig. 73 Thailand key country dynamics
- Fig. 74 Thailand market estimates and forecasts, 2018 - 2030 (USD Million)
- Fig. 75 Latin America market estimates and forecasts, 2018 - 2030 (USD Million)
- Fig. 76 Brazil key country dynamics
- Fig. 77 Brazil market estimates and forecasts, 2018 - 2030 (USD Million)
- Fig. 78 Argentina key country dynamics
- Fig. 79 Argentina market estimates and forecasts, 2018 - 2030 (USD Million)
- Fig. 80 Middle East and Africa market estimates and forecasts, 2018 - 2030 (USD Million)
- Fig. 81 South Africa key country dynamics
- Fig. 82 South Africa market estimates and forecasts, 2018 - 2030 (USD Million)
- Fig. 83 Saudi Arabia key country dynamics
- Fig. 84 Saudi Arabia market estimates and forecasts, 2018 - 2030 (USD Million)
- Fig. 85 UAE key country dynamics
- Fig. 86 UAE market estimates and forecasts, 2018 - 2030 (USD Million)
- Fig. 87 Kuwait key country dynamics
- Fig. 88 Kuwait market estimates and forecasts, 2018 - 2030 (USD Million)
Flow Imaging Microscopy Market Trends
The global flow imaging microscopy market size was valued at USD 41.64 million in 2023 and is projected to grow at a CAGR of 7.31% from 2024 to 2030. Factors contributing to the growth include technological advancements, increasing applications across various industries, rising demand for automated imaging solutions, and the growing focus on research and development activities. For instance in April 2023, Nikon Corporation introduced the ECLIPSE Ui digital imaging microscope for medical use in Japan through its subsidiary, Nikon Solutions Co., Ltd. This innovative microscope lacks an eyepiece lens, enhancing pathologists' comfort and enabling image sharing on displays, streamlining pathological observation processes.
Advancements in imaging technology, such as the integration of artificial intelligence and machine learning algorithms, significantly enhanced the capabilities of flow imaging microscopy systems. These technological advancements improved image quality, higher throughput, and enhanced data analysis capabilities. For instance, in October 2023, Olympus unveiled the FV4000MPE multiphoton and FLUOVIEW FV4000 confocal laser scanning microscopes, which comprise advancements in imaging technology. These microscopes bear reduced noise, higher precision, and improved sensitivity, setting a new standard for scientific imaging and enabling researchers to make novel discoveries.
The shift towards personalized medicine has led to growing demand for flow imaging microscopy among researchers. As customized medicine gains prominence in healthcare, there is a growing need for advanced imaging techniques that can provide detailed insights into individual patient characteristics at a cellular level. Flow imaging microscopy enables researchers and clinicians to rapidly analyse cell populations, supporting personalized treatment strategies based on specific patient profiles.
Global Flow Imaging Microscopy Market Report Segmentation
This report forecasts revenue growth at global, regional, and country levels and provides an analysis of the latest industry trends in each of the sub-segments from 2018 to 2030. For this study, Grand View Research has segmented the global flow imaging microscopy market report on the basis of technology, sample type, end-use, and region.
- Technology Outlook (Revenue, USD Million, 2018 - 2030)
- Dynamic Image Analysis
- Static Image Analysis
- Combination System
- Sample Outlook (Revenue, USD Million, 2018 - 2030)
- Large Molecule
- Small Molecule
- Liquid Sample
- Other Samples
- End Use Outlook (Revenue, USD Million, 2018 - 2030)
- Biotechnology and Life Science
- Pharmaceutical
- Material Science
- Environmental
- Food and Beverage
- Cosmetics and Personal Care
- Regional Outlook (Revenue in USD Million, 2018 - 2030)
- North America
U.S.
Canada
Mexico
- Europe
UK
Germany
France
Italy
Spain
Denmark
Sweden
Norway
- Asia Pacific
Japan
China
India
Australia
South Korea
Thailand
- Latin America
Brazil
Argentina
- Middle East and Africa
South Africa
Saudi Arabia
UAE
Kuwait
Table of Contents
Chapter 1. Methodology and Scope
- 1.1. Market Segmentation & Scope
- 1.2. Segment Definitions
- 1.2.1. Technology
- 1.2.2. Sample
- 1.2.3. End Use
- 1.2.4. Regional scope
- 1.2.5. Estimates and forecasts timeline.
- 1.3. Research Methodology
- 1.4. Information Procurement
- 1.4.1. Purchased database
- 1.4.2. GVR's internal database
- 1.4.3. Secondary sources
- 1.4.4. Primary research
- 1.4.5. Details of primary research
- 1.5. Information or Data Analysis
- 1.5.1. Data analysis models
- 1.6. Market Formulation & Validation
- 1.7. Model Details
- 1.7.1. Commodity flow analysis (Model 1)
- 1.7.2. Approach 1: Commodity flow approach
- 1.7.3. Volume price analysis (Model 2)
- 1.7.4. Approach 2: Volume price analysis
- 1.8. List of Secondary Sources
- 1.9. List of Primary Sources
- 1.10. Objectives
Chapter 2. Executive Summary
- 2.1. Market Outlook
- 2.2. Segment Outlook
- 2.2.1. Technology outlook
- 2.2.2. Sample outlook
- 2.2.3. End Use outlook
- 2.2.4. Regional outlook
- 2.3. Competitive Insights
Chapter 3. Flow Imaging Microscopy Market Variables, Trends & Scope
- 3.1. Market Lineage Outlook
- 3.1.1. Parent market outlook
- 3.1.2. Related/ancillary market outlook.
- 3.2. Market Dynamics
- 3.2.1. Market driver analysis
- 3.2.1.1. Increased investments in pharmaceutical research
- 3.2.1.2. Regulatory guidelines for Technology quality
- 3.2.1.3. Technological advancements
- 3.2.2. Market restraint analysis
- 3.2.2.1. Technological limitations
- 3.2.1. Market driver analysis
- 3.3. Flow Imaging Microscopy Market Analysis Tools
- 3.3.1. Industry Analysis - Porter's Five Forces Analysis
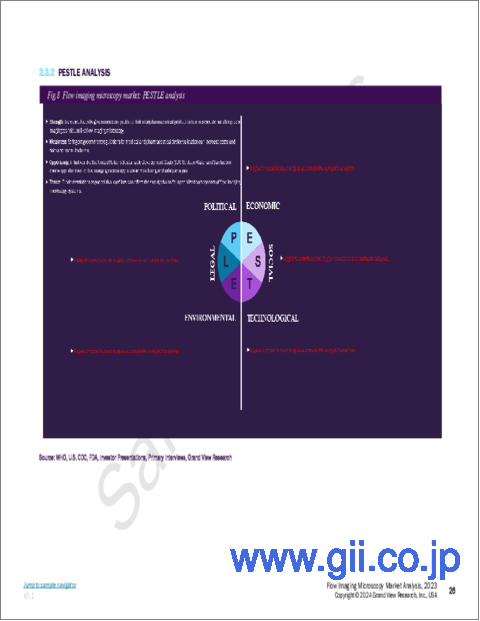
- 3.3.2. PESTEL Analysis
Chapter 4. Flow Imaging Microscopy Market: Technology Estimates & Trend Analysis
- 4.1. Technology Market Share, 2023 & 2030
- 4.2. Segment Dashboard
- 4.3. Global Flow Imaging Microscopy Market by Technology Outlook
- 4.4. Market Size & Forecasts and Trend Analyses, 2018 to 2030 for the following
- 4.4.1. Dynamic image analysis
- 4.4.1.1. Dynamic image analysis market estimates and forecasts 2018 to 2030 (USD Million)
- 4.4.2. Static Image Analysis
- 4.4.2.1. Static image analysis market estimates and forecasts 2018 to 2030 (USD Million)
- 4.4.3. Combination System
- 4.4.3.1. Combination System market estimates and forecasts 2018 to 2030 (USD Million)
- 4.4.1. Dynamic image analysis
Chapter 5. Flow Imaging Microscopy Market: Sample Estimates & Trend Analysis
- 5.1. Global Flow Imaging Microscopy Market: Sample Dashboard
- 5.2. Global Flow Imaging Microscopy Market: Sample Movement Analysis
- 5.3. Global Flow Imaging Microscopy Market by Treatment, Revenue
- 5.4. Large Molecule
- 5.4.1. Large Molecule market estimates and forecasts 2018 to 2030 (USD Million)
- 5.5. Small Molecule
- 5.5.1. Small Molecule market estimates and forecasts 2018 to 2030 (USD Million)
- 5.6. Liquid Sample
- 5.6.1. Liquid Sample market estimates and forecasts 2018 to 2030 (USD Million)
- 5.7. Other Samples
- 5.7.1. Other Samples market estimates and forecasts 2018 to 2030 (USD Million)
Chapter 6. Flow Imaging Microscopy Market: End Use Estimates & Trend Analysis
- 6.1. End Use Market Share, 2023 & 2030
- 6.2. Segment Dashboard
- 6.3. Global Flow Imaging Microscopy Market by End Use Outlook
- 6.4. Market Size & Forecasts and Trend Analyses, 2018 to 2030 for the following
- 6.4.1. Biotechnology and Life Science
- 6.4.1.1. Biotechnology and life science market estimates and forecasts 2018 to 2030 (USD Million)
- 6.4.2. Pharmaceutical
- 6.4.2.1. Pharmaceutical market estimates and forecasts 2018 to 2030 (USD Million)
- 6.4.3. Material Science
- 6.4.3.1. Material Science market estimates and forecasts 2018 to 2030 (USD Million)
- 6.4.4. Environmental
- 6.4.4.1. Environmental market estimates and forecasts 2018 to 2030 (USD Million)
- 6.4.5. Food and Beverage
- 6.4.5.1. Food and Beverage market estimates and forecasts 2018 to 2030 (USD Million)
- 6.4.6. Cosmetics and Personal Care
- 6.4.6.1. Cosmetics and Personal Care market estimates and forecasts 2018 to 2030 (USD Million)
- 6.4.1. Biotechnology and Life Science
Chapter 7. Flow Imaging Microscopy Market: Regional Estimates & Trend Analysis
- 7.1. Regional Market Share Analysis, 2023 & 2030
- 7.2. Regional Market Dashboard
- 7.3. Global Regional Market Snapshot
- 7.4. Market Size, & Forecasts Trend Analysis, 2018 to 2030:
- 7.5. North America
- 7.5.1. North America
- 7.5.2. U.S.
- 7.5.2.1. Key country dynamics
- 7.5.2.2. Regulatory framework
- 7.5.2.3. Competitive scenario
- 7.5.2.4. U.S. market estimates and forecasts 2018 to 2030 (USD Million)
- 7.5.3. Canada
- 7.5.3.1. Key country dynamics
- 7.5.3.2. Regulatory framework
- 7.5.3.3. Competitive scenario
- 7.5.3.4. Canada market estimates and forecasts 2018 to 2030 (USD Million)
- 7.5.4. Mexico
- 7.5.4.1. Key country dynamics
- 7.5.4.2. Regulatory framework
- 7.5.4.3. Competitive scenario
- 7.5.4.4. Mexico market estimates and forecasts 2018 to 2030 (USD Million)
- 7.6. Europe
- 7.6.1. Europe
- 7.6.2. UK
- 7.6.2.1. Key country dynamics
- 7.6.2.2. Regulatory framework/ Reimbursement
- 7.6.2.3. Competitive scenario
- 7.6.2.4. UK market estimates and forecasts 2018 to 2030 (USD Million)
- 7.6.3. Germany
- 7.6.3.1. Key country dynamics
- 7.6.3.2. Regulatory framework/ Reimbursement
- 7.6.3.3. Competitive scenario
- 7.6.3.4. Germany market estimates and forecasts 2018 to 2030 (USD Million)
- 7.6.4. France
- 7.6.4.1. Key country dynamics
- 7.6.4.2. Regulatory framework/ Reimbursement
- 7.6.4.3. Competitive scenario
- 7.6.4.4. France market estimates and forecasts 2018 to 2030 (USD Million)
- 7.6.5. Italy
- 7.6.5.1. Key country dynamics
- 7.6.5.2. Regulatory framework/ Reimbursement
- 7.6.5.3. Competitive scenario
- 7.6.5.4. Italy market estimates and forecasts 2018 to 2030 (USD Million)
- 7.6.6. Spain
- 7.6.6.1. Key country dynamics
- 7.6.6.2. Regulatory framework
- 7.6.6.3. Competitive scenario
- 7.6.6.4. Spain market estimates and forecasts 2018 to 2030 (USD Million)
- 7.6.7. Denmark
- 7.6.7.1. Key country dynamics
- 7.6.7.2. Regulatory framework/ Reimbursement
- 7.6.7.3. Competitive scenario
- 7.6.7.4. Denmark market estimates and forecasts 2018 to 2030 (USD Million)
- 7.6.8. Sweden
- 7.6.8.1. Key country dynamics
- 7.6.8.2. Regulatory framework
- 7.6.8.3. Competitive scenario
- 7.6.8.4. Sweden market estimates and forecasts 2018 to 2030 (USD Million)
- 7.6.9. Norway
- 7.6.9.1. Key country dynamics
- 7.6.9.2. Regulatory framework
- 7.6.9.3. Competitive scenario
- 7.6.9.4. Norway market estimates and forecasts 2018 to 2030 (USD Million)
- 7.7. Asia Pacific
- 7.7.1. Asia Pacific
- 7.7.2. Japan
- 7.7.2.1. Key country dynamics
- 7.7.2.2. Regulatory framework/ Reimbursement
- 7.7.2.3. Competitive scenario
- 7.7.2.4. Japan market estimates and forecasts 2018 to 2030 (USD Million)
- 7.7.3. China
- 7.7.3.1. Key country dynamics
- 7.7.3.2. Regulatory framework/ Reimbursement
- 7.7.3.3. Competitive scenario
- 7.7.3.4. China market estimates and forecasts 2018 to 2030 (USD Million)
- 7.7.4. India
- 7.7.4.1. Key country dynamics
- 7.7.4.2. Regulatory framework/ Reimbursement
- 7.7.4.3. Competitive scenario
- 7.7.4.4. India market estimates and forecasts 2018 to 2030 (USD Million)
- 7.7.5. Australia
- 7.7.5.1. Key country dynamics
- 7.7.5.2. Regulatory framework/ Reimbursement
- 7.7.5.3. Competitive scenario
- 7.7.5.4. Australia market estimates and forecasts 2018 to 2030 (USD Million)
- 7.7.6. South Korea
- 7.7.6.1. Key country dynamics
- 7.7.6.2. Regulatory framework/ Reimbursement
- 7.7.6.3. Competitive scenario
- 7.7.6.4. South Korea market estimates and forecasts 2018 to 2030 (USD Million)
- 7.7.7. Thailand
- 7.7.7.1. Key country dynamics
- 7.7.7.2. Regulatory framework/ Reimbursement
- 7.7.7.3. Competitive scenario
- 7.7.7.4. Thailand market estimates and forecasts 2018 to 2030 (USD Million)
- 7.8. Latin America
- 7.8.1. Latin America
- 7.8.2. Brazil
- 7.8.2.1. Key country dynamics
- 7.8.2.2. Regulatory framework
- 7.8.2.3. Competitive scenario
- 7.8.2.4. Brazil market estimates and forecasts 2018 to 2030 (USD Million)
- 7.8.3. Argentina
- 7.8.3.1. Key country dynamics
- 7.8.3.2. Regulatory framework/ Reimbursement
- 7.8.3.3. Competitive scenario
- 7.8.3.4. Argentina market estimates and forecasts 2018 to 2030 (USD Million)
- 7.9. MEA
- 7.9.1. MEA
- 7.9.2. South Africa
- 7.9.2.1. Key country dynamics
- 7.9.2.2. Regulatory framework/ Reimbursement
- 7.9.2.3. Competitive scenario
- 7.9.2.4. South Africa market estimates and forecasts 2018 to 2030 (USD Million)
- 7.9.3. Saudi Arabia
- 7.9.3.1. Key country dynamics
- 7.9.3.2. Regulatory framework/ Reimbursement
- 7.9.3.3. Competitive scenario
- 7.9.3.4. Saudi Arabia market estimates and forecasts 2018 to 2030 (USD Million)
- 7.9.4. UAE
- 7.9.4.1. Key country dynamics
- 7.9.4.2. Regulatory framework/ Reimbursement
- 7.9.4.3. Competitive scenario
- 7.9.4.4. UAE market estimates and forecasts 2018 to 2030 (USD Million)
- 7.9.5. Kuwait
- 7.9.5.1. Key country dynamics
- 7.9.5.2. Regulatory framework
- 7.9.5.3. Competitive scenario
- 7.9.5.4. Kuwait market estimates and forecasts 2018 to 2030 (USD Million)
Chapter 8. Competitive Landscape
- 8.1. Company Profiles
- 8.1.1. Bettersize Instruments
- 8.1.1.1. Company overview
- 8.1.1.2. Financial performance
- 8.1.1.3. Product benchmarking
- 8.1.1.4. Strategic initiatives
- 8.1.2. Bio-Techne
- 8.1.2.1. Company overview
- 8.1.2.2. Financial performance
- 8.1.2.3. Product benchmarking
- 8.1.2.4. Strategic initiatives
- 8.1.3. Anton Paar
- 8.1.3.1. Company overview
- 8.1.3.2. Financial performance
- 8.1.3.3. Product benchmarking
- 8.1.3.4. Strategic initiatives
- 8.1.4. Yokogawa Electric Corporation
- 8.1.4.1. Company overview
- 8.1.4.2. Financial performance
- 8.1.4.3. Product benchmarking
- 8.1.4.4. Strategic initiatives
- 8.1.5. Microtrac MRB
- 8.1.5.1. Company overview
- 8.1.5.2. Financial performance
- 8.1.5.3. Product benchmarking
- 8.1.5.4. Strategic initiatives
- 8.1.6. Micromeritics Instrument Corporation
- 8.1.6.1. Company overview
- 8.1.6.2. Financial performance
- 8.1.6.3. Product benchmarking
- 8.1.6.4. Strategic initiatives
- 8.1.7. Fritsch
- 8.1.7.1. Company overview
- 8.1.7.2. Financial performance
- 8.1.7.3. Product benchmarking
- 8.1.7.4. Strategic initiatives
- 8.1.8. Haver & Boecker
- 8.1.8.1. Company overview
- 8.1.8.2. Financial performance
- 8.1.8.3. Product benchmarking
- 8.1.8.4. Strategic initiatives
- 8.1.9. Spectris
- 8.1.9.1. Company overview
- 8.1.9.2. Financial performance
- 8.1.9.3. Product benchmarking
- 8.1.9.4. Strategic initiatives
- 8.1.10. HORIBA
- 8.1.10.1. Company overview
- 8.1.10.2. Financial performance
- 8.1.10.3. Product benchmarking
- 8.1.10.4. Strategic initiatives
- 8.1.1. Bettersize Instruments
- 8.2. Company Market Position Analysis
- 8.3. Company/Competition Categorization
- 8.4. Strategy Mapping
