|
|
市場調査レポート
商品コード
1529792
ペプチドマイクロアレイの市場規模、シェア、動向分析レポート:タイプ別、用途別、最終用途別、地域別、セグメント別予測、2024年~2030年Peptide Microarray Market Size, Share & Trends Analysis Report By Type (Reagents, Services), Application (Disease Diagnostics, Protein Functional Analysis), By End Use, By Region, And Segment Forecasts, 2024 - 2030 |
||||||

|
|||||||
カスタマイズ可能
|
|||||||

| ペプチドマイクロアレイの市場規模、シェア、動向分析レポート:タイプ別、用途別、最終用途別、地域別、セグメント別予測、2024年~2030年 |
|
出版日: 2024年07月18日
発行: Grand View Research
ページ情報: 英文 120 Pages
納期: 2~10営業日
|

全表示
- 概要
- 図表
- 目次
ペプチドマイクロアレイ市場の成長と動向:
Grand View Research, Inc.の最新レポートによると、世界のペプチドマイクロアレイ市場規模は、2024年から2030年にかけてCAGR 6.18%を記録し、2030年には4億2,730万米ドルに達すると予測されています。
同市場は予測期間中、安定した成長率が見込まれます。この技術には、臨床アッセイやプロテオミクスの分野におけるハイスループット技術が含まれます。ペプチドマイクロアレイは、分光法、質量分析、蛍光によるイメージングによって分析することができます。医学、薬学、生物学の分野でかなり応用されています。治療法の発見、病気の診断、診断技術の開発に使用される実験から大量のデータを収集する自動化された先端技術の一つです。
この方法は、新薬の標的を同定するために使用されます。細菌のタンパク質表面に存在する抗原の検出、Absの決定、免疫原性の同定、エピトープのマッピング、バイオマーカーの検証、血清プロファイリング、酵素の特性解析、HLAプロファイリングなどは、ペプチドマイクロアレイの応用例の一部です。診断テスト開発のためのペプチドマイクロアレイの使用は、業界成長の重要な決定要因であると考えられています。2021年3月に発表された調査によると、ペプチドマイクロアレイはCOVID-19ベースの診断テストを開発するための抗原に関する重要な洞察を提供できます。調査チームはペプチドマイクロアレイを使って、ウイルスに対する抗体のサンプルをスクリーニングしました。したがって、ペプチドマイクロアレイベースの検査法の開発は、業界の成長を後押しすると期待されています。
例えば、JPT Peptide Technologiesは、COVID-19および感染症用のペプチドマイクロアレイを小売価格324米ドルで商品化しています。この技術は、免疫検出とモニタリング、バイオマーカー探索、タンパク質相互作用の検証に使用できます。主要企業は、世界中に強力な販売網を確立するための戦略的取り組みに注力しています。例えば、PEPperPRINT GmbHは、4A Biotech Co.Ltd.、Filgen, Inc.、東京未来スタイル、AbClon Inc.、東京未来スタイル台湾、Sciencewerke Co.同社は、同地域において間接的な流通戦略を採用しています。この戦略により、同社は規制対応や顧客獲得のコストを回避することができました。
ペプチドマイクロアレイ市場レポートハイライト
- 機器タイプセグメントはサービスセグメントよりも比較的成熟しており、抗体ベースの研究のために社内に研究ステーションを設置する製薬・バイオテクノロジー企業が多いことから、2023年には最大シェアを占めました。
- 疾病診断アプリケーション分野は、新興市場における感染症の罹患率の高さから、2023年に最大の売上シェアを獲得しました。例えば、PEPperPRINT GmbHは32以上の感染症に対するペプチドマイクロアレイを提供しています。
- 製薬・バイオテクノロジー企業のエンドユーザー分野は、抗体の特性解析やタンパク質相互作用の検証に広く利用されているため、2023年に最大の収益シェアを占めました。
- 北米は、研究開発部門への投資増加とともに、同地域で確立されたヘルスケア施設があるため、2023年の全体収益で最大のシェアを占めました。
- 慢性疾患の早期発見と治療に対するヘルスケア専門家や患者の意識の高まりも、診断能力を加速させ、この地域の成長を後押ししています。
- さらに、慢性疾患や感染症などの疾病の罹患率の増加が、この地域市場への企業の参入を促しています。
目次
第1章 調査手法と範囲
第2章 エグゼクティブサマリー
第3章 ペプチドマイクロアレイ市場の変数、動向、範囲
- 市場系統の見通し
- 親市場の見通し
- 関連/付随市場見通し
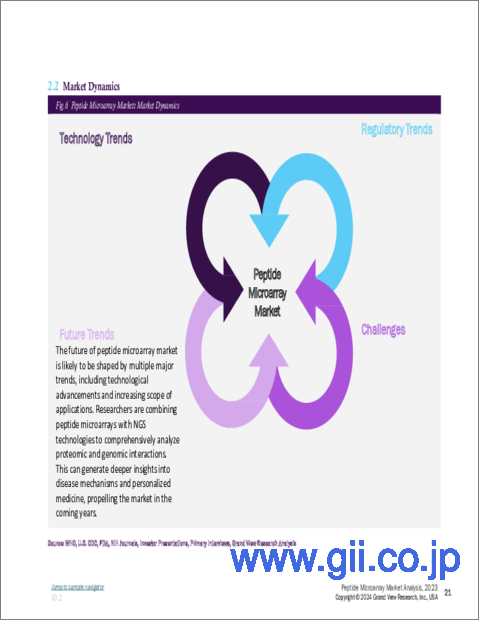
- 市場力学
- 市場牽引要因分析
- 市場抑制要因分析
- ペプチドマイクロアレイ市場分析ツール
- 業界分析- ポーターのファイブフォース分析
- PESTEL分析
- COVID-19の影響分析
第4章 ペプチドマイクロアレイ市場:タイプ別推定・動向分析
- セグメントダッシュボード
- 世界のペプチドマイクロアレイ市場:タイプ別変動分析
- 世界のペプチドマイクロアレイ市場:規模と動向分析、タイプ別、2018~2030年
- 機器
- 試薬
- サービス
第5章 ペプチドマイクロアレイ市場:用途別推定・動向分析
- セグメントダッシュボード
- 世界のペプチドマイクロアレイ市場:用途別変動分析
- 世界のペプチドマイクロアレイ市場:規模と動向分析、用途別、2018~2030年
- 疾患診断
- タンパク質機能解析
- 抗体の特性評価
- 創薬
第6章 ペプチドマイクロアレイ市場:最終用途別推定・動向分析
- セグメントダッシュボード
- 世界のペプチドマイクロアレイ市場:最終用途別変動分析
- 世界のペプチドマイクロアレイ市場:規模と動向分析、最終用途別、2018~2030年
- 製薬・バイオテクノロジー企業
- 病院・クリニック
- 診断センター
- その他
第7章 ペプチドマイクロアレイ市場:地域別推定・動向分析
- 地域別市場シェア分析、2023年および2030年
- 地域用途市場ダッシュボード
- 市場規模と予測動向分析、2018年から2030年:
- 北米
- 北米市場推計・予測、2018年から2030年
- 米国
- カナダ
- メキシコ
- 欧州
- 欧州市場推計・予測、2018年から2030年
- 英国
- ドイツ
- フランス
- イタリア
- スペイン
- デンマーク
- スウェーデン
- ノルウェー
- アジア太平洋
- アジア太平洋市場推計・予測、2018年から2030年
- 日本
- 中国
- インド
- 韓国
- オーストラリア
- タイ
- ラテンアメリカ
- ラテンアメリカ市場推計・予測、2018年から2030年
- ブラジル
- アルゼンチン
- 中東・アフリカ
- 中東・アフリカ市場推計・予測、2018年から2030年
- 南アフリカ
- サウジアラビア
- アラブ首長国連邦
- クウェート
第8章 競合情勢
- 企業/競合の分類
- 戦略マッピング
- 企業市況分析、2023年
- 企業プロファイル/上場企業
- PEPperPRINT GmbH
- RayBiotech, Inc.
- Creative Biolabs.
- Aurora Biomed Inc.
- Kinexus Bioinformatics Corporation
- Bio-Synthesis Inc.
- Microarrays Inc.
- Arryait Corporation(ARYC).
- JPT Peptide Technologies
- Merck KGaA
- Innopsys
- Nimble Therapeutics, Inc.
List of Tables
- Table 1 List of abbreviations
- Table 2 Global peptide microarray market, by region, 2018 - 2030 (USD Million)
- Table 3 Global peptide microarray market, by type, 2018 - 2030 (USD Million)
- Table 4 Global peptide microarray market, by application, 2018 - 2030 (USD Million)
- Table 5 Global peptide microarray market, by End Use, 2018 - 2030 (USD Million)
- Table 6 North America peptide microarray market, by country, 2018 - 2030 (USD Million)
- Table 7 North America peptide microarray market, by type, 2018 - 2030 (USD Million)
- Table 8 North America peptide microarray market, by application, 2018 - 2030 (USD Million)
- Table 9 North America peptide microarray market, by End Use, 2018 - 2030 (USD Million)
- Table 10 U.S. peptide microarray market, by type, 2018 - 2030 (USD Million)
- Table 11 U.S. peptide microarray market, by application, 2018 - 2030 (USD Million)
- Table 12 U.S. peptide microarray market, by End Use, 2018 - 2030 (USD Million)
- Table 13 Canada peptide microarray market, by type, 2018 - 2030 (USD Million)
- Table 14 Canada peptide microarray market, by application, 2018 - 2030 (USD Million)
- Table 15 Canada peptide microarray market, by End Use, 2018 - 2030 (USD Million)
- Table 16 Mexico peptide microarray market, by type, 2018 - 2030 (USD Million)
- Table 17 Mexico peptide microarray market, by application, 2018 - 2030 (USD Million)
- Table 18 Mexico peptide microarray market, by End Use, 2018 - 2030 (USD Million)
- Table 19 Europe peptide microarray market, by country, 2018 - 2030 (USD Million)
- Table 20 Europe peptide microarray market, by type, 2018 - 2030 (USD Million)
- Table 21 Europe peptide microarray market, by application, 2018 - 2030 (USD Million)
- Table 22 Europe peptide microarray market, by End Use, 2018 - 2030 (USD Million)
- Table 23 Germany peptide microarray market, by type, 2018 - 2030 (USD Million)
- Table 24 Germany peptide microarray market, by application, 2018 - 2030 (USD Million)
- Table 25 Germany peptide microarray market, by End Use, 2018 - 2030 (USD Million)
- Table 26 UK peptide microarray market, by type, 2018 - 2030 (USD Million)
- Table 27 UK peptide microarray market, by application, 2018 - 2030 (USD Million)
- Table 28 UK peptide microarray market, by End Use, 2018 - 2030 (USD Million)
- Table 29 France peptide microarray market, by type, 2018 - 2030 (USD Million)
- Table 30 France peptide microarray market, by application, 2018 - 2030 (USD Million)
- Table 31 France peptide microarray market, by End Use, 2018 - 2030 (USD Million)
- Table 32 Italy peptide microarray market, by type, 2018 - 2030 (USD Million)
- Table 33 Italy peptide microarray market, by application, 2018 - 2030 (USD Million)
- Table 34 Italy peptide microarray market, by End Use, 2018 - 2030 (USD Million)
- Table 35 Spain peptide microarray market, by type, 2018 - 2030 (USD Million)
- Table 36 Spain peptide microarray market, by application, 2018 - 2030 (USD Million)
- Table 37 Spain peptide microarray market, by End Use, 2018 - 2030 (USD Million)
- Table 38 Denmark peptide microarray market, by type, 2018 - 2030 (USD Million)
- Table 39 Denmark peptide microarray market, by application, 2018 - 2030 (USD Million)
- Table 40 Denmark peptide microarray market, by End Use, 2018 - 2030 (USD Million)
- Table 41 Sweden peptide microarray market, by type, 2018 - 2030 (USD Million)
- Table 42 Sweden peptide microarray market, by application, 2018 - 2030 (USD Million)
- Table 43 Sweden peptide microarray market, by End Use, 2018 - 2030 (USD Million)
- Table 44 Norway peptide microarray market, by type, 2018 - 2030 (USD Million)
- Table 45 Norway peptide microarray market, by application, 2018 - 2030 (USD Million)
- Table 46 Norway peptide microarray market, by End Use, 2018 - 2030 (USD Million)
- Table 47 Asia Pacific peptide microarray market, by country, 2018 - 2030 (USD Million)
- Table 48 Asia Pacific peptide microarray market, by type, 2018 - 2030 (USD Million)
- Table 49 Asia Pacific peptide microarray market, by application, 2018 - 2030 (USD Million)
- Table 50 Asia Pacific peptide microarray market, by End Use, 2018 - 2030 (USD Million)
- Table 51 China peptide microarray market, by application, 2018 - 2030 (USD Million)
- Table 52 China peptide microarray market, by type, 2018 - 2030 (USD Million)
- Table 53 China peptide microarray market, by End Use, 2018 - 2030 (USD Million)
- Table 54 Japan peptide microarray market, by type, 2018 - 2030 (USD Million)
- Table 55 Japan peptide microarray market, by application, 2018 - 2030 (USD Million)
- Table 56 Japan peptide microarray market, by End Use, 2018 - 2030 (USD Million)
- Table 57 India peptide microarray market, by type, 2018 - 2030 (USD Million)
- Table 58 India peptide microarray market, by application, 2018 - 2030 (USD Million)
- Table 59 India peptide microarray market, by End Use, 2018 - 2030 (USD Million)
- Table 60 South Korea peptide microarray market, by type, 2018 - 2030 (USD Million)
- Table 61 South Korea peptide microarray market, by application, 2018 - 2030 (USD Million)
- Table 62 South Korea peptide microarray market, by End Use, 2018 - 2030 (USD Million)
- Table 63 Australia peptide microarray market, by type, 2018 - 2030 (USD Million)
- Table 64 Australia peptide microarray market, by application, 2018 - 2030 (USD Million)
- Table 65 Australia peptide microarray market, by End Use, 2018 - 2030 (USD Million)
- Table 66 Thailand peptide microarray market, by type, 2018 - 2030 (USD Million)
- Table 67 Thailand peptide microarray market, by application, 2018 - 2030 (USD Million)
- Table 68 Thailand peptide microarray market, by End Use, 2018 - 2030 (USD Million)
- Table 69 Latin America peptide microarray market, by country, 2018 - 2030 (USD Million)
- Table 70 Latin America peptide microarray market, by type, 2018 - 2030 (USD Million)
- Table 71 Latin America peptide microarray market, by application, 2018 - 2030 (USD Million)
- Table 72 Latin America peptide microarray market, by End Use, 2018 - 2030 (USD Million)
- Table 73 Brazil peptide microarray market, by type, 2018 - 2030 (USD Million)
- Table 74 Brazil peptide microarray market, by application, 2018 - 2030 (USD Million)
- Table 75 Brazil peptide microarray market, by End Use, 2018 - 2030 (USD Million)
- Table 76 Argentina peptide microarray market, by type, 2018 - 2030 (USD Million)
- Table 77 Argentina peptide microarray market, by application, 2018 - 2030 (USD Million)
- Table 78 Argentina peptide microarray market, by End Use, 2018 - 2030 (USD Million)
- Table 79 MEA peptide microarray market, by country, 2018 - 2030 (USD Million)
- Table 80 MEA peptide microarray market, by type, 2018 - 2030 (USD Million)
- Table 81 MEA peptide microarray market, by application, 2018 - 2030 (USD Million)
- Table 82 MEA peptide microarray market, by End Use, 2018 - 2030 (USD Million)
- Table 83 South Africa peptide microarray market, by type, 2018 - 2030 (USD Million)
- Table 84 South Africa peptide microarray market, by application, 2018 - 2030 (USD Million)
- Table 85 South Africa peptide microarray market, by End Use, 2018 - 2030 (USD Million)
- Table 86 Saudi Arabia peptide microarray market, by type, 2018 - 2030 (USD Million)
- Table 87 Saudi Arabia peptide microarray market, by application, 2018 - 2030 (USD Million)
- Table 88 Saudi Arabia peptide microarray market, by End Use, 2018 - 2030 (USD Million)
- Table 89 UAE peptide microarray market, by type, 2018 - 2030 (USD Million)
- Table 90 UAE peptide microarray market, by application, 2018 - 2030 (USD Million)
- Table 91 UAE peptide microarray market, by End Use, 2018 - 2030 (USD Million)
- Table 92 Kuwait peptide microarray market, by type, 2018 - 2030 (USD Million)
- Table 93 Kuwait peptide microarray market, by application, 2018 - 2030 (USD Million)
- Table 94 Kuwait peptide microarray market, by End Use, 2018 - 2030 (USD Million)
List of Figures
- Fig. 1 Market research process
- Fig. 2 Data triangulation techniques
- Fig. 3 Market formulation & validation
- Fig. 4 Peptide microarray market: Market outlook
- Fig. 5 Peptide microarray market: Segment outlook
- Fig. 6 Peptide microarray market: Competitive landscape outlook
- Fig. 7 Parent market outlook
- Fig. 8 Peptide microarray market driver impact
- Fig. 9 Peptide microarray market restraint impact
- Fig. 10 Peptide microarray market: Type outlook and key takeaways
- Fig. 11 Peptide microarray market: Type movement analysis
- Fig. 12 Instruments market estimates and forecast, 2018 - 2030 (USD Million)
- Fig. 13 Reagents microarray market estimates and forecast, 2018 - 2030 (USD Million)
- Fig. 14 Services microarray market estimates and forecast, 2018 - 2030 (USD Million)
- Fig. 15 Peptide microarray market: Application outlook and key takeaways
- Fig. 16 Peptide microarray market: Application movement analysis
- Fig. 17 Disease diagnostics market estimates and forecasts, 2018 - 2030 (USD Million)
- Fig. 18 Protein functional analysis market estimates and forecasts, 2018 - 2030 (USD Million)
- Fig. 19 Antibody characterization market estimates and forecasts,2018 - 2030 (USD Million)
- Fig. 20 Drug discovery market estimates and forecasts,2018 - 2030 (USD Million)
- Fig. 21 Peptide microarray market: End Use outlook and key takeaways
- Fig. 22 Peptide microarray market: End Use movement analysis
- Fig. 23 Pharmaceutical & biotechnology companies market estimates and forecasts,2018 - 2030 (USD Million)
- Fig. 24 Hospitals & clinics market estimates and forecasts, 2018 - 2030 (USD Million)
- Fig. 25 Diagnostic centers market estimates and forecasts, 2018 - 2030 (USD Million)
- Fig. 26 Others market estimates and forecasts, 2018 - 2030 (USD Million)
- Fig. 27 Global peptide microarray market: Regional outlook and key takeaways
- Fig. 28 Global peptide microarray market: Regional movement analysis
- Fig. 29 North America market estimates and forecasts, 2018 - 2030 (USD Million)
- Fig. 30 Key country dynamics
- Fig. 31 U.S. market estimates and forecasts, 2018 - 2030 (USD Million)
- Fig. 32 Key country dynamics
- Fig. 33 Canada market estimates and forecasts, 2018 - 2030 (USD Million)
- Fig. 34 Key country dynamics
- Fig. 35 Mexico market estimates and forecasts, 2018 - 2030 (USD Million)
- Fig. 36 Europe market estimates and forecasts, 2018 - 2030 (USD Million)
- Fig. 37 Key country dynamics
- Fig. 38 UK market estimates and forecasts, 2018 - 2030 (USD Million)
- Fig. 39 Key country dynamics
- Fig. 40 Germany market estimates and forecasts, 2018 - 2030 (USD Million)
- Fig. 41 Key country dynamics
- Fig. 42 France market estimates and forecasts, 2018 - 2030 (USD Million)
- Fig. 43 Key country dynamics
- Fig. 44 Italy market estimates and forecasts, 2018 - 2030 (USD Million)
- Fig. 45 Key country dynamics
- Fig. 46 Spain market estimates and forecasts, 2018 - 2030 (USD Million)
- Fig. 47 Key country dynamics
- Fig. 48 Denmark market estimates and forecasts, 2018 - 2030 (USD Million)
- Fig. 49 Key country dynamics
- Fig. 50 Sweden market estimates and forecasts, 2018 - 2030 (USD Million)
- Fig. 51 Key country dynamics
- Fig. 52 Norway market estimates and forecasts, 2018 - 2030 (USD Million)
- Fig. 53 Asia Pacific market estimates and forecasts, 2018 - 2030 (USD Million)
- Fig. 54 Key country dynamics
- Fig. 55 Japan market estimates and forecasts, 2018 - 2030 (USD Million)
- Fig. 56 Key country dynamics
- Fig. 57 China market estimates and forecasts, 2018 - 2030 (USD Million)
- Fig. 58 Key country dynamics
- Fig. 59 India market estimates and forecasts, 2018 - 2030 (USD Million)
- Fig. 60 Key country dynamics
- Fig. 61 South Korea market estimates and forecasts, 2018 - 2030 (USD Million)
- Fig. 62 Key country dynamics
- Fig. 63 Australia market estimates and forecasts, 2018 - 2030 (USD Million)
- Fig. 64 Key country dynamics
- Fig. 65 Thailand market estimates and forecasts, 2018 - 2030 (USD Million)
- Fig. 66 Latin America market estimates and forecasts, 2018 - 2030 (USD Million)
- Fig. 67 Key country dynamics
- Fig. 68 Brazil market estimates and forecasts, 2018 - 2030 (USD Million)
- Fig. 69 Key country dynamics
- Fig. 70 Argentina market estimates and forecasts, 2018 - 2030 (USD Million)
- Fig. 71 Middle East and Africa market estimates and forecasts, 2018 - 2030 (USD Million)
- Fig. 72 Key country dynamics
- Fig. 73 South Africa market estimates and forecasts, 2018 - 2030 (USD Million)
- Fig. 74 Key country dynamics
- Fig. 75 Saudi Arabia market estimates and forecasts, 2018 - 2030 (USD Million)
- Fig. 76 Key country dynamics
- Fig. 77 UAE market estimates and forecasts, 2018 - 2030 (USD Million)
- Fig. 78 Key country dynamics
- Fig. 79 Kuwait market estimates and forecasts, 2018 - 2030 (USD Million)
Peptide Microarray Market Growth & Trends:
The global peptide microarray market size is expected to reach USD 427.3 million by 2030, registering a CAGR of 6.18% from 2024 to 2030, according to a new report by Grand View Research, Inc. The market is expected to witness a stable growth rate during the forecast period. The technique includes high throughput technologies in the area of clinical assays and proteomics. Peptide microarray can be analyzed through spectroscopy, mass spectrometry, and imaging via fluorescence. It has considerable applications in the field of medicine, pharmacology, and biology. It is one of the automated advanced technologies to collect a large volume of data from an experiment employed for therapeutic discoveries, disease diagnosis, and diagnostic technique development.
The method is employed to identify new drug targets. To detect the antigen present on the protein surface of bacteria, determination of Abs, immunogenic Identification, mapping of the epitope, biomarker validation, serum profiling, enzyme characterization, and HLA profiling are some of the applications of the peptide microarray. The use of peptide microarray for developing diagnostic tests is considered to be an important determinant of industry growth. According to research published in March 2021, peptide microarray can offer significant insights into the antigens for developing the COVID-19-based diagnostic test. Researchers used peptide microarrays to screen the samples for antibodies against the virus. Hence, the development of peptide microarray-based tests is expected to boost industry growth.
For instance, JPT Peptide Technologies commercializes peptide microarray for COVID-19 and infectious conditions at the retail price of USD 324. The technology can be used for immune detection and monitoring, biomarker discovery, and protein interaction validation. Key players are focusing on strategic initiatives to establish a strong distribution network across the globe. For instance, PEPperPRINT GmbH created its presence in the Asia Pacific regional market through distributors such as 4A Biotech Co., Ltd., Filgen, Inc., Tokyo Future Style, Inc., AbClon Inc., Tokyo Future Style Taiwan, Inc., Sciencewerke Co., Ltd., and TrendBio. The company adopted an indirect distribution strategy in the region. The strategy assisted the company to avoid the costs of regulatory compliance and customer acquisitions.
Peptide Microarray Market Report Highlights:
- The instruments type segment is relatively more mature than the services segment and held the largest share in 2023 due to the high number of pharma & biotech companies establishing in-house research stations for antibody-based research
- The disease diagnostics application segment captured the largest revenue share in 2023 owing to the high incidence of infectious diseases in emerging markets. For instance, PEPperPRINT GmbH offers peptide microarray for over 32 infectious conditions
- The pharmaceutical & biotechnology companies end-user segment held the maximum revenue share in 2023 due to the wide use of antibody characterization and validation of protein interactions
- North America accounted for the largest share of the overall revenue in 2023 due to the well-established healthcare facilities in this region along with increased investment in the R&D sector
- The rising awareness among healthcare professionals and patients about the early detection and treatment of chronic diseases also speeds up diagnostic capabilities and boosts the region's growth
- Moreover, the increasing incidence of diseases, such as chronic and infectious diseases, is encouraging companies to enter the regional market
Table of Contents
Chapter 1. Methodology and Scope
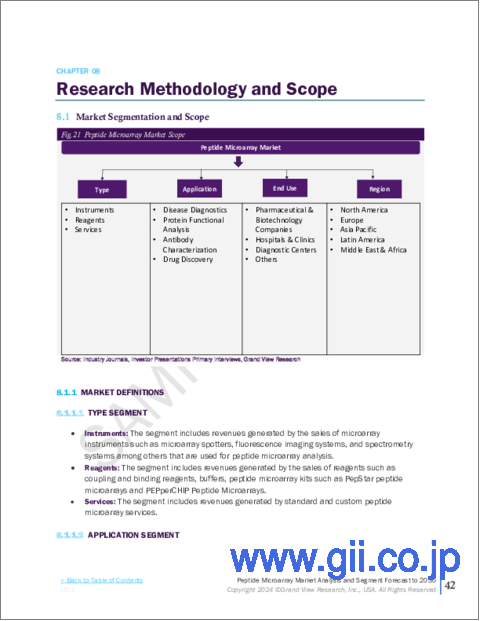
- 1.1. Market Segmentation and Scope
- 1.2. Market Definitions
- 1.2.1. Type Segment
- 1.2.2. Application Segment
- 1.2.3. End Use Segment
- 1.3. Information analysis
- 1.4. Market formulation & data visualization
- 1.5. Data validation & publishing
- 1.6. Information Procurement
- 1.6.1. Primary Research
- 1.7. Information or Data Analysis
- 1.8. Market Formulation & Validation
- 1.9. Market Model
- 1.10. Objectives
Chapter 2. Executive Summary
- 2.1. Market Outlook
- 2.2. Segment Snapshot
- 2.3. Competitive Insights Landscape
Chapter 3. Peptide Microarrays Market Variables, Trends & Scope
- 3.1. Market Lineage Outlook
- 3.1.1. Parent market outlook
- 3.1.2. Related/ancillary market outlook.
- 3.2. Market Dynamics
- 3.2.1. Market driver analysis
- 3.2.1.1. Growing burden of chronic diseases
- 3.2.1.2. Technological advancements in diagnostic testing
- 3.2.1.3. Rising adoption of peptide microarrays
- 3.2.2. Market restraint analysis
- 3.2.2.1. Reimbursement issues
- 3.2.1. Market driver analysis
- 3.3. Peptide Microarrays Market Analysis Tools
- 3.3.1. Industry Analysis - Porter's
- 3.3.2. PESTEL Analysis
- 3.3.3. COVID-19 Impact Analysis
Chapter 4. Peptide Microarrays Market: Type Estimates & Trend Analysis
- 4.1. Segment Dashboard
- 4.2. Global Peptide Microarrays Market Type Movement Analysis
- 4.3. Global Peptide Microarrays Market Size & Trend Analysis, by Type, 2018 to 2030 (USD Million)
- 4.4. Instruments
- 4.4.1. Instruments market estimates and forecasts, 2018 to 2030 (USD Million)
- 4.5. Reagents
- 4.5.1. Reagents market estimates and forecasts, 2018 to 2030 (USD Million)
- 4.6. Services
- 4.6.1. Services market estimates and forecasts, 2018 to 2030 (USD Million)
Chapter 5. Peptide Microarrays Market: Application Estimates & Trend Analysis
- 5.1. Segment Dashboard
- 5.2. Global Peptide Microarrays Market Application Movement Analysis
- 5.3. Global Peptide Microarrays Market Size & Trend Analysis, by Application, 2018 to 2030 (USD Million)
- 5.4. Disease Diagnosis
- 5.4.1. Disease diagnosis market estimates and forecasts, 2018 to 2030 (USD Million)
- 5.5. Protein Functional Analysis
- 5.5.1. Protein functional analysis market estimates and forecasts, 2018 to 2030 (USD Million)
- 5.6. Antibody Characterization
- 5.6.1. Antibody characterization market estimates and forecasts, 2018 to 2030 (USD Million)
- 5.7. Drug Discovery
- 5.7.1. Drug discovery market estimates and forecasts, 2018 to 2030 (USD Million)
Chapter 6. Peptide Microarrays Market: End Use Estimates & Trend Analysis
- 6.1. Segment Dashboard
- 6.2. Global Peptide Microarrays Market End Use Movement Analysis
- 6.3. Global Peptide Microarrays Market Size & Trend Analysis, by End Use, 2018 to 2030 (USD Million)
- 6.4. Pharmaceutical & Biotechnology Companies
- 6.4.1. Pharmaceutical & biotechnology companies market estimates and forecasts, 2018 to 2030 (USD Million)
- 6.5. Hospitals & Clinics
- 6.5.1. Hospitals & clinics market estimates and forecasts, 2018 to 2030 (USD Million)
- 6.6. Diagnostic Centers
- 6.6.1. Diagnostic centers market estimates and forecasts, 2018 to 2030 (USD Million)
- 6.7. Others
- 6.7.1. Others market estimates and forecasts, 2018 to 2030 (USD Million)
Chapter 7. Peptide Microarrays Market: Regional Estimates & Trend Analysis
- 7.1. Regional Market Share Analysis, 2023 & 2030
- 7.2. Regional Market Dashboard
- 7.3. Market Size & Forecasts Trend Analysis, 2018 to 2030:
- 7.4. North America
- 7.4.1. North America market estimates and forecasts, 2018 to 2030 (USD Million)
- 7.4.2. U.S.
- 7.4.2.1. Key country dynamics
- 7.4.2.2. Competitive scenario
- 7.4.2.3. U.S. market estimates and forecasts, 2018 to 2030 (USD Million)
- 7.4.3. Canada
- 7.4.3.1. Key country dynamics
- 7.4.3.2. Competitive scenario
- 7.4.3.3. Canada market estimates and forecasts, 2018 to 2030 (USD Million)
- 7.4.4. Mexico
- 7.4.4.1. Key country dynamics
- 7.4.4.2. Competitive scenario
- 7.4.4.3. Mexico market estimates and forecasts, 2018 to 2030 (USD Million)
- 7.5. Europe
- 7.5.1. Europe market estimates and forecasts, 2018 to 2030 (USD Million)
- 7.5.2. UK
- 7.5.2.1. Key country dynamics
- 7.5.2.2. Competitive scenario
- 7.5.2.3. UK market estimates and forecasts, 2018 to 2030 (USD Million)
- 7.5.3. Germany
- 7.5.3.1. Key country dynamics
- 7.5.3.2. Competitive scenario
- 7.5.3.3. Germany market estimates and forecasts, 2018 to 2030 (USD Million)
- 7.5.4. France
- 7.5.4.1. Key country dynamics
- 7.5.4.2. Competitive scenario
- 7.5.4.3. France market estimates and forecasts, 2018 to 2030 (USD Million)
- 7.5.5. Italy
- 7.5.5.1. Key country dynamics
- 7.5.5.2. Competitive scenario
- 7.5.5.3. Italy market estimates and forecasts, 2018 to 2030 (USD Million)
- 7.5.6. Spain
- 7.5.6.1. Key country dynamics
- 7.5.6.2. Competitive scenario
- 7.5.6.3. Spain market estimates and forecasts, 2018 to 2030 (USD Million)
- 7.5.7. Denmark
- 7.5.7.1. Key country dynamics
- 7.5.7.2. Competitive scenario
- 7.5.7.3. Denmark market estimates and forecasts, 2018 to 2030 (USD Million)
- 7.5.8. Sweden
- 7.5.8.1. Key country dynamics
- 7.5.8.2. Competitive scenario
- 7.5.8.3. Sweden market estimates and forecasts, 2018 to 2030 (USD Million)
- 7.5.9. Norway
- 7.5.9.1. Key country dynamics
- 7.5.9.2. Competitive scenario
- 7.5.9.3. Norway market estimates and forecasts, 2018 to 2030 (USD Million)
- 7.6. Asia Pacific
- 7.6.1. Asia Pacific market estimates and forecasts, 2018 to 2030 (USD Million)
- 7.6.2. Japan
- 7.6.2.1. Key country dynamics
- 7.6.2.2. Competitive scenario
- 7.6.2.3. Japan market estimates and forecasts, 2018 to 2030 (USD Million)
- 7.6.3. China
- 7.6.3.1. Key country dynamics
- 7.6.3.2. Competitive scenario
- 7.6.3.3. China market estimates and forecasts, 2018 to 2030 (USD Million)
- 7.6.4. India
- 7.6.4.1. Key country dynamics
- 7.6.4.2. Competitive scenario
- 7.6.4.3. India market estimates and forecasts, 2018 to 2030 (USD Million)
- 7.6.5. South Korea
- 7.6.5.1. Key country dynamics
- 7.6.5.2. Competitive scenario
- 7.6.5.3. South Korea market estimates and forecasts, 2018 to 2030 (USD Million)
- 7.6.6. Australia
- 7.6.6.1. Key country dynamics
- 7.6.6.2. Competitive scenario
- 7.6.6.3. Australia market estimates and forecasts, 2018 to 2030 (USD Million)
- 7.6.7. Thailand
- 7.6.7.1. Key country dynamics
- 7.6.7.2. Competitive scenario
- 7.6.7.3. Thailand market estimates and forecasts, 2018 to 2030 (USD Million)
- 7.7. Latin America
- 7.7.1. Latin America market estimates and forecasts, 2018 to 2030 (USD Million)
- 7.7.2. Brazil
- 7.7.2.1. Key country dynamics
- 7.7.2.2. Competitive scenario
- 7.7.2.3. Brazil market estimates and forecasts, 2018 to 2030 (USD Million)
- 7.7.3. Argentina
- 7.7.3.1. Key country dynamics
- 7.7.3.2. Competitive scenario
- 7.7.3.3. Argentina market estimates and forecasts, 2018 to 2030 (USD Million)
- 7.8. MEA
- 7.8.1. MEA market estimates and forecasts, 2018 to 2030 (USD Million)
- 7.8.2. South Africa
- 7.8.2.1. Key country dynamics
- 7.8.2.2. Competitive scenario
- 7.8.2.3. South Africa market estimates and forecasts, 2018 to 2030 (USD Million)
- 7.8.3. Saudi Arabia
- 7.8.3.1. Key country dynamics
- 7.8.3.2. Competitive scenario
- 7.8.3.3. Saudi Arabia market estimates and forecasts, 2018 to 2030 (USD Million)
- 7.8.4. UAE
- 7.8.4.1. Key country dynamics
- 7.8.4.2. Competitive scenario
- 7.8.4.3. UAE market estimates and forecasts, 2018 to 2030 (USD Million)
- 7.8.5. Kuwait
- 7.8.5.1. Key country dynamics
- 7.8.5.2. Competitive scenario
- 7.8.5.3. Kuwait market estimates and forecasts, 2018 to 2030 (USD Million)
Chapter 8. Competitive Landscape
- 8.1. Company/Competition Categorization
- 8.2. Strategy Mapping
- 8.3. Company Market Position Analysis, 2023
- 8.4. Company Profiles/Listing
- 8.4.1. PEPperPRINT GmbH
- 8.4.1.1. Company overview
- 8.4.1.2. Financial performance
- 8.4.1.3. Product benchmarking
- 8.4.1.4. Strategic initiatives
- 8.4.2. RayBiotech, Inc.
- 8.4.2.1. Company overview
- 8.4.2.2. Financial performance
- 8.4.2.3. Product benchmarking
- 8.4.2.4. Strategic initiatives
- 8.4.3. Creative Biolabs.
- 8.4.3.1. Company overview
- 8.4.3.2. Financial performance
- 8.4.3.3. Product benchmarking
- 8.4.3.4. Strategic initiatives
- 8.4.4. Aurora Biomed Inc.
- 8.4.4.1. Company overview
- 8.4.4.2. Financial performance
- 8.4.4.3. Product benchmarking
- 8.4.4.4. Strategic initiatives
- 8.4.5. Kinexus Bioinformatics Corporation
- 8.4.5.1. Company overview
- 8.4.5.2. Financial performance
- 8.4.5.3. Product benchmarking
- 8.4.5.4. Strategic initiatives
- 8.4.6. Bio-Synthesis Inc.
- 8.4.6.1. Company overview
- 8.4.6.2. Financial performance
- 8.4.6.3. Product benchmarking
- 8.4.6.4. Strategic initiatives
- 8.4.7. Microarrays Inc.
- 8.4.7.1. Company overview
- 8.4.7.2. Financial performance
- 8.4.7.3. Product benchmarking
- 8.4.7.4. Strategic initiatives
- 8.4.8. Arryait Corporation (ARYC).
- 8.4.8.1. Company overview
- 8.4.8.2. Financial performance
- 8.4.8.3. Product benchmarking
- 8.4.8.4. Strategic initiatives
- 8.4.9. JPT Peptide Technologies
- 8.4.9.1. Company overview
- 8.4.9.2. Financial performance
- 8.4.9.3. Product benchmarking
- 8.4.10. Merck KGaA
- 8.4.10.1. Company overview
- 8.4.10.2. Financial performance
- 8.4.10.3. Product benchmarking
- 8.4.10.4. Strategic initiatives
- 8.4.11. Innopsys
- 8.4.11.1. Company overview
- 8.4.11.2. Financial performance
- 8.4.11.3. Product benchmarking
- 8.4.11.4. Strategic initiatives
- 8.4.12. Nimble Therapeutics, Inc.
- 8.4.12.1. Company overview
- 8.4.12.2. Financial performance
- 8.4.12.3. Product benchmarking
- 8.4.12.4. Strategic initiatives
- 8.4.1. PEPperPRINT GmbH
