|
|
市場調査レポート
商品コード
1529724
米国のフラックタンク市場規模、シェア、動向分析レポート:タイプ別、用途別、地域別、セグメント別予測、2024年~2030年U.S. Frac Tanks Market Size, Share & Trends Analysis Report By Type (Open Top, Closed Top), By Application (Oil & Gas, Construction), By Region, And Segment Forecasts, 2024 - 2030 |
||||||
|
|||||||
カスタマイズ可能
|
|||||||

| 米国のフラックタンク市場規模、シェア、動向分析レポート:タイプ別、用途別、地域別、セグメント別予測、2024年~2030年 |
|
出版日: 2024年07月10日
発行: Grand View Research
ページ情報: 英文 152 Pages
納期: 2~10営業日
|

全表示
- 概要
- 図表
- 目次
米国のフラックタンク市場の成長と動向
Grand View Research, Inc.の最新レポートによると、米国のフラックタンク市場規模は2024年から2030年にかけてCAGR 5.2%を記録し、2030年には1億2,730万米ドルに達すると予測されています。
主な促進要因は、堅調な石油・ガスセクターの活動、特にシェールオイル・ガスの継続的な探査と生産です。水圧破砕(フラッキング)はこれらの資源を抽出するのに不可欠であり、大量の水、化学薬品、プロパントを必要とします。フラックタンクは、これらの材料を貯蔵・運搬し、効率的で中断のない水圧破砕作業を保証するために不可欠です。特にパーミアン盆地やバッケン層のようなシェール層の多い地域では、掘削と破砕活動が盛んに行われているため、フラックタンクの需要が高まっています。
米国は過去15年間で天然ガス生産量を日量約300億立方フィートと大幅に増加させています。1/4インチの波形の壁が特徴のフラックタンクは、砂、水、化学添加剤などの材料を効率的に貯蔵するために水圧破砕業界では不可欠です。フラッキングプロセスにおいて、これらの材料は非常に重要であり、タンクの設計により、これらの材料を安全かつ効果的に封じ込めることができます。
建設活動では、特に脱水作業や燃料やその他の液体の貯蔵にさまざまな機器が不可欠です。水を便利に貯蔵できるため、作業員は、コンクリートの混合、現場の清掃、掘削場所での粉塵の抑制などの作業で、すぐに利用可能な供給源を確保することができます。これらの用途に加え、フラックタンクは天然ガスのインフラ建設に関わるパイプラインの静水圧試験にも頻繁に使用されています。
フラックタンクは精製所内の廃棄物管理でも重要な役割を果たしています。廃棄物や製品別が適切に処理、処理、廃棄されるまで分別保管され、製油所操業による環境への影響を最小限に抑えます。保管だけでなく、フラックタンクは分離などの他のプロセスにも使用することができ、水と油を処理したり、さらなる処理の準備をしたりする際に、一時的に別々に保管することができます。
フラックタンクの設計と材料における革新が、市場の成長を大きく後押ししています。メーカー各社は、業界の進化するニーズに対応するため、より耐久性が高く、効率的で、費用対効果の高いフラックタンクを継続的に開発しています。最新の破砕槽は、高度な漏出防止技術、機動性の向上、モジュール設計を特徴としていることが多く、さまざまな破砕シナリオでの実用性を高めています。これらの進歩は作業効率を向上させるだけでなく、環境リスクも低減させるため、事業者にとってより魅力的なものとなっています。
フラックタンクメーカーは、市場浸透を強化し、住宅、商業、工業用途を含むさまざまな最終用途からの技術的需要の変化に対応するために、買収、合併、合弁事業、新製品の発売、地理的拡大など、いくつかの戦略を採用しています。
例えば、2023年9月、ドラゴン・プロダクツはテキサス州サンアンジェロに19エーカーの生産タンク製造工場を新たに取得しました。新たに取得した施設では、引き続きAPI認証の生産タンクを製造する予定です。この買収は、パーミアン・ベースンにおけるドラゴンの地上生産設備に対する顧客需要の増加が背景にあります。
米国フラックタンク市場レポートハイライト:
- 2023年の世界売上高では、クローズドトップタイプが最大シェアを占めました。これらのフラックタンクは、安全で信頼性の高い現場での液体貯蔵が必要とされるフラッキングにおける一時的な液体貯蔵に使用されます。これらのタンクは8,400ガロンから21,000ガロンの範囲です。
- 環境修復用途セグメントは、予測期間中に有利な成長を示すと予想されます。フラックタンクは、ポンプ、フィルター、治療システムなどの浄化装置を使用して浄化を促進します。移動式浄化装置の不可欠な構成要素であり、処理済みまたは未処理の液体を、規制基準に従って安全に敷地外に輸送または排出できるようになるまで、一時的に保管します。
- 2023年の世界売上高では、南西地域セグメントが最大のシェアを占めています。エネルギー情報局(EIA)の報告によると、パーミアン地域の天然ガス総取出量は2022年に年間最高を記録し、2021年平均から14%増の210億立方フィート/日(Bcf/d)となった。パーミアン・ベースンにおける天然ガス生産のほとんどは油井に関連しているため、この生産量の伸びは原油価格の変動に対するこの地域の対応に起因しています。
- 2023年10月、貯蔵ソリューションの市場プレーヤーであるCSTインダストリーズは、アクアストア・カナダ・イーストを正規ディーラーとする戦略的提携を発表しました。この提携により、CSTインダストリーズのプレゼンスが拡大し、カナダ東部への高品質ストレージ・ソリューションの提供が容易になると期待されています。
目次
第1章 調査手法と範囲
第2章 エグゼクティブサマリー
第3章 米国のフラックタンク市場:変数、動向、範囲
- 集中と成長の見通しのマッピング
- 業界バリューチェーン分析
- 規制の枠組み
- 市場力学
- 競争価格分析
- 経済のメガ動向
- 業界分析ツール
第4章 米国のフラックタンク市場:タイプ別推定・動向分析
- 米国のフラックタンク市場:タイプ別展望
- 米国のフラックタンク市場:タイプ別変動分析と市場シェア、2023年と2030年
- 市場推計・予測:タイプ別、2018年-2030年
第5章 米国のフラックタンク市場:用途別推定・動向分析
- 米国のフラックタンク市場:用途別展望
- 米国のフラックタンク市場:用途別変動分析と市場シェア、2023年と2030年
- 市場推計・予測:用途別、2018年-2030年
第6章 米国のフラックタンク市場:地域別推定・動向分析
- 北東部
- 南東部
- 中西部
- 南西部
- 西部
第7章 米国のフラックタンク市場:競合情勢
- 主要市場参入企業による最近の動向と影響分析
- ベンダー情勢
- 企業/競合の分類
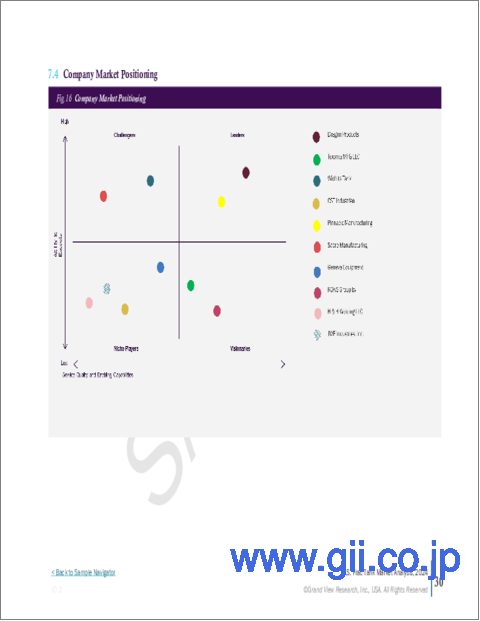
- 企業の市場ポジショニング
- 参入企業の概要
- 財務実績
- 製品ベンチマーク
- 企業市場シェア分析、2023年
- 企業ダッシュボード分析
- 企業ヒートマップ分析
- 戦略マッピング
第8章 米国のフラックタンク市場:企業プロファイリング
- Dragon Products
- Texoma MFG LLC
- Wichita Tank
- Pinnacle Manufacturing
- Sabre Manufacturing
- Geneva Equipment
- KOKS Group bv
- H & H Welding LLC
- JWF Industries, Inc
- CST Industries
List of Tables
- Table 1 U.S. Frac Tank Market Estimates and Forecasts, By Type, 2018 - 2030 (USD Million)
- Table 2 U.S. Frac Tank Market Estimates and Forecasts, By Application, 2018 - 2030 (USD Million)
- Table 3 Recent Developments & Impact Analysis, By Key Market Participants
- Table 4 Company Heat Map Analysis, 2023
List of Figures
- Fig. 1 Market Segmentation & Scope
- Fig. 2 Information Procurement
- Fig. 3 Data Analysis Models
- Fig. 4 Market Formulation And Validation
- Fig. 5 Data Validating & Publishing
- Fig. 6 Market Snapshot
- Fig. 7 Type & Application Segment Snapshot
- Fig. 8 Competitive Landscape Snapshot
- Fig. 9 Concentration & Growth Prospect Mapping
- Fig. 10 Industry Value Chain Analysis
- Fig. 11 Twelve Month Average Raw Material Cost USD Per Pound, 2022 - 2023
- Fig. 12 U.S. Frac Tank: Market Dynamics
- Fig. 13 Total Crude Oil Production, 2018 - 2024 (Million Barrels Per Day)
- Fig. 14 Total Natural Gas Production, 2018 - 2024 (Billion Cubic Feet Per Day)
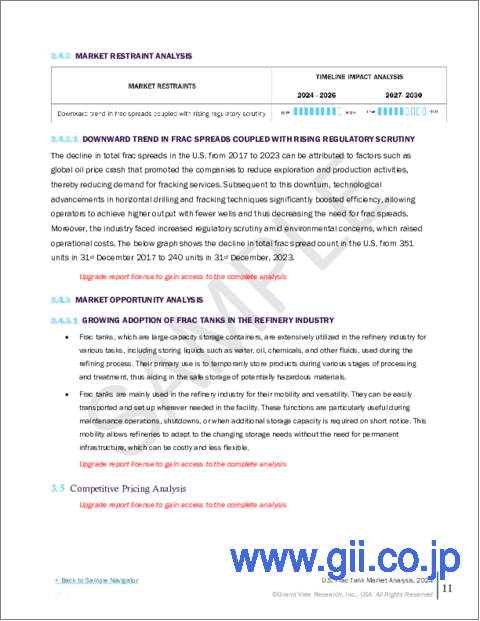
- Fig. 16 Total Frac Spread Count In The U.S., 31st December 2017 - 31st December 2023 (Units)
- Fig. 17 Total Number Of Operating and Idle Refineries as of January 01 from 2021 - 2024 (Units)
- Fig. 18 Change in Real GDP in the U.S., Q2 2020 - Q1 2024 (%)
- Fig. 19 U.S. Frac Tank Market: PORTER's Analysis
- Fig. 20 U.S. Frac Tank Market: PESTEL Analysis
- Fig. 21 U.S. Frac Tank Market, By Type: Key Takeaways
- Fig. 22 U.S. Frac Tank Market: Type Movement Analysis & Market Share, 2023 & 2030
- Fig. 23 U.S. Frac Tank Market Estimates & Forecasts, By Open Top, 2018 - 2030 (USD Million)
- Fig. 24 U.S. Frac Tank Market Estimates & Forecasts, By Closed Top, 2018 - 2030 (USD Million)
- Fig. 25 U.S. Frac Tank Market Estimates & Forecasts, By Mix Tank, 2018 - 2030 (USD Million)
- Fig. 26 U.S. Frac Tank Market Estimates & Forecasts, By Double Wall, 2018 - 2030 (USD Million)
- Fig. 27 U.S. Frac Tank Market Estimates & Forecasts, By Gas Buster, 2018 - 2030 (USD Million)
- Fig. 28 U.S. Frac Tank Market, By Application: Key Takeaways
- Fig. 29 U.S. Frac Tank Market: Application Movement Analysis & Market Share, 2023 & 2030
- Fig. 30 U.S. Frac Tank Market Estimates & Forecasts, In Oil & Gas, 2018 - 2030 (USD Million)
- Fig. 31 U.S. Frac Tank Market Estimates & Forecasts, In Construction, 2018 - 2030 (USD Million)
- Fig. 32 U.S. Frac Tank Market Estimates & Forecasts, In Environmental Remediation, 2018 - 2030 (USD Million)
- Fig. 33 U.S. Frac Tank Market Estimates & Forecasts, In Shipyards and Airports, 2018 - 2030 (USD Million)
- Fig. 34 U.S. Frac Tank Market Estimates & Forecasts, In Refinery, 2018 - 2030 (USD Million)
- Fig. 35 U.S. Frac Tank Market Estimates & Forecasts, In Other Applications, 2018 - 2030 (USD Million)
- Fig. 36 Northeast Frac Tank Market Estimates & Forecasts, 2018 - 2030 (USD Million)
- Fig. 37 Southeast Frac Tank Market Estimates & Forecasts, 2018 - 2030 (USD Million)
- Fig. 38 Midwest Frac Tank Market Estimates & Forecasts, 2018 - 2030 (USD Million)
- Fig. 39 Southwest Frac Tank Market Estimates & Forecasts, 2018 - 2030 (USD Million)
- Fig. 40 West Frac Tank Market Estimates & Forecasts, 2018 - 2030 (USD Million)
- Fig. 41 Company/Competition Categorization
- Fig. 42 Company Market Positioning
- Fig. 43 Company Market Share Analysis, 2023
- Fig. 44 Company Dashboard Analysis
- Fig. 45 Strategic Framework
U.S. Frac Tank Market Growth & Trends:
The U.S. frac tank market size is anticipated to reach USD 127.3 million by 2030, registering a CAGR of 5.2% from 2024 to 2030, according to a new report by Grand View Research, Inc. The primary driver is the robust oil and gas sector activity, particularly the continued exploration and production of shale oil and gas. Hydraulic fracturing, or fracking, is critical in extracting these resources, requiring substantial volumes of water, chemicals, and proppants. Frac tanks are indispensable in storing and transporting these materials, ensuring efficient and uninterrupted fracking operations. The high level of drilling and fracking activities, especially in prolific shale regions like the Permian Basin and the Bakken Formation, fuels the demand for frac tanks.
The U.S. has significantly boosted its natural gas production by approximately 30 billion cubic feet per day over the past 15 years. Frac tanks, characterized by their quarter-inch corrugated walls, are essential in the hydraulic fracturing industry for the efficient storage of materials such as sand, water, and chemical additives. These components are crucial for the fracking process, and the design of these tanks ensures the safe and effective containment of these materials.
A variety of equipment is essential for construction activities, notably for dewatering tasks and storing fuel and other liquids. The ability to store water conveniently enables workers to have a readily available supply for activities such as mixing concrete, cleaning the site, and controlling dust at drilling locations. In addition to these applications, frac tanks are frequently employed in the hydrostatic testing of pipelines involved in constructing natural gas infrastructure.
Frac tanks also play a crucial role in waste management within refineries. They are used to segregate and store waste products and by-products until they can be processed, treated, or disposed of properly, minimizing the environmental impact of refinery operations. In addition to storage, frac tanks can be employed in other processes, such as separation, where water and oil can be temporarily stored separately as they are treated or prepared for further processing.
Innovations in frac tank design and materials significantly drive market growth. Manufacturers are continually developing more durable, efficient, and cost-effective frac tanks to meet the industry's evolving needs. Modern frac tanks often feature advanced leak prevention technologies, improved mobility, and modular designs, which enhance their utility in various fracking scenarios. These advancements not only improve operational efficiency but also reduce environmental risks, making them more attractive to operators.
Frac tank manufacturers are adopting several strategies, such as acquisitions, mergers, joint ventures, new product launches, and geographical expansion, to enhance market penetration and cater to changing technological demands from various end-use applications, including residential, commercial, and industrial applications.
For instance, in September 2023, Dragon Products acquired a new 19-acre production tank manufacturing plant in San Angelo, Texas. The newly acquired facility is expected to continue to build API-certified production tanks. The acquisition was driven by increased customer demand for surface production equipment of Dragon in the Permian Basin.
U.S. Frac Tanks Market Report Highlights:
- The closed top type segment held the largest share of the global revenue in 2023. These frac tanks are used for temporary liquid storage in fracking, where safe and reliable on-site liquid storage is required. These tanks range from 8,400 gallons to 21,000 gallons.
- The environmental remediation application segment is expected to show lucrative growth over the forecast period. Frac tanks use remediation equipment, such as pumps, filters, and treatment systems, to facilitate cleanup. They are integral components of mobile remediation units, providing temporary storage for treated or untreated liquids until they can be safely transported off-site or discharged in compliance with regulatory standards.
- The Southwest region segment held the largest share of the global revenue in 2023. The Energy Information Administration (EIA) reports that gross natural gas withdrawals in the Permian region recorded a new annual high in 2022 at 21.0 billion cubic feet per day (Bcf/d), a 14% increase from the 2021 average. This production growth can be attributed to the region's response to fluctuations in crude oil prices, as most natural gas production in the Permian Basin is associated with oil wells.
- In October 2023, CST Industries, a market player in storage solutions, announced a strategic partnership with Aquastore Canada East as its authorized dealer. This alliance is expected to expand CST Industries' presence and facilitate the delivery of its high-quality storage solutions to Eastern Canada.
Table of Contents
Chapter 1 Methodology and Scope
- 1.1 Market Segmentation & Scope
- 1.2 Market Definition
- 1.3 Research Methodology
- 1.4 Information Procurement
- 1.4.1 Purchased Database
- 1.4.2 GVR's Internal Database
- 1.4.3 Secondary Sources
- 1.4.4 Third Party Perspective
- 1.4.5 Information analysis
- 1.5 Information Analysis
- 1.5.1 Data Analysis Models
- 1.5.2 Market formulation & data visualization
- 1.5.3 Data validation & publishing
- 1.6 Research Scope and Assumptions
- 1.6.1 List to data sources
Chapter 2 Executive Summary
- 2.1 Market Snapshot
- 2.2 Type & Application Segment Snapshot
- 2.3 Competitive Landscape Snapshot
Chapter 3 U.S. Frac Tank Market: Variables, Trends & Scope
- 3.1 Concentration and Growth Prospect Mapping
- 3.2 Industry Value Chain Analysis
- 3.2.1 Raw material and component outlook
- 3.2.2 Manufacturer outlook
- 3.2.3 Distribution outlook
- 3.2.4 End-Users outlook
- 3.3 Regulatory Framework
- 3.3.1 Impact of regulations on the U.S. frac tank market
- 3.4 Market Dynamics
- 3.4.1 Market Driver Analysis
- 3.4.2 Market Restraint Analysis
- 3.4.3 Market Opportunity Analysis
- 3.5 Competitive Pricing Analysis
- 3.6 Economic Mega Trends
- 3.6.1 Impact of The COVID-19 on the market
- 3.6.2 Russia-Ukraine war impact on U.S. frac tank market
- 3.7 Industry Analysis Tools
- 3.7.1 Porter's analysis
- 3.7.2 Macroeconomic analysis
Chapter 4 U.S. Frac Tank Market: Type Estimates & Trend Analysis
- 4.1 U.S. Frac Tank Market: Type Outlook
- 4.2 U.S. Frac Tank Market: Type Movement Analysis & Market Share, 2023 & 2030
- 4.3 U.S. Frac Tank Market Estimates & Forecasts, By Type, 2018 - 2030 (USD Billion)
- 4.3.1 Open Top Market estimates and forecasts, 2018 - 2030 (USD Million)
- 4.3.2 Closed Top Market estimates and forecasts, 2018 - 2030 (USD Million)
- 4.3.3 Mix Tank Market estimates and forecasts, 2018 - 2030 (USD Million)
- 4.3.4 Double Wall Market estimates and forecasts, 2018 - 2030 (USD Million)
- 4.3.5 Gas Buster Market estimates and forecasts, 2018 - 2030 (USD Million)
Chapter 5 U.S. Frac Tank Market: Application Estimates & Trend Analysis
- 5.1 U.S. Frac Tank Market: Application Outlook
- 5.2 U.S. Frac Tank Market: Application Movement Analysis & Market Share, 2023 & 2030
- 5.3 U.S. Frac Tank Market Estimates & Forecasts, By Application, 2018 - 2030 (USD Million)
- 5.3.1 Oil & gas Market estimates and forecasts, 2018 - 2030 (USD Million)
- 5.3.2 Construction Market estimates and forecasts, 2018 - 2030 (USD Million)
- 5.3.3 Environmental remediation Market estimates and forecasts, 2018 - 2030 (USD Million)
- 5.3.4 Shipyards and Airports Market estimates and forecasts, 2018 - 2030 (USD Million)
- 5.3.5 Refinery Market estimates and forecasts, 2018 - 2030 (USD Million)
- 5.3.6 Other applications Market estimates and forecasts, 2018 - 2030 (USD Million)
Chapter 6 U.S. Frac Tank Market: Region Estimates & Trend Analysis
- 6.1 Northeast
- 6.1.1 Northeast Frac Tank Market Estimates & Forecasts, 2018 - 2030 (USD Million)
- 6.2 Southeast
- 6.2.1 Southeast Frac Tank Market Estimates & Forecasts, 2018 - 2030 (USD Million)
- 6.3 Midwest
- 6.3.1 Midwest Frac Tank Market Estimates & Forecasts, 2018 - 2030 (USD Million)
- 6.4 Southwest
- 6.4.1 Southwest Frac Tank Market Estimates & Forecasts, 2018 - 2030 (USD Million)
- 6.5 West
- 6.5.1 West Frac Tank Market Estimates & Forecasts, 2018 - 2030 (USD Million)
Chapter 7 U.S. Frac Tank Market: Competitive Landscape
- 7.1 Recent Developments & Impact Analysis, By Key Market Participants
- 7.2 Vendor Landscape
- 7.2.1 List Of Consumers
- 7.3 Company/Competition Categorization
- 7.4 Company Market Positioning
- 7.5 Participant's Overview
- 7.6 Financial Performance
- 7.7 Product Benchmarking
- 7.8 Company Market Share Analysis, 2023
- 7.9 Company Dashboard Analysis
- 7.10 Company Heat Map Analysis
- 7.11 Strategy Mapping
- 7.11.1 Mergers & Acquisitions
- 7.11.2 Partnerships/Collaborations/Agreements
- 7.11.3 Expansions
- 7.11.4 New Product Launches
Chapter 8 U.S. Frac Tank Market: Company Profiling
- 8.1 Dragon Products
- 8.1.1 Participants Overview
- 8.1.2 Financial Overview
- 8.1.3 Service Benchmarking
- 8.1.4 Recent Developments
- 8.2 Texoma MFG LLC
- 8.2.1 Participants Overview
- 8.2.2 Financial Overview
- 8.2.3 Service Benchmarking
- 8.2.4 Recent Developments
- 8.3 Wichita Tank
- 8.3.1 Participants Overview
- 8.3.2 Financial Overview
- 8.3.3 Service Benchmarking
- 8.3.4 Recent Developments
- 8.4 Pinnacle Manufacturing
- 8.4.1 Participants Overview
- 8.4.2 Financial Overview
- 8.4.3 Service Benchmarking
- 8.4.4 Recent Developments
- 8.5 Sabre Manufacturing
- 8.5.1 Participants Overview
- 8.5.2 Financial Overview
- 8.5.3 Service Benchmarking
- 8.5.4 Recent Developments
- 8.6 Geneva Equipment
- 8.6.1 Participants Overview
- 8.6.2 Financial Overview
- 8.6.3 Service Benchmarking
- 8.6.4 Recent Developments
- 8.7 KOKS Group bv
- 8.7.1 Participants Overview
- 8.7.2 Financial Overview
- 8.7.3 Service Benchmarking
- 8.7.4 Recent Developments
- 8.8 H & H Welding LLC
- 8.8.1 Participants Overview
- 8.8.2 Financial Overview
- 8.8.3 Service Benchmarking
- 8.8.4 Recent Developments
- 8.9 JWF Industries, Inc
- 8.9.1 Participants Overview
- 8.9.2 Financial Overview
- 8.9.3 Service Benchmarking
- 8.9.4 Recent Developments
- 8.10 CST Industries
- 8.10.1 Participants Overview
- 8.10.2 Financial Overview
- 8.10.3 Service Benchmarking
- 8.10.4 Recent Developments

