|
|
市場調査レポート
商品コード
1529611
T細胞リンパ腫(TCL)の市場規模、シェア、動向分析:タイプ別、療法別、地域別、セグメント別予測、2024年~2030年T-cell Lymphoma Market Size, Share & Trends Analysis Report By Type (Peripheral, Lymphoblastic), By Therapy (Radiotherapy, Immunotherapy, Stem Cell Transplantation), By Region, And Segment Forecasts, 2024 - 2030 |
||||||
|
|||||||
カスタマイズ可能
|
|||||||

| T細胞リンパ腫(TCL)の市場規模、シェア、動向分析:タイプ別、療法別、地域別、セグメント別予測、2024年~2030年 |
|
出版日: 2024年07月01日
発行: Grand View Research
ページ情報: 英文 180 Pages
納期: 2~10営業日
|

全表示
- 概要
- 図表
- 目次
T細胞リンパ腫(TCL)市場の成長と動向:
Grand View Research, Inc.の最新レポートによると、世界のT細胞リンパ腫(TCL)の市場規模は、2024年から2030年にかけてCAGR 8.83%で拡大し、2030年には37億米ドルに達すると予測されています。
TCL市場は、治療選択肢の進歩や製薬企業の戦略的イニシアティブによって大きく拡大しています。14の新規パイプライン薬剤の導入と新たな適応症に対する治療法の拡大は、この成長を後押しする主要因です。これらの開発は、TCL治療の要であった従来の化学療法にとどまらず、患者により多くの治療選択肢を提供することを目的としています。
2023年に米国で報告された末梢性T細胞リンパ腫(PTCL)の新規症例数は約12,600例で、この数は疾患罹患率の増加を反映して2030年までに増加すると予想されています。さらに、米国、フランス、ドイツ、イタリア、スペイン、英国、日本などの市場における非ホジキンリンパ腫(NHL)に対するCAR-T療法は、2023年に合計約155,300症例となった。CAR-T療法のパイプラインは多様で、様々な開発段階を対象としており、主にB細胞性リンパ腫に焦点を当てているが、PTCL治療にも新たな関心が寄せられています。
現在、新たにPTCLと診断された患者には、CHOPやCHOEPなどのレジメンによるアントラサイクリンベースの化学療法が標準的な第一選択治療となっています。しかし、ALCLに対するCHP-BVのような新しいアプローチは、より標的を絞った治療へのシフトを示し、治療効果を高めています。さらに日本では、ATLLやR/R型PTCLに対するHIYASTA、DARVIAS、REMITOROのような薬剤の導入により大きな進歩が見られ、治療の選択肢を広げ、市場成長を牽引しています。これらの技術革新は、特に治療法の選択肢が限られている患者にとって、より良い転帰への希望をもたらしています。
CAR-T細胞療法やNK細胞療法の分野も進展しており、前臨床段階から大規模な臨床研究へと移行しています。これらの革新的アプローチは、個別化されたTCL治療の有望な展望を提供するものです。さらに、PD-1/PD-L1阻害剤、NK細胞エンゲイジャー、抗CD47抗体、CCR4を標的とするモガムリズマブのような薬剤など、特定のTCL関連タンパク質やシグナルを標的とする生物学的製剤も開発中です。これらの進歩は、より正確な治療プラットフォームを構築し、患者の予後を改善する可能性を目指しています。
将来的には、製薬企業による戦略的イニシアチブが、特に日本と米国において、2030年までに市場を大きく変化させることが予想されます。これらのイニシアチブには、既存薬の新市場への導入、新規治療アプローチの模索、TCLサブタイプに合わせた研究不十分な標的への注力などが含まれます。
しかし、市場は、標準的治療薬の特許切れのような課題に直面しており、売上に影響を及ぼす可能性のあるジェネリック医薬品競争にさらされています。しかし、新規薬剤の市場参入はこうした課題を緩和し、成長の勢いを維持すると予想されます。
Takeda Pharmaceuticals, Bristol-Myers Squibb, Novartisといった主要企業は、Citius Pharmaceuticals、Innate Pharma、Soligenixといった新興企業とともに、市場ダイナミクスを牽引する極めて重要な存在です。ADCETRISやPOTELIGEOのような革新的治療は、TCL治療のニーズを満たす上で極めて重要です。ノバルティスのCAR-T治療へのコミットメントは、継続的なイノベーションを強調するものであり、一方、I/ONTAK(E7777)、SGX301、Lacutamabのような新たな治療は、TCL管理戦略をさらに充実させる態勢を整えています。これらの企業は、戦略的な取り組みや先駆的な治療を通じて、将来のTCLの展望を形成する上で極めて重要な存在です。
T細胞リンパ腫(TCL)市場レポートハイライト
- タイプ別では、末梢性T細胞リンパ腫(PTCL)セグメントが2023年に66.47%の最大売上シェアを占めました。
- 療法別では、化学療法が2023年に26.69%の最大売上シェアを占めました。長年にわたり、化学療法はTCL治療の要であり、CHOP(シクロホスファミド、ドキソルビシン、ビンクリスチン、プレドニゾン)やCHOEP(シクロホスファミド、ドキソルビシン、ビンクリスチン、エトポシド、プレドニゾン)などのレジメンが一般的に使用されています。これらの治療レジメンは、疾患管理における有効性が広く認められており、通常、新たに診断された患者に対する治療の第一選択となっています。
- 免疫療法セグメントは、予測期間中に7.21%の急成長が見込まれています。この急成長の原動力となっているのは、がん細胞をより正確に狙い撃ちするために身体の免疫系を活用する新規治療法の大幅な進歩と導入です。
- 北米は2023年に37.67%のシェアを占める最大市場であり、高度な医療インフラ、高医療費、進行中の重要な研究開発がその原動力となっています。
目次
第1章 調査手法と範囲
第2章 市場の変数、動向、範囲
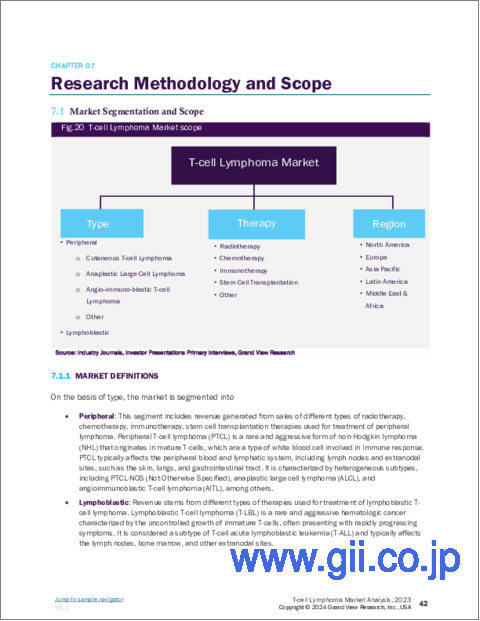
- 市場セグメンテーションと範囲
- 市場系統の見通し
- 親市場の見通し
- 関連/補助市場見通し
- 市場動向と展望
- 市場力学
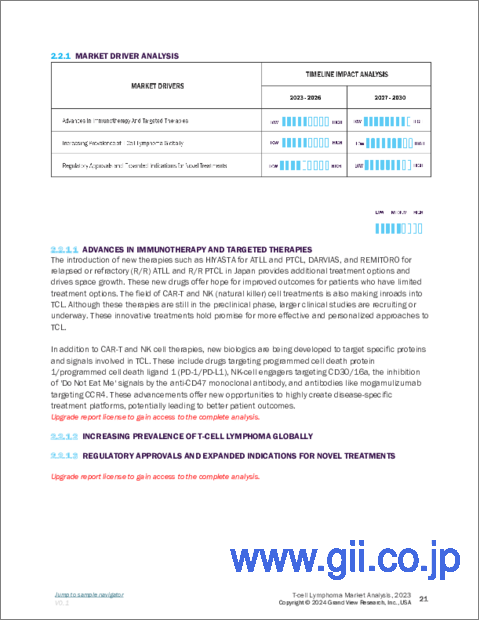
- 免疫療法と標的療法の進歩
- 世界中でT細胞リンパ腫(TCL)の罹患率が増加
- 新規治療法の規制当局による承認と適応拡大
- 市場抑制要因分析
- 革新的な治療法の高コスト
- 発展途上地域での認識と診断の限界
- ビジネス環境分析
- SWOT分析;要因別(政治・法律、経済・技術)
- ポーターのファイブフォース分析
- COVID-19の影響分析
第3章 T細胞リンパ腫(TCL)市場:タイプのビジネス分析
- タイプの市場シェア、2023年・2030年
- セグメントダッシュボード
- T細胞リンパ腫(TCL)市場:タイプ別の展望
- 2018年から2030年までの市場規模と予測・動向分析
- 末梢性
- リンパ芽球性
第4章 T細胞リンパ腫(TCL)市場:療法のビジネス分析
- 療法の市場シェア、2023年・2030年
- セグメントダッシュボード
- T細胞リンパ腫(TCL)市場:療法別の展望
- 2018年から2030年までの市場規模と予測・動向分析
- 放射線療法
- 化学療法
- 免疫療法
- 幹細胞移植
- その他
第5章 T細胞リンパ腫(TCL)市場:地域のビジネス分析
- T細胞リンパ腫(TCL)の市場シェア、地域別、2023年・2030年
- 北米
- 欧州
- アジア太平洋
- ラテンアメリカ
- 中東・アフリカ
第6章 競合情勢
- 参入企業の概要
- 財務実績
- 参入企業
- マーケットリーダー
- T細胞リンパ腫(TCL)市場シェア分析、2023年
- 企業プロファイル
- 戦略マッピング
List of Tables
- Table 1 List of Secondary Sources
- Table 2 List of Abbreviations
- Table 3 Global T-cell Lymphoma Market, by Region, 2018 - 2030 (USD Million)
- Table 4 Global T-cell Lymphoma Market, Type, 2018 - 2030 (USD Million)
- Table 5 Global T-cell Lymphoma Market, by Therapy, 2018 - 2030 (USD Million)
- Table 6 North America T-cell Lymphoma Market, by Country, 2018 - 2030 (USD Million)
- Table 7 North America T-cell Lymphoma Market, Type, 2018 - 2030 (USD Million)
- Table 8 North America T-cell Lymphoma Market, by Therapy, 2018 - 2030 (USD Million)
- Table 9 U.S. T-cell Lymphoma Market, Type, 2018 - 2030 (USD Million)
- Table 10 U.S. T-cell Lymphoma Market, by Therapy, 2018 - 2030 (USD Million)
- Table 11 Canada T-cell Lymphoma Market, Type, 2018 - 2030 (USD Million)
- Table 12 Canada T-cell Lymphoma Market, by Therapy, 2018 - 2030 (USD Million)
- Table 13 Mexico T-cell Lymphoma Market, Type, 2018 - 2030 (USD Million)
- Table 14 Mexico T-cell Lymphoma Market, by Therapy, 2018 - 2030 (USD Million)
- Table 15 Europe T-cell Lymphoma Market, by Country, 2018 - 2030 (USD Million)
- Table 16 Europe T-cell Lymphoma Market, Type, 2018 - 2030 (USD Million)
- Table 17 Europe T-cell Lymphoma Market, by Therapy, 2018 - 2030 (USD Million)
- Table 18 Germany T-cell Lymphoma Market, Type, 2018 - 2030 (USD Million)
- Table 19 Germany T-cell Lymphoma Market, by Therapy, 2018 - 2030 (USD Million)
- Table 20 UK T-cell Lymphoma Market, Type, 2018 - 2030 (USD Million)
- Table 21 UK T-cell Lymphoma Market, by Therapy, 2018 - 2030 (USD Million)
- Table 22 France T-cell Lymphoma Market, Type, 2018 - 2030 (USD Million)
- Table 23 France T-cell Lymphoma Market, by Therapy, 2018 - 2030 (USD Million)
- Table 24 Italy T-cell Lymphoma Market, Type, 2018 - 2030 (USD Million)
- Table 25 Italy T-cell Lymphoma Market, by Therapy, 2018 - 2030 (USD Million)
- Table 26 Denmark T-cell Lymphoma Market, Type, 2018 - 2030 (USD Million)
- Table 27 Denmark T-cell Lymphoma Market, by Therapy, 2018 - 2030 (USD Million)
- Table 28 Sweden T-cell Lymphoma Market, Type, 2018 - 2030 (USD Million)
- Table 29 Sweden T-cell Lymphoma Market, by Therapy, 2018 - 2030 (USD Million)
- Table 30 Norway T-cell Lymphoma Market, Type, 2018 - 2030 (USD Million)
- Table 31 Norway T-cell Lymphoma Market, by Therapy, 2018 - 2030 (USD Million)
- Table 32 Asia Pacific T-cell Lymphoma Market, by Country, 2018 - 2030 (USD Million)
- Table 33 Asia Pacific T-cell Lymphoma Market, Type, 2018 - 2030 (USD Million)
- Table 34 Asia Pacific T-cell Lymphoma Market, by Therapy, 2018 - 2030 (USD Million)
- Table 35 China T-cell Lymphoma Market, Type, 2018 - 2030 (USD Million)
- Table 36 China T-cell Lymphoma Market, by Therapy, 2018 - 2030 (USD Million)
- Table 37 Japan T-cell Lymphoma Market, Type, 2018 - 2030 (USD Million)
- Table 38 Japan T-cell Lymphoma Market, by Therapy, 2018 - 2030 (USD Million)
- Table 39 India T-cell Lymphoma Market, Type, 2018 - 2030 (USD Million)
- Table 40 India T-cell Lymphoma Market, by Therapy, 2018 - 2030 (USD Million)
- Table 41 South Korea T-cell Lymphoma Market, Type, 2018 - 2030 (USD Million)
- Table 42 South Korea T-cell Lymphoma Market, by Therapy, 2018 - 2030 (USD Million)
- Table 43 Australia T-cell Lymphoma Market, Type, 2018 - 2030 (USD Million)
- Table 44 Australia T-cell Lymphoma Market, by Therapy, 2018 - 2030 (USD Million)
- Table 45 Thailand T-cell Lymphoma Market, Type, 2018 - 2030 (USD Million)
- Table 46 Thailand T-cell Lymphoma Market, by Therapy, 2018 - 2030 (USD Million)
- Table 47 Latin America T-cell Lymphoma Market, by Country, 2018 - 2030 (USD Million)
- Table 48 Latin America T-cell Lymphoma Market, Type, 2018 - 2030 (USD Million)
- Table 49 Latin America T-cell Lymphoma Market, by Therapy, 2018 - 2030 (USD Million)
- Table 50 Brazil T-cell Lymphoma Market, Type, 2018 - 2030 (USD Million)
- Table 51 Brazil T-cell Lymphoma Market, by Therapy, 2018 - 2030 (USD Million)
- Table 52 Argentina T-cell Lymphoma Market, Type, 2018 - 2030 (USD Million)
- Table 53 Argentina T-cell Lymphoma Market, by Therapy, 2018 - 2030 (USD Million)
- Table 54 Middle East & Africa T-cell Lymphoma Market, by Country, 2018 - 2030 (USD Million)
- Table 55 Middle East & Africa T-cell Lymphoma Market, Type, 2018 - 2030 (USD Million)
- Table 56 Middle East & Africa T-cell Lymphoma Market, by Therapy, 2018 - 2030 (USD Million)
- Table 57 South Africa T-cell Lymphoma Market, Type, 2018 - 2030 (USD Million)
- Table 58 South Africa T-cell Lymphoma Market, by Therapy, 2018 - 2030 (USD Million)
- Table 59 Saudi Arabia T-cell Lymphoma Market, Type, 2018 - 2030 (USD Million)
- Table 60 Saudi Arabia T-cell Lymphoma Market, by Therapy, 2018 - 2030 (USD Million)
- Table 61 UAE T-cell Lymphoma Market, Type, 2018 - 2030 (USD Million)
- Table 62 UAE T-cell Lymphoma Market, by Therapy, 2018 - 2030 (USD Million)
- Table 63 Kuwait T-cell Lymphoma Market, Type, 2018 - 2030 (USD Million)
- Table 64 Kuwait T-cell Lymphoma Market, by Therapy, 2018 - 2030 (USD Million)
- Table 65 Financial performance
- Table 66 Key companies undergoing expansions
- Table 67 Key companies undergoing acquisitions
- Table 68 Key companies undergoing collaborations
- Table 69 Key companies launching new products/services
- Table 70 Key companies undergoing partnerships
- Table 71 Key companies undertaking other strategies
List of Figures
- Fig. 1 Information Procurement
- Fig. 2 Primary Research Pattern
- Fig. 3 Market Research Approaches
- Fig. 4 Value Chain-Based Sizing & Forecasting
- Fig. 5 Market Formulation & Validation
- Fig. 6 T-cell Lymphoma Market Segmentation
- Fig. 7 Market Snapshot, 2023
- Fig. 8 Market Trends & Outlook
- Fig. 9 Market Driver Relevance Analysis (Current & Future Impact)
- Fig. 10 Market Restraint Relevance Analysis (Current & Future Impact)
- Fig. 11 Market Challenge Relevance Analysis (Current & Future Impact)
- Fig. 12 SWOT Analysis, By Factor (Political & Legal, Economic and Technological)
- Fig. 13 Porter's Five Forces Analysis
- Fig. 14 Global T-cell Lymphoma Market: By Type, Movement Analysis
- Fig. 15 Global T-cell Lymphoma Market, for Peripheral, 2018 - 2030 (USD Million)
- Fig. 16 Global T-cell Lymphoma Market, for Cutaneous T-cell Lymphoma, 2018 - 2030 (USD Million)
- Fig. 17 Global T-cell Lymphoma Market, for Anaplastic Large Cell Lymphoma, 2018 - 2030 (USD Million)
- Fig. 18 Global T-cell Lymphoma Market, for Angio-immuno-blastic T-cell Lymphoma, 2018 - 2030 (USD Million)
- Fig. 19 Global T-cell Lymphoma Market, for Other, 2018 - 2030 (USD Million)
- Fig. 20 Global T-cell Lymphoma Market, for Lymphoblastic, 2018 - 2030 (USD Million)
- Fig. 21 Global T-cell Lymphoma Market: By Therapy, Movement Analysis
- Fig. 22 Global T-cell Lymphoma Market, for Radiotherapy, 2018 - 2030 (USD Million)
- Fig. 23 Global T-cell Lymphoma Market, for Chemotherapy, 2018 - 2030 (USD Million)
- Fig. 24 Global T-cell Lymphoma Market, for Immunotherapy, 2018 - 2030 (USD Million)
- Fig. 25 Global T-cell Lymphoma Market, for Stem Cell Transplantation, 2018 - 2030 (USD Million)
- Fig. 26 Global T-cell Lymphoma Market, for Other, 2018 - 2030 (USD Million)
- Fig. 27 Regional Marketplace: Key Takeaways T-cell Lymphoma Market,
- Fig. 28 Regional Outlook, 2023 & 2030 T-cell Lymphoma Market,
- Fig. 29 Global T-cell Lymphoma Market: Region Movement Analysis
- Fig. 30 North America T-cell Lymphoma Market, 2018 - 2030 (USD Million)
- Fig. 31 U.S. T-cell Lymphoma Market, 2018 - 2030 (USD Million)
- Fig. 32 Canada T-cell Lymphoma Market, 2018 - 2030 (USD Million)
- Fig. 33 Mexico T-cell Lymphoma Market, 2018 - 2030 (USD Million)
- Fig. 34 Europe T-cell Lymphoma Market, 2018 - 2030 (USD Million)
- Fig. 35 Germany T-cell Lymphoma Market, 2018 - 2030 (USD Million)
- Fig. 36 UK T-cell Lymphoma Market, 2018 - 2030 (USD Million)
- Fig. 37 France T-cell Lymphoma Market, 2018 - 2030 (USD Million)
- Fig. 38 Italy T-cell Lymphoma Market, 2018 - 2030 (USD Million)
- Fig. 39 Spain T-cell Lymphoma Market, 2018 - 2030 (USD Million)
- Fig. 40 Denmark T-cell Lymphoma Market, 2018 - 2030 (USD Million)
- Fig. 41 Sweden T-cell Lymphoma Market, 2018 - 2030 (USD Million)
- Fig. 42 Norway T-cell Lymphoma Market, 2018 - 2030 (USD Million)
- Fig. 43 Asia Pacific T-cell Lymphoma Market, 2018 - 2030 (USD Million)
- Fig. 44 Japan T-cell Lymphoma Market, 2018 - 2030 (USD Million)
- Fig. 45 China T-cell Lymphoma Market, 2018 - 2030 (USD Million)
- Fig. 46 India T-cell Lymphoma Market, 2018 - 2030 (USD Million)
- Fig. 47 Australia T-cell Lymphoma Market, 2018 - 2030 (USD Million)
- Fig. 48 South Korea T-cell Lymphoma Market, 2018 - 2030 (USD Million)
- Fig. 49 Thailand T-cell Lymphoma Market, 2018 - 2030 (USD Million)
- Fig. 50 Latin America T-cell Lymphoma Market, 2018 - 2030 (USD Million)
- Fig. 51 Brazil T-cell Lymphoma Market, 2018 - 2030 (USD Million)
- Fig. 52 Argentina T-cell Lymphoma Market, 2018 - 2030 (USD Million)
- Fig. 53 Middle East and Africa T-cell Lymphoma Market, 2018 - 2030 (USD Million)
- Fig. 54 South Africa T-cell Lymphoma Market, 2018 - 2030 (USD Million)
- Fig. 55 Saudi Arabia T-cell Lymphoma Market, 2018 - 2030 (USD Million)
- Fig. 56 UAE T-cell Lymphoma Market, 2018 - 2030 (USD Million)
- Fig. 57 Kuwait T-cell Lymphoma Market, 2018 - 2030 (USD Million)
T-cell Lymphoma Market Growth & Trends:
The global T-cell lymphoma market size is anticipated to reach USD 3.70 billion by 2030, expanding at a CAGR of 8.83% from 2024 to 2030, according to a new report by Grand View Research, Inc. The TCL market is expanding substantially, driven by advancements in treatment options and strategic initiatives by pharmaceutical companies. The introduction of 14 new pipeline agents and expanded therapies for new indications are key factors fueling this growth. These developments aim to provide patients with more treatment choices beyond traditional chemotherapy, which has been a cornerstone in TCL therapy.
In 2023, the U.S. reported around 12,600 new cases of Peripheral T-Cell Lymphoma (PTCL), a number expected to rise by 2030, reflecting an increasing disease incidence. Moreover, CAR-T therapies for Non-Hodgkin Lymphoma (NHL) in markets such as the United States, France, Germany, Italy, Spain, UK, and Japan totaled approximately 155,300 cases in 2023. The pipeline for CAR-T therapies is diverse, targeting various stages of development and focusing mainly on B-cell Lymphoma types, with emerging interest in PTCL treatments.
Currently, anthracycline-based chemotherapy remains standard for newly diagnosed PTCL patients, with regimens like CHOP or CHOEP being typical first-line treatments. However, newer approaches such as CHP-BV for ALCL illustrate a shift towards more targeted therapies, enhancing treatment efficacy. Additionally, Japan has seen significant advancements with the introduction of drugs like HIYASTA, DARVIAS, and REMITORO for ATLL and R/R PTCL, expanding treatment options and driving market growth. These innovations provide hope for better outcomes, particularly for patients with limited therapeutic choices.
The field of CAR-T and NK cell therapies is also progressing, moving from preclinical phases to larger clinical studies. These innovative approaches offer promising prospects for personalized TCL treatments. In addition, biologics targeting specific TCL-related proteins and signals are under development, including PD-1/PD-L1 inhibitors, NK-cell engagers, anti-CD47 antibodies, and drugs like mogamulizumab targeting CCR4. These advancements aim to create more precise treatment platforms, potentially improving patient outcomes.
Looking ahead, strategic initiatives by pharmaceutical companies are expected to drive significant market changes by 2030, particularly in Japan and the U.S. These initiatives include introducing established drugs into new markets, exploring novel treatment approaches, and focusing on under-researched targets tailored to TCL subtypes.
However, the market faces challenges such as patent expires on standard treatments, leading to generic competition that could impact sales. Nonetheless, the entry of new agents into the market is anticipated to mitigate these challenges and sustain growth momentum.
Key players like Takeda Pharmaceuticals, Bristol-Myers Squibb, and Novartis are pivotal in driving market dynamics, alongside emerging firms such as Citius Pharmaceuticals, Innate Pharma, and Soligenix. Their innovative therapies like ADCETRIS and POTELIGEO are crucial in meeting TCL treatment needs. Novartis's commitment to CAR-T therapies underscores ongoing innovation, while emerging treatments like I/ONTAK (E7777), SGX301, and Lacutamab are poised to further enrich TCL management strategies. These companies are pivotal in shaping the future TCL landscape through strategic initiatives and pioneering treatments.
T-cell Lymphoma Market Report Highlights:
- Based on type, the Peripheral T-Cell Lymphoma (PTCL) segment held the largest revenue share of 66.47% in 2023
- Based on therapy, the chemotherapy segment held the largest revenue share of 26.69% in 2023. For many years, chemotherapy has been the cornerstone of TCL treatment, with regimens such as CHOP (cyclophosphamide, doxorubicin, vincristine, and prednisone) and CHOEP (cyclophosphamide, doxorubicin, vincristine, etoposide, and prednisone) being commonly used. These regimens are widely recognized for their effectiveness in managing disease and are typically the first line of treatment for newly diagnosed patients
- The Immunotherapy segment is expected to grow with a fastest growth rate of 7.21% over the forecast period. This rapid growth is driven by significant advancements and the introduction of novel therapies that harness the body's immune system to target cancer cells more precisely
- North America represents the largest market with share of 37.67% in 2023, driven by advanced healthcare infrastructure, high healthcare expenditure, and significant ongoing research and development
Table of Contents
Chapter 1. Methodology And Scope
- 1.1. Market Segmentation & Scope
- 1.2. Segment Definitions
- 1.2.1. Type
- 1.2.2. Therapy
- 1.3. Research Methodology
- 1.4. Information Procurement
- 1.4.1. Purchased database
- 1.4.2. GVR's internal database
- 1.4.3. Secondary sources
- 1.4.4. Primary research
- 1.4.5. Details of primary research
- 1.4.5.1. Data for primary interviews in North America
- 1.4.5.2. Data for primary interviews in Europe
- 1.4.5.3. Data for primary interviews in Asia Pacific
- 1.4.5.4. Data for primary interviews in Latin America
- 1.4.5.5. Data for primary interviews in MEA
- 1.5. Information or Data Analysis
- 1.5.1. Data analysis models
- 1.6. Market Formulation & Validation
- 1.7. Model Details
- 1.7.1. Commodity flow analysis (Model 1)
- 1.7.2. Approach 1: Commodity flow approach
- 1.7.3. Volume price analysis (Model 2)
- 1.7.4. Approach 2: Volume price analysis
- 1.8. List of Secondary Sources
- 1.9. List of Primary Sources
- 1.10. Objectives
Chapter 2. Market Variables, Trends, & Scope
- 2.1. Market Segmentation and Scope
- 2.2. Market Lineage Outlook
- 2.2.1. Parent Market Outlook
- 2.2.2. Related/Ancillary Market Outlook
- 2.3. Market Trends and Outlook
- 2.4. Market Dynamics
- 2.4.1. Advances in Immunotherapy and Targeted Therapies
- 2.4.2. Increasing Prevalence of T-cell Lymphoma Globally
- 2.4.3. Regulatory Approvals and Expanded Indications for Novel Treatments
- 2.5. Market Restraint Analysis
- 2.5.1. High Cost of Innovative Therapies
- 2.5.2. Limited Awareness and Diagnosis in Developing Regions
- 2.6. Business Environment Analysis
- 2.6.1. SWOT Analysis; By Factor (Political & Legal, Economic and Technological)
- 2.6.2. Porter's Five Forces Analysis
- 2.7. COVID-19 Impact Analysis
Chapter 3. T-cell Lymphoma Market: Type Business Analysis
- 3.1. Type Market Share, 2023 & 2030
- 3.2. Segment Dashboard
- 3.3. T-cell Lymphomas Market by Type Outlook
- 3.4. Market Size & Forecasts and Trend Analyses, 2018 to 2030 for the following
- 3.5. Peripheral
- 3.5.1. Market Estimates and Forecasts, 2018 - 2030 (USD Million)
- 3.5.2. Cutaneous T-cell Lymphoma
- 3.5.2.1. Market Estimates and Forecasts, 2018 - 2030 (USD Million)
- 3.5.3. Anaplastic Large Cell Lymphoma
- 3.5.3.1. Market Estimates and Forecasts, 2018 - 2030 (USD Million)
- 3.5.4. Angio-immuno-blastic T-cell Lymphoma
- 3.5.4.1. Market Estimates and Forecasts, 2018 - 2030 (USD Million)
- 3.5.5. Other
- 3.5.5.1. Market Estimates and Forecasts, 2018 - 2030 (USD Million)
- 3.6. Lymphoblastic
- 3.6.1. Market Estimates and Forecasts, 2018 - 2030 (USD Million)
Chapter 4. T-cell Lymphoma Market: Therapy Business Analysis
- 4.1. Therapy Market Share, 2023 & 2030
- 4.2. Segment Dashboard
- 4.3. T-cell Lymphomas Market by Therapy Outlook
- 4.4. Market Size & Forecasts and Trend Analyses, 2018 to 2030 for the following
- 4.5. Radiotherapy
- 4.5.1. Market Estimates and Forecasts, 2018 - 2030 (USD Million)
- 4.6. Chemotherapy
- 4.6.1. Market Estimates and Forecasts, 2018 - 2030 (USD Million)
- 4.7. Immunotherapy
- 4.7.1. Market Estimates and Forecasts, 2018 - 2030 (USD Million)
- 4.8. Stem Cell Transplantation
- 4.8.1. Market Estimates and Forecasts, 2018 - 2030 (USD Million)
- 4.9. Other
- 4.9.1. Market Estimates and Forecasts, 2018 - 2030 (USD Million)
Chapter 5. T-cell Lymphoma Market: Regional Business Analysis
- 5.1. T-cell Lymphoma Market Share By Region, 2023 & 2030
- 5.2. North America
- 5.2.1. U.S.
- 5.2.1.1. Key Country Dynamics
- 5.2.1.2. Target Disease Prevalence
- 5.2.1.3. Competitive Scenario
- 5.2.1.4. Regulatory Framework
- 5.2.1.5. Reimbursement Scenario
- 5.2.1.6. U.S. T-cell Lymphoma Market, 2018 - 2030 (USD Million)
- 5.2.2. Canada
- 5.2.2.1. Key Country Dynamics
- 5.2.2.2. Target Disease Prevalence
- 5.2.2.3. Competitive Scenario
- 5.2.2.4. Regulatory Framework
- 5.2.2.5. Reimbursement Scenario
- 5.2.2.6. Canada T-cell Lymphoma Market, 2018 - 2030 (USD Million)
- 5.2.3. Mexico
- 5.2.3.1. Key Country Dynamics
- 5.2.3.2. Target Disease Prevalence
- 5.2.3.3. Competitive Scenario
- 5.2.3.4. Regulatory Framework
- 5.2.3.5. Reimbursement Scenario
- 5.2.3.6. Mexico T-cell Lymphoma Market, 2018 - 2030 (USD Million)
- 5.2.1. U.S.
- 5.3. Europe
- 5.3.1. Europe T-cell Lymphomas Market, 2018 - 2030 (USD Million)
- 5.3.2. Germany
- 5.3.2.1. Key Country Dynamics
- 5.3.2.2. Target Disease Prevalence
- 5.3.2.3. Competitive Scenario
- 5.3.2.4. Regulatory Framework
- 5.3.2.5. Reimbursement Scenario
- 5.3.2.6. Germany T-cell Lymphoma Market, 2018 - 2030 (USD Million)
- 5.3.3. UK
- 5.3.3.1. Key Country Dynamics
- 5.3.3.2. Target Disease Prevalence
- 5.3.3.3. Competitive Scenario
- 5.3.3.4. Regulatory Framework
- 5.3.3.5. Reimbursement Scenario
- 5.3.3.6. UK T-cell Lymphoma Market, 2018 - 2030 (USD Million)
- 5.3.4. France
- 5.3.4.1. Key Country Dynamics
- 5.3.4.2. Target Disease Prevalence
- 5.3.4.3. Competitive Scenario
- 5.3.4.4. Regulatory Framework
- 5.3.4.5. Reimbursement Scenario
- 5.3.4.6. France T-cell Lymphoma Market, 2018 - 2030 (USD Million)
- 5.3.5. Italy
- 5.3.5.1. Key Country Dynamics
- 5.3.5.2. Target Disease Prevalence
- 5.3.5.3. Competitive Scenario
- 5.3.5.4. Regulatory Framework
- 5.3.5.5. Reimbursement Scenario
- 5.3.5.6. Italy T-cell Lymphoma Market, 2018 - 2030 (USD Million)
- 5.3.6. Spain
- 5.3.6.1. Key Country Dynamics
- 5.3.6.2. Target Disease Prevalence
- 5.3.6.3. Competitive Scenario
- 5.3.6.4. Regulatory Framework
- 5.3.6.5. Reimbursement Scenario
- 5.3.6.6. Spain T-cell Lymphoma Market, 2018 - 2030 (USD Million)
- 5.3.7. Denmark
- 5.3.7.1. Key Country Dynamics
- 5.3.7.2. Target Disease Prevalence
- 5.3.7.3. Competitive Scenario
- 5.3.7.4. Regulatory Framework
- 5.3.7.5. Reimbursement Scenario
- 5.3.7.6. Denmark T-cell Lymphoma Market, 2018 - 2030 (USD Million)
- 5.3.8. Sweden
- 5.3.8.1. Key Country Dynamics
- 5.3.8.2. Target Disease Prevalence
- 5.3.8.3. Competitive Scenario
- 5.3.8.4. Regulatory Framework
- 5.3.8.5. Reimbursement Scenario
- 5.3.8.6. Sweden T-cell Lymphoma Market, 2018 - 2030 (USD Million)
- 5.3.9. Norway
- 5.3.9.1. Key Country Dynamics
- 5.3.9.2. Target Disease Prevalence
- 5.3.9.3. Competitive Scenario
- 5.3.9.4. Regulatory Framework
- 5.3.9.5. Reimbursement Scenario
- 5.3.9.6. Norway T-cell Lymphoma Market, 2018 - 2030 (USD Million)
- 5.4. Asia Pacific
- 5.4.1. Asia Pacific T-cell Lymphoma Market,, 2018 - 2030 (USD Million)
- 5.4.2. Japan
- 5.4.2.1. Key Country Dynamics
- 5.4.2.2. Target Disease Prevalence
- 5.4.2.3. Competitive Scenario
- 5.4.2.4. Regulatory Framework
- 5.4.2.5. Reimbursement Scenario
- 5.4.2.6. Japan T-cell Lymphoma Market, 2018 - 2030 (USD Million)
- 5.4.3. China
- 5.4.3.1. Key Country Dynamics
- 5.4.3.2. Target Disease Prevalence
- 5.4.3.3. Competitive Scenario
- 5.4.3.4. Regulatory Framework
- 5.4.3.5. Reimbursement Scenario
- 5.4.3.6. China T-cell Lymphoma Market, 2018 - 2030 (USD Million)
- 5.4.4. India
- 5.4.4.1. Key Country Dynamics
- 5.4.4.2. Target Disease Prevalence
- 5.4.4.3. Competitive Scenario
- 5.4.4.4. Regulatory Framework
- 5.4.4.5. Reimbursement Scenario
- 5.4.4.6. India T-cell Lymphoma Market, 2018 - 2030 (USD Million)
- 5.4.5. South Korea
- 5.4.5.1. Key Country Dynamics
- 5.4.5.2. Target Disease Prevalence
- 5.4.5.3. Competitive Scenario
- 5.4.5.4. Regulatory Framework
- 5.4.5.5. Reimbursement Scenario
- 5.4.5.6. South Korea T-cell Lymphoma Market, 2018 - 2030 (USD Million)
- 5.4.6. Australia
- 5.4.6.1. Key Country Dynamics
- 5.4.6.2. Target Disease Prevalence
- 5.4.6.3. Competitive Scenario
- 5.4.6.4. Regulatory Framework
- 5.4.6.5. Reimbursement Scenario
- 5.4.6.6. Australia T-cell Lymphoma Market, 2018 - 2030 (USD Million)
- 5.4.7. Thailand
- 5.4.7.1. Key Country Dynamics
- 5.4.7.2. Target Disease Prevalence
- 5.4.7.3. Competitive Scenario
- 5.4.7.4. Regulatory Framework
- 5.4.7.5. Reimbursement Scenario
- 5.4.7.6. Thailand T-cell Lymphoma Market, 2018 - 2030 (USD Million)
- 5.5. Latin America
- 5.5.1. Latin America T-cell Lymphoma Market,, 2018 - 2030 (USD Million)
- 5.5.2. Brazil
- 5.5.2.1. Key Country Dynamics
- 5.5.2.2. Target Disease Prevalence
- 5.5.2.3. Competitive Scenario
- 5.5.2.4. Regulatory Framework
- 5.5.2.5. Reimbursement Scenario
- 5.5.2.6. Brazil T-cell Lymphoma Market, 2018 - 2030 (USD Million)
- 5.5.3. Argentina
- 5.5.3.1. Key Country Dynamics
- 5.5.3.2. Target Disease Prevalence
- 5.5.3.3. Competitive Scenario
- 5.5.3.4. Regulatory Framework
- 5.5.3.5. Reimbursement Scenario
- 5.5.3.6. Argentina T-cell Lymphoma Market, 2018 - 2030 (USD Million)
- 5.6. MEA
- 5.6.1. MEA T-cell Lymphoma Market,, 2018 - 2030 (USD Million)
- 5.6.2. South Africa
- 5.6.2.1. Key Country Dynamics
- 5.6.2.2. Target Disease Prevalence
- 5.6.2.3. Competitive Scenario
- 5.6.2.4. Regulatory Framework
- 5.6.2.5. Reimbursement Scenario
- 5.6.2.6. South Africa T-cell Lymphoma Market, 2018 - 2030 (USD Million)
- 5.6.3. Saudi Arabia
- 5.6.3.1. Key Country Dynamics
- 5.6.3.2. Target Disease Prevalence
- 5.6.3.3. Competitive Scenario
- 5.6.3.4. Regulatory Framework
- 5.6.3.5. Reimbursement Scenario
- 5.6.3.6. Saudi Arabia T-cell Lymphoma Market, 2018 - 2030 (USD Million)
- 5.6.4. UAE
- 5.6.4.1. Key Country Dynamics
- 5.6.4.2. Target Disease Prevalence
- 5.6.4.3. Competitive Scenario
- 5.6.4.4. Regulatory Framework
- 5.6.4.5. Reimbursement Scenario
- 5.6.4.6. UAE T-cell Lymphoma Market, 2018 - 2030 (USD Million)
- 5.6.5. Kuwait
- 5.6.5.1. Key Country Dynamics
- 5.6.5.2. Target Disease Prevalence
- 5.6.5.3. Competitive Scenario
- 5.6.5.4. Regulatory Framework
- 5.6.5.5. Reimbursement Scenario
- 5.6.5.6. Kuwait T-cell Lymphoma Market, 2018 - 2030 (USD Million)
Chapter 6. Competitive Landscape
- 6.1. Participant's overview
- 6.2. Financial performance
- 6.3. Participant categorization
- 6.3.1. Market Leaders
- 6.3.2. T-cell Lymphoma Market Share Analysis, 2023
- 6.3.3. Company Profiles
- 6.3.3.1. Acrotech Biopharma
- 6.3.3.1.1. Company Overview
- 6.3.3.1.2. Financial Performance
- 6.3.3.1.3. Product Benchmarking
- 6.3.3.1.4. Strategic Initiatives
- 6.3.3.2. Affimed GmbH
- 6.3.3.2.1. Company Overview
- 6.3.3.2.2. Financial Performance
- 6.3.3.2.3. Product Benchmarking
- 6.3.3.2.4. Strategic Initiatives
- 6.3.3.3. Bristol Myers Squibb
- 6.3.3.3.1. Company Overview
- 6.3.3.3.2. Financial Performance
- 6.3.3.3.3. Product Benchmarking
- 6.3.3.3.4. Strategic Initiatives
- 6.3.3.4. Chipscreen Biosciences
- 6.3.3.4.1. Company Overview
- 6.3.3.4.2. Financial Performance
- 6.3.3.4.3. Product Benchmarking
- 6.3.3.4.4. Strategic Initiatives
- 6.3.3.5. Citius Pharma
- 6.3.3.5.1. Company Overview
- 6.3.3.5.2. Financial Performance
- 6.3.3.5.3. Product Benchmarking
- 6.3.3.5.4. Strategic Initiatives
- 6.3.3.6. DAIICHI SANKYO COMPANY, LIMITED
- 6.3.3.6.1. Company Overview
- 6.3.3.6.2. Financial Performance
- 6.3.3.6.3. Product Benchmarking
- 6.3.3.6.4. Strategic Initiatives
- 6.3.3.7. Eisai Co., Ltd.
- 6.3.3.7.1. Company Overview
- 6.3.3.7.2. Financial Performance
- 6.3.3.7.3. Product Benchmarking
- 6.3.3.7.4. Strategic Initiatives
- 6.3.3.8. Genor Biopharma Co. Ltd
- 6.3.3.8.1. Company Overview
- 6.3.3.8.2. Financial Performance
- 6.3.3.8.3. Product Benchmarking
- 6.3.3.8.4. Strategic Initiatives
- 6.3.3.9. Innate Pharma
- 6.3.3.9.1. Company Overview
- 6.3.3.9.2. Financial Performance
- 6.3.3.9.3. Product Benchmarking
- 6.3.3.9.4. Strategic Initiatives
- 6.3.3.10. Dizal Pharma
- 6.3.3.10.1. Company Overview
- 6.3.3.10.2. Financial Performance
- 6.3.3.10.3. Product Benchmarking
- 6.3.3.10.4. Strategic Initiatives
- 6.3.4. Strategy Mapping
- 6.3.4.1. Expansion
- 6.3.4.2. Acquisition
- 6.3.4.3. Collaborations
- 6.3.4.4. Product/Service Launch
- 6.3.4.5. Partnerships
- 6.3.4.6. Others
