|
|
市場調査レポート
商品コード
1512068
米国の釣り用品の市場規模・シェア・動向分析レポート:製品別、価格帯別、流通チャネル別、セグメント別予測、2024年~2030年U.S. Fishing Goods Market Size, Share & Trends Analysis Report By Product (Apparel, Footwear, Equipment), Price Range (Mass, Premium), Distribution Channel (Online, Sporting Goods Retailers), And Segment Forecasts, 2024 - 2030 |
||||||
|
|||||||
カスタマイズ可能
|
|||||||

| 米国の釣り用品の市場規模・シェア・動向分析レポート:製品別、価格帯別、流通チャネル別、セグメント別予測、2024年~2030年 |
|
出版日: 2024年06月26日
発行: Grand View Research
ページ情報: 英文 80 Pages
納期: 2~10営業日
|

全表示
- 概要
- 図表
- 目次
米国の釣り用品市場の成長と動向
Grand View Research, Inc.の最新レポートによると、米国の釣り用品市場規模は2030年までに109億5,000万米ドルに達し、2024年から2030年までのCAGRは3.2%で成長すると予測されています。
レクリエーショナルフィッシングは、アウトドアレジャーを求める米国人が増えるにつれて、人気が高まり続けています。パンデミックによる屋外レクリエーションへのシフトは、釣りへの参加率を高める上で重要な役割を果たしています。家族や個人がリラックスして自然と触れ合うために釣りをするようになっています。このような関心の高まりは、基本的な釣竿やタックルから高度な道具に至るまで、釣り用品への需要の高まりにつながり、市場の拡大に寄与しています。
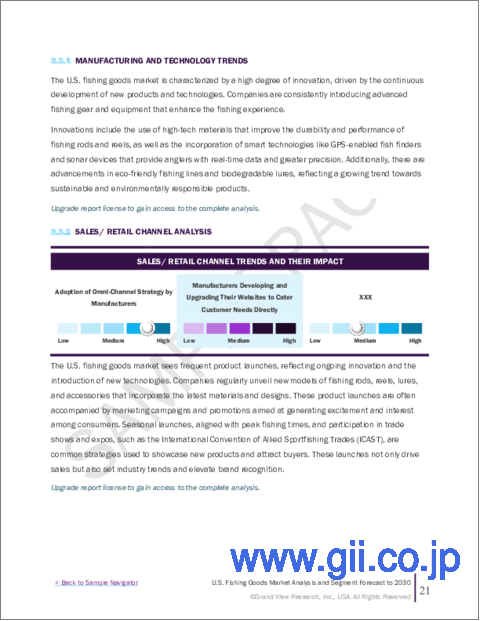
釣り用品市場は、絶え間ない技術革新の恩恵を受けています。スマートロッドやリール、ソナー装置、GPS対応魚群探知機などのハイテク釣り具は、効率と成功率を向上させることで釣りの体験を高めています。こうした進歩は、ベテランの釣り愛好家だけでなく、技術に精通した若い世代をも魅了し、売上を押し上げています。さらに、環境に優しく持続可能な製品の開拓は、環境意識の高い消費者にアピールし、市場の成長をさらに後押ししています。
環境意識は、釣り用品市場における消費者の嗜好にますます影響を与えています。持続可能な形で生産され、環境に優しい製品への需要が高まっています。メーカー各社は、生分解性ルアー、環境に優しい釣り糸、持続可能な衣料品を開発することで対応しています。これらの製品は、環境意識の高い消費者の期待に応えるだけでなく、水生生態系を保護し、市場の成長を支えることを目的とした規制基準にも適合しています。
さらに、漁業がもたらす経済効果も見逃せないです。漁業は地域経済に大きく貢献しており、特に沿岸部や農村部では、観光業や関連サービスが漁業活動によって繁栄しています。宿泊施設、チャーター・サービス、フィッシング・ガイド、その他の地元ビジネスに消費する観光客の流入によって、市場は利益を得る。このような経済活性化は、釣り場やボート乗り場、レクリエーション施設の開発など、釣り体験やアクセスを総合的に向上させるインフラへの投資によってさらに支えられています。
米国釣り用品市場レポート・ハイライト
- フィッシング・アパレル市場は、2024年から2030年にかけてCAGR 2.7%で成長する見込み。生地とデザインにおける技術革新は、フィッシング・アパレル市場の成長を牽引する極めて重要な要素です。現代のフィッシング・ウェアは、UV耐性素材、吸湿発散性技術、通気性素材など、様々な気象条件下で釣り人を快適に保つ、要素に対する優れた保護を提供する高度な素材を取り入れています。
- プレミアム釣り用品市場は、2024年から2030年にかけてCAGR 3.8%で成長すると予想されます。この成長の原動力は、可処分所得の増加と、高品質で耐久性に優れ、技術的にも先進的な釣り具に投資しようという消費者の意欲です。プレミアム製品は多くの場合、優れた性能、長寿命、革新的な機能を提供し、本格的な釣り愛好家にアピールします。このセグメントの成長は市場全体の金額に大きく貢献しています。
- 釣り用品のオンライン販売は、2024年から2030年にかけてCAGR 4.6%で成長し、市場全体の成長に大きく寄与すると予測されます。オンライン小売業者が提供する利便性、豊富な品揃え、競争力のある価格設定は、消費者にとって大きな魅力です。eコマース・プラットフォームの台頭や、商品の視覚化やパーソナライズされたショッピング体験のための拡張現実などのオンライン小売技術の進歩は、顧客満足度を高め、オンライン販売を促進しています。
目次
第1章 調査手法と範囲
第2章 エグゼクティブサマリー
第3章 米国の釣り用品市場の変数、動向、範囲
- 市場系統の見通し
- 業界バリューチェーン分析
- 販売/小売チャネル分析
- 利益率分析
- 市場力学
- 市場 促進要因分析
- 市場抑制要因分析
- 業界の課題
- 業界の機会
- 業界分析- ポーターのファイブフォース分析
- 市場参入戦略
第4章 消費者行動分析
- デモグラフィック分析
- 消費者の動向と嗜好
- 購入決定に影響を与える要因
- 消費者タイプの採用
- 観察と推奨事項
第5章 米国の釣り用品市場:製品別推定・動向分析
- 製品変動分析と市場シェア、2023年と2030年
- フットウェア
- 装備
第6章 米国の釣り用品市場:価格帯別推定・動向分析
- マス
- プレミアム
第7章 米国の釣り用品市場:流通チャネル別推定・動向分析
- オンライン
- スポーツ用品小売業者
- ハイパーマーケットとスーパーマーケット
- 高級ブランドアウトレット
第8章 競合分析
- 主要市場参入企業による最近の動向と影響分析
- 企業分類
- 参入企業の概要
- 財務実績
- 製品ベンチマーク
- 企業市場シェア分析、2023年(%)
- 企業ヒートマップ分析
- 戦略マッピング
- 企業プロファイル
- Pure Fishing, Inc.
- 会社概要
- 財務実績
- タイプベンチマーク
- 戦略的取り組み
- Shimano North America Fishing, Inc.
- 会社概要
- 財務実績
- タイプベンチマーク
- 戦略的取り組み
- Daiwa Corporation
- 会社概要
- 財務実績
- タイプベンチマーク
- 戦略的取り組み
- Rapala USA
- 会社概要
- 財務実績
- タイプベンチマーク
- 戦略的取り組み
- Johnson Outdoors Inc.
- 会社概要
- 財務実績
- タイプベンチマーク
- 戦略的取り組み
- Eagle Claw Fishing Tackle Co.
- 会社概要
- 財務実績
- タイプベンチマーク
- 戦略的取り組み
- St. Croix Rods
- 会社概要
- 財務実績
- タイプベンチマーク
- 戦略的取り組み
- Lew's Fishing
- 会社概要
- 財務実績
- タイプベンチマーク
- 戦略的取り組み
- Zebco(Zero Hour Bomb Company)
- 会社概要
- 財務実績
- タイプベンチマーク
- 戦略的取り組み
- Plano Synergy Holdings, Inc.
- 会社概要
- 財務実績
- タイプベンチマーク
- 戦略的取り組み
List of Tables
- Table 1. U.S. fishing goods market - Driving factor market analysis
- Table 2. U.S. fishing goods market - Restraint factor market analysis
- Table 3. U.S. fishing goods market estimates & forecast, by product (USD Million)
- Table 4. U.S. fishing goods market estimates & forecast, by price range (USD Million)
- Table 5. U.S. fishing goods market estimates & forecast, by distribution channel (USD Million)
- Table 6. U.S. macro-economic outlay
- Table 7. Recent developments & impact analysis, by key market participants
- Table 8. Company market share, 2023
- Table 9. Company heat map analysis
- Table 10. Key companies launching new products
- Table 11. Companies undergoing expansions
- Table 12. Key Companies involved in partnerships/acquisitions
List of Figures
- Fig. 1 U.S. fishing goods market segmentation
- Fig. 2 Information procurement
- Fig. 3 Primary research pattern
- Fig. 4 Primary research approaches
- Fig. 5 Primary research process
- Fig. 6 Market snapshot
- Fig. 7 Product segment snapshot
- Fig. 8 Price Range segment snapshot
- Fig. 9 Distribution channel segment snapshot
- Fig. 10 Competitive landscape snapshot
- Fig. 11 U.S. fishing goods market - Value chain analysis
- Fig. 12 U.S. fishing goods market - Market dynamics
- Fig. 13 U.S. fishing goods market - Value chain analysis
- Fig. 14 U.S. fishing goods market, by product: Key takeaways
- Fig. 15 U.S. fishing goods market, by product: Market share, 2023 & 2030
- Fig. 16 U.S. fishing apparel market estimates & forecasts, 2018 - 2030 (USD Million)
- Fig. 17 U.S. fishing footwear market estimates & forecasts, 2018 - 2030 (USD Million)
- Fig. 18 U.S. fishing equipment market estimates & forecasts, 2018 - 2030 (USD Million)
- Fig. 19 U.S. rods, reels and components market estimates & forecasts, 2018 - 2030 (USD Million)
- Fig. 20 U.S. lines and leaders market estimates & forecasts, 2018 - 2030 (USD Million)
- Fig. 21 U.S. lures, flies, and artificial baits market estimates & forecasts, 2018 - 2030 (USD Million)
- Fig. 22 U.S. creels, strings, and landing nets market estimates & forecasts, 2018 - 2030 (USD Million)
- Fig. 23 U.S. other fishing goods market estimates & forecasts, 2018 - 2030 (USD Million)
- Fig. 24 U.S. fishing goods market, by price range: Key takeaways
- Fig. 25 U.S. fishing goods market, by price range: Market share, 2023 & 2030
- Fig. 26 U.S. mass fishing goods market estimates & forecasts, 2018 - 2030 (USD Million)
- Fig. 27 U.S. premium fishing goods market estimates & forecasts, 2018 - 2030 (USD Million)
- Fig. 28 U.S. fishing goods market, by distribution channel: Key takeaways
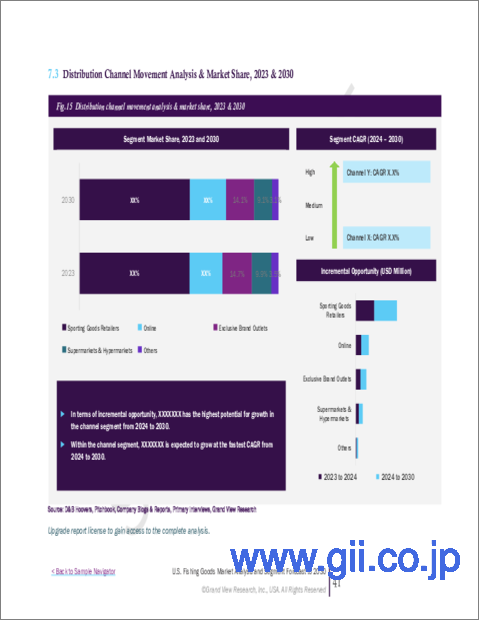
- Fig. 29 U.S. fishing goods market, by distribution channel: Market share, 2023 & 2030
- Fig. 30 U.S. fishing goods market estimates & forecasts, through online, 2018 - 2030 (USD Million)
- Fig. 31 U.S. fishing goods market estimates & forecasts, through sporting goods retailers, 2018 - 2030 (USD Million)
- Fig. 32 U.S. fishing goods market estimates & forecasts, through supermarkets & hypermarkets, 2018 - 2030 (USD Million)
- Fig. 33 U.S. fishing goods market estimates & forecasts, through exclusive brand outlets, 2018 - 2030 (USD Million)
- Fig. 34 U.S. fishing goods market estimates & forecasts, through other channels, 2018 - 2030 (USD Million)
- Fig. 35 Key company categorization
- Fig. 36 Company market share analysis, 2023
- Fig. 37 Strategic framework of the U.S. fishing goods market
U.S. Fishing Goods Market Growth & Trends:
The U.S. fishing goods market size is expected to reach USD 10.95 billion by 2030, growing at a CAGR of 3.2% from 2024 to 2030, according to a new report by Grand View Research, Inc. Recreational fishing continues to gain popularity as more Americans seek outdoor leisure activities. The pandemic-induced shift towards outdoor recreation has played a significant role in boosting fishing participation rates. Families and individuals are turning to fishing to relax and connect with nature. This growing interest translates into higher demand for fishing goods, from basic fishing rods and tackle to advanced equipment, contributing to market expansion.
The fishing goods market is benefiting from continuous technological innovations. High-tech fishing gear, including smart rods and reels, sonar devices, and GPS-enabled fish finders, enhances the fishing experience by improving efficiency and success rates. These advancements attract both seasoned anglers and tech-savvy younger generations, driving sales. Additionally, developing eco-friendly and sustainable products appeals to environmentally conscious consumers, further fueling the market growth.
Environmental consciousness is increasingly influencing consumer preferences in the fishing goods market. There is a growing demand for products that are sustainably produced and environmentally friendly. Manufacturers are responding by developing biodegradable lures, eco-friendly fishing lines, and sustainable apparel. These products not only meet the expectations of ecologically conscious consumers but also comply with regulatory standards aimed at protecting aquatic ecosystems and supporting market growth.
Additionally, the economic impact of fishing cannot be overlooked. Fishing contributes significantly to local economies, particularly in coastal and rural areas where tourism and related services thrive on fishing activities. The market benefits from the influx of visitors who spend on accommodations, charter services, fishing guides, and other local businesses. This economic boost is further supported by investments in infrastructure, such as the development of fishing piers, boat ramps, and recreational facilities, which enhance the overall fishing experience and accessibility.
U.S. Fishing Goods Market Report Highlights:
- The fishing apparel market is expected to grow at a CAGR of 2.7% from 2024 to 2030. Technological innovations in fabric and design are pivotal in driving the growth of the fishing apparel market. Modern fishing clothing incorporates advanced materials that offer superior protection against the elements, such as UV-resistant fabrics, moisture-wicking technology, and breathable materials that keep anglers comfortable in various weather conditions.
- The premium fishing goods market is expected to grow at a CAGR of 3.8% from 2024 to 2030. This growth is driven by increasing disposable incomes and a willingness among consumers to invest in high-quality, durable, and technologically advanced fishing equipment. Premium products often offer superior performance, longevity, and innovative features that appeal to serious anglers. This segment's growth contributes significantly to the overall market value.
- Online sales of fishing goods are projected to grow at a CAGR of 4.6% from 2024 to 2030, significantly contributing to the market's overall growth. The convenience, extensive product selection, and competitive pricing offered by online retailers are major draws for consumers. The rise of e-commerce platforms and advancements in online retail technology, including augmented reality for product visualization and personalized shopping experiences, enhance customer satisfaction and drive online sales.
Table of Contents
Chapter 1. Methodology and Scope
- 1.1. Market Segmentation & Scope
- 1.2. Market Definition
- 1.3. Information Procurement
- 1.3.1. Purchased Database
- 1.3.2. GVR's Internal Database
- 1.3.3. Secondary Sources & Third-Party Perspectives
- 1.3.4. Primary Research
- 1.4. Information Analysis
- 1.4.1. Data Analysis Models
- 1.5. Market Formulation & Data Visualization
- 1.6. Data Validation & Publishing
Chapter 2. Executive Summary
- 2.1. Market Outlook
- 2.2. Product Outlook
- 2.3. Price Range Outlook
- 2.4. Distribution Channel Outlook
- 2.5. Competitive Insights
Chapter 3. U.S. Fishing Goods Market Variables, Trends & Scope
- 3.1. Market Lineage Outlook
- 3.2. Industry Value Chain Analysis
- 3.2.1. Sales/Retail Channel Analysis
- 3.2.2. Profit Margin Analysis
- 3.3. Market Dynamics
- 3.3.1. Market Driver Analysis
- 3.3.2. Market Restraint Analysis
- 3.3.3. Industry Challenges
- 3.3.4. Industry Opportunities
- 3.4. Industry Analysis - Porter's
- 3.5. Market Entry Strategies
Chapter 4. Consumer Behavior Analysis
- 4.1. Demographic Analysis
- 4.2. Consumer Trends and Preferences
- 4.3. Factors Affecting Buying Decision
- 4.4. Consumer Type Adoption
- 4.5. Observations & Recommendations
Chapter 5. U.S. Fishing Goods Market: Product Estimates & Trend Analysis
- 5.1. Product Movement Analysis & Market Share, 2023 & 2030
- 5.2. Equipment
- 5.2.1. Market estimates and forecast, 2018 - 2030 (USD Million)
- 5.3. Footwear
- 5.3.1. Market estimates and forecast, 2018 - 2030 (USD Million)
- 5.4. Equipment
- 5.4.1. Market estimates and forecast, 2018 - 2030 (USD Million)
- 5.4.1.1. Rods, Reels, and Components
- 5.4.1.1.1. Market estimates and forecast, 2018 - 2030 (USD Million)
- 5.4.1.2. Lines and Leaders
- 5.4.1.2.1. Market estimates and forecast, 2018 - 2030 (USD Million)
- 5.4.1.3. Lures, Flies, and Artificial Baits
- 5.4.1.3.1. Market estimates and forecast, 2018 - 2030 (USD Million)
- 5.4.1.4. Creels, Strings, and Landing Nets
- 5.4.1.4.1. Market estimates and forecast, 2018 - 2030 (USD Million)
- 5.4.1.5. Others (Skis, Snowboards, and Others)
- 5.4.1.5.1. Market estimates and forecast, 2018 - 2030 (USD Million)
- 5.4.1. Market estimates and forecast, 2018 - 2030 (USD Million)
Chapter 6. U.S. Fishing Goods Market: Price Range Estimates & Trend Analysis
- 6.1. Mass
- 6.1.1. Market estimates and forecast, 2018 - 2030 (USD Million)
- 6.2. Premium
- 6.2.1. Market estimates and forecast, 2018 - 2030 (USD Million)
Chapter 7. U.S. Fishing Goods Market: Distribution Channel Estimates & Trend Analysis
- 7.1. Online
- 7.1.1. Market estimates and forecast, 2018 - 2030 (USD Million)
- 7.2. Sporting Goods Retailers
- 7.2.1. Market estimates and forecast, 2018 - 2030 (USD Million)
- 7.3. Hypermarkets & Supermarkets
- 7.3.1. Market estimates and forecast, 2018 - 2030 (USD Million)
- 7.4. Exclusive Brand Outlets
- 7.4.1. Market estimates and forecast, 2018 - 2030 (USD Million)
- 7.4.2. Others
- 7.4.2.1. Market estimates and forecast, 2018 - 2030 (USD Million)
Chapter 8. Competitive Analysis
- 8.1. Recent developments & impact analysis, by key market participants
- 8.2. Company Categorization
- 8.3. Participant's Overview
- 8.4. Financial Performance
- 8.5. Product Benchmarking
- 8.6. Company Market Share Analysis, 2023 (%)
- 8.7. Company Heat Map Analysis
- 8.8. Strategy Mapping
- 8.9. Company Profiles
- 8.10. Pure Fishing, Inc.
- 8.10.1. Company Overview
- 8.10.2. Financial Performance
- 8.10.3. Type Benchmarking
- 8.10.4. Strategic Initiatives
- 8.11. Shimano North America Fishing, Inc.
- 8.11.1. Company Overview
- 8.11.2. Financial Performance
- 8.11.3. Type Benchmarking
- 8.11.4. Strategic Initiatives
- 8.12. Daiwa Corporation
- 8.12.1. Company Overview
- 8.12.2. Financial Performance
- 8.12.3. Type Benchmarking
- 8.12.4. Strategic Initiatives
- 8.13. Rapala USA
- 8.13.1. Company Overview
- 8.13.2. Financial Performance
- 8.13.3. Type Benchmarking
- 8.13.4. Strategic Initiatives
- 8.14. Johnson Outdoors Inc.
- 8.14.1. Company Overview
- 8.14.2. Financial Performance
- 8.14.3. Type Benchmarking
- 8.14.4. Strategic Initiatives
- 8.15. Eagle Claw Fishing Tackle Co.
- 8.15.1. Company Overview
- 8.15.2. Financial Performance
- 8.15.3. Type Benchmarking
- 8.15.4. Strategic Initiatives
- 8.16. St. Croix Rods
- 8.16.1. Company Overview
- 8.16.2. Financial Performance
- 8.16.3. Type Benchmarking
- 8.16.4. Strategic Initiatives
- 8.17. Lew's Fishing
- 8.17.1. Company Overview
- 8.17.2. Financial Performance
- 8.17.3. Type Benchmarking
- 8.17.4. Strategic Initiatives
- 8.18. Zebco (Zero Hour Bomb Company)
- 8.18.1. Company Overview
- 8.18.2. Financial Performance
- 8.18.3. Type Benchmarking
- 8.18.4. Strategic Initiatives
- 8.19. Plano Synergy Holdings, Inc.
- 8.19.1. Company Overview
- 8.19.2. Financial Performance
- 8.19.3. Type Benchmarking
- 8.19.4. Strategic Initiatives

