|
|
市場調査レポート
商品コード
1512025
不妊治療サービスの市場規模、シェア、動向分析レポート:タイプ別、プロバイダー別、地域別、セグメント予測、2024年~2030年Fertility Services Market Size, Share & Trends Analysis Report By Type (Diagnosis, Treatment, Preservation), By Provider, By Region, And Segment Forecasts, 2024 - 2030 |
||||||
|
|||||||
カスタマイズ可能
|
|||||||

| 不妊治療サービスの市場規模、シェア、動向分析レポート:タイプ別、プロバイダー別、地域別、セグメント予測、2024年~2030年 |
|
出版日: 2024年06月13日
発行: Grand View Research
ページ情報: 英文 145 Pages
納期: 2~10営業日
|

全表示
- 概要
- 図表
- 目次
不妊治療サービス市場の成長と動向:
Grand View Research, Inc.の最新レポートによると、世界の不妊治療サービス市場は2030年までに702億7,000万米ドルに達すると予測され、2024年から2030年までのCAGRは7.50%で成長すると予測されています。
特に、高齢、早発卵巣不全、男女の不妊症の増加などの問題に直面している人々の間で、不妊治療サービスの採用が増加していることが、市場成長を促進する主な要因です。
体外受精サービスは特に35~39歳の間で人気があり、不妊治療サービスの需要を牽引しています。さらに、晩婚化の動向や加齢に伴う不妊症の増加など、いくつかの問題により世界の出生率は着実に低下しています。国連の「世界家族計画2022」報告書によると、世界の出生率は1990年の女性一人当たり3.3人から2021年には2.3人に減少します。この出生率の低下により、男女のARTに対する需要が大幅に増加しています。加えて、高額なART治療に対する政府からの支援金が市場成長を促進すると予想されます。
インドでは、政府は病院設立のための低利融資、医薬品・機器購入のための補助金、診療所用地の購入などのインセンティブを提供しています。低コストを生かすため、インド政府は外国人観光客にM(医療)ビザを、配偶者には1年間有効のMXビザを発行しています。例えば、オーストラリアでは2022年5月、ニューサウスウェールズ州政府の2022-2023年度予算により、体外受精を選択したニューサウスウェールズ州の女性に2,000米ドルのキャッシュリベートが支給され、患者の治療費が削減されます。凍結ナンドナーの体外受精治療の需要は大幅に増加すると予測されています。これは、凍結ナンデナー(患者の卵子)を使用した手術の件数が多いことに起因しています。
不妊治療サービス市場レポートハイライト
- タイプ別では、治療分野が2023年に65.33%の最大売上シェアで市場を占めました。治療セグメントはさらに体外受精(IVF)と人工授精に区分されます。2023年には、IVF治療が市場成長を支配しました。
- 不妊治療の成果が向上したことで、不妊治療サービスに対する認識が高まっています。有利な償還政策、可処分所得の増加、不妊治療の利用可能性も成長を後押ししています。
- 不妊治療クリニックの進歩や新技術の導入により、2023年には不妊治療クリニックが80.02%の売上シェアで市場を占めました。
- 欧州は2023年に35.74%の売上シェアで市場を独占したが、これは欧州市場におけるプライベート・エクイティ投資家からの投資の増加によるもので、市場成長に有利な機会を提供しています。
- 2023年5月、ジェネア・バイオメデックスはAIVFと提携し、個別化・最適化された体外受精ケアのための統合ソリューションを提供します。
- 2022年10月、新興企業のアライフが体外受精の治療成績向上とコスト削減を目的としたAI技術を発表。
目次
第1章 調査手法と範囲
第2章 エグゼクティブサマリー
第3章 市場の変数、動向、範囲
- 市場系統の見通し
- 関連/補助市場見通し
- 市場動向と展望
- 市場力学
- 市場 促進要因分析
- 市場抑制要因分析
- 業界の機会
- 業界の課題
- ビジネス環境分析
- 業界分析- ポーターのファイブフォース分析
- PESTEL分析
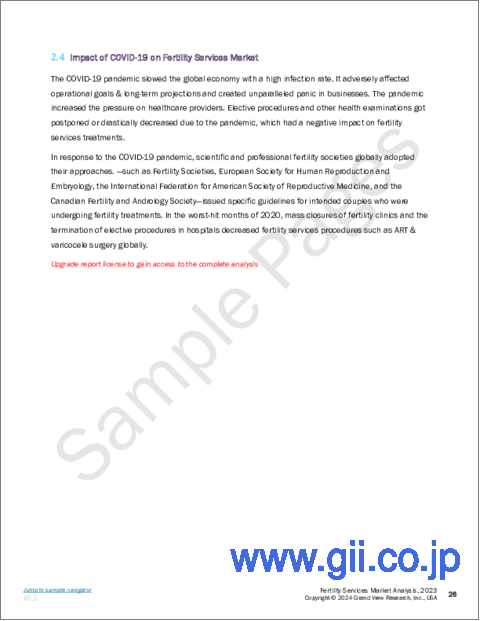
- COVID-19の影響分析
第4章 タイプ別ビジネス分析
- 不妊治療サービス市場:タイプ変動分析
- 不妊治療サービス市場:タイプ別セグメントダッシュボード
- タイプ動向と市場シェア分析、2023年と2030年
- タイプ別
- 診断
- 男性不妊
- 女性不妊
- 治療
- 体外受精(IVF)
- 人工授精
- 保存
- 卵子と胚の凍結
- 精子バンク
第5章 プロバイダー別ビジネス分析
- 不妊治療サービス市場:プロバイダー変動分析
- 不妊治療サービス市場:プロバイダー別セグメントダッシュボード
- プロバイダー動向と市場シェア分析、2023年と2030年
- プロバイダー別
- 不妊治療クリニック
- 病院等
第6章 地域別ビジネス分析
- 地域別市場シェア分析、2023年および2030年
- 地域市場ダッシュボード
- 世界地域市場スナップショット
- 市場規模、予測動向分析、2018年から2030年:
- 北米
- 北米不妊治療サービス市場、2018年-2030年
- 米国
- カナダ
- メキシコ
- 欧州
- 欧州の不妊治療サービス市場、2018年-2030年
- 英国
- ドイツ
- フランス
- イタリア
- スペイン
- スウェーデン
- ノルウェー
- デンマーク
- アジア太平洋地域
- アジア太平洋地域の不妊治療サービス市場、2018年-2030年
- 日本
- 中国
- インド
- オーストラリア
- タイ
- 韓国
- ラテンアメリカ
- ラテンアメリカの不妊治療サービス市場、2018年-2030年
- ブラジル
- アルゼンチン
- 中東・アフリカ
- 中東・アフリカ不妊治療サービス市場、2018-2030年
- 南アフリカ
- サウジアラビア
- アラブ首長国連邦
- クウェート
第7章 競合情勢
- 企業分類
- 企業の市況分析
- 戦略マッピング
- 拡大
- 取得
- コラボレーション
- その他
- 企業プロファイル/上場企業
- PFCLA
- Mayo Foundation for Medical Education and Research(MFMER)
- Cleveland Clinic
- Apricity Fertility UK Limited
- King's Fertility Limited
- Dallas IVF
- Midwest Fertility Specialists
- Europe IVF
- Care Fertility
- Aspire Fertility
- Virtus Health
- Monash IVF Group
List of Tables
- Table 1 List of secondary sources
- Table 2 List of abbreviations
- Table 3 Global fertility services market, by type, 2018 - 2030 (USD Million)
- Table 4 Global fertility services market, by region, 2018 - 2030 (USD Million)
- Table 5 North America fertility services market, by country, 2018 - 2030 (USD Million)
- Table 6 North America fertility services market, by type, 2018 - 2030 (USD Million)
- Table 7 North America fertility services market, by provider, 2018 - 2030 (USD Million)
- Table 8 U.S. fertility services market, by type, 2018 - 2030 (USD Million)
- Table 9 U.S. ertility services market, by provider, 2018 - 2030 (USD Million)
- Table 10 Canada fertility services market, by type, 2018 - 2030 (USD Million)
- Table 11 Canada fertility services market, by provider, 2018 - 2030 (USD Million)
- Table 12 Europe fertility services market, by country, 2018 - 2030 (USD Million)
- Table 13 Europe fertility services market, by type, 2018 - 2030 (USD Million)
- Table 14 Europe fertility services market, by provider, 2018 - 2030 (USD Million)
- Table 15 UKfertility services market, by type, 2018 - 2030 (USD Million)
- Table 16 UKfertility services market, by provider, 2018 - 2030 (USD Million)
- Table 17 Germany fertility services market, by type, 2018 - 2030 (USD Million)
- Table 18 Germany fertility services market, by provider, 2018 - 2030 (USD Million)
- Table 19 France fertility services market, by type, 2018 - 2030 (USD Million)
- Table 20 France fertility services market, by provider, 2018 - 2030 (USD Million)
- Table 21 Italy fertility services market, by type, 2018 - 2030 (USD Million)
- Table 22 Italy fertility services market, by provider, 2018 - 2030 (USD Million)
- Table 23 Spain fertility services market, by type, 2018 - 2030 (USD Million)
- Table 24 Spain fertility services market, by provider, 2018 - 2030 (USD Million)
- Table 25 Sweden fertility services market, by type, 2018 - 2030 (USD Million)
- Table 26 Sweden fertility services market, by provider, 2018 - 2030 (USD Million)
- Table 27 Norway fertility services market, by type, 2018 - 2030 (USD Million)
- Table 28 Norway fertility services market, by provider, 2018 - 2030 (USD Million)
- Table 29 Denmark fertility services market, by type, 2018 - 2030 (USD Million)
- Table 30 Denmark fertility services market, by provider, 2018 - 2030 (USD Million)
- Table 31 Asia Pacific fertility services market, by country, 2018 - 2030 (USD Million)
- Table 32 Asia Pacific speech fertility services market, by type, 2018 - 2030 (USD Million)
- Table 33 Asia Pacific speech fertility services market, by provider, 2018 - 2030 (USD Million)
- Table 34 Japan fertility services market, by type, 2018 - 2030 (USD Million)
- Table 35 Japan fertility services market, by provider, 2018 - 2030 (USD Million)
- Table 36 China fertility services market, by type, 2018 - 2030 (USD Million)
- Table 37 China fertility services market, by provider, 2018 - 2030 (USD Million)
- Table 38 India fertility services market, by type, 2018 - 2030 (USD Million)
- Table 39 India fertility services market, by provider, 2018 - 2030 (USD Million)
- Table 40 Australia fertility services market, by type, 2018 - 2030 (USD Million)
- Table 41 Australia fertility services market, by provider, 2018 - 2030 (USD Million)
- Table 42 Thailand fertility services market, by type, 2018 - 2030 (USD Million)
- Table 43 Thailand fertility services market, by provider, 2018 - 2030 (USD Million)
- Table 44 South Korea fertility services market, by type, 2018 - 2030 (USD Million)
- Table 45 Latin America fertility services market, by country, 2018 - 2030 (USD Million)
- Table 46 Latin America fertility services market, by type, 2018 - 2030 (USD Million)
- Table 47 Latin America fertility services market, by provider, 2018 - 2030 (USD Million)
- Table 48 Brazil fertility services market, by type, 2018 - 2030 (USD Million)
- Table 49 Brazil fertility services market, by provider, 2018 - 2030 (USD Million)
- Table 50 Mexico fertility services market, by type, 2018 - 2030 (USD Million)
- Table 51 Mexico fertility services market, by provider, 2018 - 2030 (USD Million)
- Table 52 Argentina fertility services market, by type, 2018 - 2030 (USD Million)
- Table 53 Argentina fertility services market, by provider, 2018 - 2030 (USD Million)
- Table 54 Middle East & Africa fertility services market, by country, 2018 - 2030 (USD Million)
- Table 55 Middle East & Africa fertility services market, by type, 2018 - 2030 (USD Million)
- Table 56 Middle East & Africa fertility services market, by provider, 2018 - 2030 (USD Million)
- Table 57 South Africa fertility services market, by type, 2018 - 2030 (USD Million)
- Table 58 South Africa fertility services market, by provider, 2018 - 2030 (USD Million)
- Table 59 Saudi Arabia fertility services market, by type, 2018 - 2030 (USD Million)
- Table 60 Saudi Arabia fertility services market, by provider, 2018 - 2030 (USD Million)
- Table 61 UAE fertility services market, by type, 2018 - 2030 (USD Million)
- Table 62 UAE fertility services market, by provider, 2018 - 2030 (USD Million)
- Table 63 Kuwait fertility services market, by type, 2018 - 2030 (USD Million)
- Table 64 Kuwait fertility services market, by provider, 2018 - 2030 (USD Million)
List of Figures
- Fig. 1 Market research process
- Fig. 2 Fertility services market segmentation
- Fig. 3 Market research process
- Fig. 4 Data triangulation techniques
- Fig. 5 Primary research pattern
- Fig. 6 Market research approaches
- Fig. 7 Value-chain-based sizing & forecasting
- Fig. 8 QFD modelling for market share assessment
- Fig. 9 Market formulation & validation
- Fig. 10 Market snapshot
- Fig. 11 Market segmentation
- Fig. 12 Market segmentation
- Fig. 13 Competitive landscape
- Fig. 14 Global fertility services market lineage outlook
- Fig. 15 Fertility services market dynamics
- Fig. 16 Market driver relevance analysis (Current & future impact)
- Fig. 17 Market restraint relevance analysis (Current & future impact)
- Fig. 18 Supply chain analysis: Fertility Services market
- Fig. 19 Fertility services market: Porter's five forces analysis
- Fig. 20 Fertility services market: PESTLE analysis
- Fig. 21 Fertility services market type outlook: Segment dashboard)
- Fig. 22 Fertility services market: type movement & market share analysis, 2023 & 2030
- Fig. 23 Diagnosis market, 2018 - 2030 (USD Million)
- Fig. 24 Treatment market, 2018 - 2030 (USD Million)
- Fig. 25 Preservation market, 2018 - 2030 (USD Million)
- Fig. 26 Male infertility market, 2018 - 2030 (USD Million)
- Fig. 27 Female infertility market, 2018 - 2030 (USD Million)
- Fig. 28 DNA fragmentation technique market, 2018 - 2030 (USD Million)
- Fig. 29 Oxidative stress analysis market, 2018 - 2030 (USD Million)
- Fig. 30 Microscopic examination market, 2018 - 2030 (USD Million)
- Fig. 31 Sperm agglutination market, 2018 - 2030 (USD Million)
- Fig. 32 Computer assisted semen analysis market, 2018 - 2030 (USD Million)
- Fig. 33 Sperm penetration assay market, 2018 - 2030 (USD Million)
- Fig. 34 Others market, 2018 - 2030 (USD Million)
- Fig. 35 Ovarian reserve testing market, 2018 - 2030 (USD Million)
- Fig. 36 Hysterosalpingography market, 2018 - 2030 (USD Million)
- Fig. 37 Hormone testing market, 2018 - 2030 (USD Million)
- Fig. 38 Other tests market, 2018 - 2030 (USD Million)
- Fig. 39 In-Vitro Fertilization (IVF) market, 2018 - 2030 (USD Million)
- Fig. 40 Artificial insemination market, 2018 - 2030 (USD Million)
- Fig. 41 Egg & embryo freezing market, 2018 - 2030 (USD Million)
- Fig. 42 Sperm banking market, 2018 - 2030 (USD Million)
- Fig. 43 Fertility services market provider outlook: Segment dashboard)
- Fig. 44 Fertility services market: provider movement & market share analysis, 2023 & 2030
- Fig. 45 Fertility clinics market, 2018 - 2030 (USD Million)
- Fig. 46 Hospitals and others market, 2018 - 2030 (USD Million)
- Fig. 47 Regional marketplace: Key takeaways
- Fig. 48 Regional key marketplace takeaway
- Fig. 49 Regional key marketplace takeaway
- Fig. 50 Regional key marketplace takeaway
- Fig. 51 North America fertility services market, 2018 - 2030 (USD Million)
- Fig. 52 US key country dynamics
- Fig. 53 US fertility services market, 2018 - 2030 (USD Million)
- Fig. 54 Canada key country dynamics
- Fig. 55 Canada fertility services market, 2018 - 2030 (USD Million)
- Fig. 56 Europe fertility services market, 2017 - 2030 (USD Million)
- Fig. 57 UK key country dynamic
- Fig. 58 UK fertility services market, 2018 - 2030 (USD Million)
- Fig. 59 Germany key country dynamic
- Fig. 60 Germany fertility services market, 2018 - 2030 (USD Million)
- Fig. 61 France key country dynamic
- Fig. 62 France fertility services market, 2018 - 2030 (USD Million)
- Fig. 63 Italy key country dynamic
- Fig. 64 Italy fertility services market, 2018 - 2030 (USD Million)
- Fig. 65 Spain key country dynamic
- Fig. 66 Spain fertility services market, 2018 - 2030 (USD Million)
- Fig. 67 Denmark key country dynamic
- Fig. 68 Denmark fertility services market, 2018 - 2030 (USD Million)
- Fig. 69 Sweden key country dynamic
- Fig. 70 Sweden fertility services market, 2018 - 2030 (USD Million)
- Fig. 71 Norway key country dynamic
- Fig. 72 Norway fertility services market, 2018 - 2030 (USD Million)
- Fig. 73 Asia Pacific fertility services market, 2018 - 2030 (USD Million)
- Fig. 74 China key country dynamic
- Fig. 75 China fertility services market, 2018 - 2030 (USD Million)
- Fig. 76 Japan key country dynamic
- Fig. 77 Japan fertility services market, 2018 - 2030 (USD Million)
- Fig. 78 India key country dynamic
- Fig. 79 India fertility services market, 2018 - 2030 (USD Million)
- Fig. 80 South Korea key country dynamic
- Fig. 81 South Korea fertility services market, 2018 - 2030 (USD Million)
- Fig. 82 Australia key country dynamic
- Fig. 83 Australia fertility services market, 2018 - 2030 (USD Million)
- Fig. 84 Thailand key country dynamic
- Fig. 85 Thailand fertility services market, 2018 - 2030 (USD Million)
- Fig. 86 Latin America fertility services market, 2018 - 2030 (USD Million)
- Fig. 87 Brazil key country dynamic
- Fig. 88 Brazil fertility services market, 2018 - 2030 (USD Million)
- Fig. 89 Mexico key country dynamic
- Fig. 90 Mexico fertility services market, 2018 - 2030 (USD Million)
- Fig. 91 Argentina key country dynamic
- Fig. 92 Argentina fertility services market, 2018 - 2030 (USD Million)
- Fig. 93 MEA fertility services market, 2018 - 2030 (USD Million)
- Fig. 94 South Africa key country dynamic
- Fig. 95 South Africa fertility services market, 2018 - 2030 (USD Million)
- Fig. 96 Saudi Arabia key country dynamic
- Fig. 97 Saudi Arabia fertility services market, 2018 - 2030 (USD Million)
- Fig. 98 UAE key country dynamic
- Fig. 99 UAE fertility services market, 2018 - 2030 (USD Million)
- Fig. 100 Kuwait key country dynamic
- Fig. 101 Kuwait fertility services market, 2018 - 2030 (USD Million)
- Fig. 102 Company categorization
- Fig. 103 Company market position analysis
- Fig. 104 Strategic framework
Fertility Services Market Growth & Trends:
The global fertility services market is anticipated to reach USD 70.27 billion by 2030 and is projected to grow at a CAGR of 7.50% from 2024 to 2030, according to a new report by Grand View Research, Inc. The rising adoption of fertility services, especially among individuals facing issues such as old age, premature ovarian failure, and rising infertility in male and female, is a major driver propelling market growth.
IVF services are particularly popular among individuals aged between 35 and 39 years, driving demand for fertility services. Furthermore, the global fertility rate is falling steadily due to several issues, including the growing trend of delayed marriages and the increasing incidence of age-related infertility. According to the UN's World Family Planning 2022 report, the global fertility rate decreased from 3.3 children per woman in 1990 to 2.3 in 2021. This decreasing fertility rate has significantly increased the demand for male and female ART. In addition, supportive government funding for expensive ART procedures is expected to drive market growth.
In India, the government offers incentives, such as low-interest loans to establish hospitals, subsidies to buy medicines & equipment, and buying lands for clinics. To capitalize on low costs, the Indian government issues M (medical) visas to foreign tourists and MX visas for spouses, valid for a year. For instance, in May 2022, in Australia, under NSW Government 2022-2023 budget, women in New South Wales opting for IVF will be provided with a USD 2,000 cash rebate to reduce the treatment costs for patients. The demand for frozen nondonor IVF treatment is projected to increase significantly. This can be attributed to the large number of procedures performed using frozen nondonor (patient's eggs).
Fertility Services Market Report Highlights:
- Based on type, the treatment segment held the market with the largest revenue share of 65.33% in 2023. The treatment segment is further segmented into In-vitro fertilization (IVF) and artificial insemination. In 2023, IVF treatment dominated the market growth
- Improved outcomes of infertility treatments has led to positive awareness regarding fertility services. Favorable reimbursement policies, increasing disposable income, and availability of fertility treatments are also driving growth
- Based on provider, the fertility clinics segment held market with the largest revenue share of 80.02% in 2023, owing to the advancements in fertility clinics and the adoption of new technologies
- Europe dominated the market with the revenue share of 35.74% in 2023, due to increased investments from private equity investors in the European market, providing lucrative opportunities for market growth
- In May 2023, Genea Biomedx partnered with AIVF to offer an integrated solution for personalized and optimized IVF care
- In October 2022, the startup Alife launched AI technology to advance IVF treatment outcomes and lower costs
Table of Contents
Chapter 1. Methodology and Scope
- 1.1. Market Segmentation & Scope
- 1.1.1. Market Definitions
- 1.2. Regional Scope
- 1.3. Estimates and Forecast Timeline
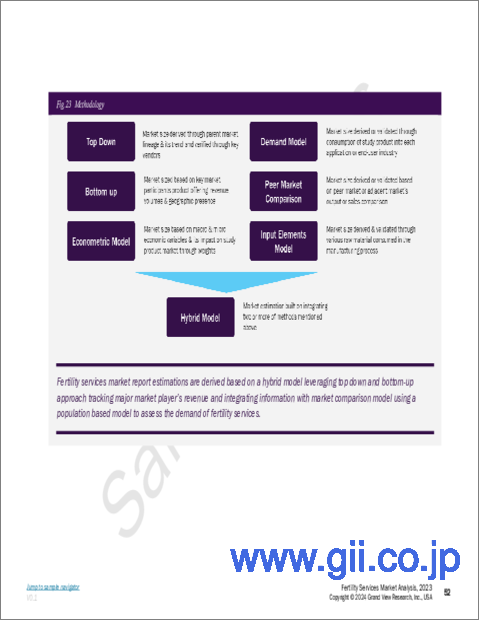
- 1.4. Research Methodology
- 1.5. Information Procurement
- 1.5.1. Purchased Database
- 1.5.2. GVR's Internal Database
- 1.5.3. Secondary Sources & Third-Party Perspectives
- 1.5.4. Primary Research
- 1.6. Information Analysis
- 1.6.1. Data Analysis Models
- 1.7. Market Formulation & Data Visualization
- 1.8. Model Details
- 1.8.1. Volume Price Analysis
- 1.9. List of Secondary Sources
- 1.10. Objectives
Chapter 2. Executive Summary
- 2.1. Market Snapshot
- 2.2. Segment Snapshot
- 2.2.1. Type Outlook
- 2.2.2. Provider Outlook
- 2.3. Competitive Landscape Snapshot
Chapter 3. Market Variables, Trends, & Scope
- 3.1. Market Lineage Outlook
- 3.1.1. Related/Ancillary Market Outlook
- 3.2. Market Trends and Outlook
- 3.3. Market Dynamics
- 3.3.1. Market Driver Analysis
- 3.3.2. Market Restraint Analysis
- 3.3.3. Industry Opportunities
- 3.3.4. Industry Challenges
- 3.4. Business Environment Analysis
- 3.4.1. Industry Analysis - Porter's Five Forces Analysis
- 3.4.1.1. Supplier power
- 3.4.1.2. Buyer power
- 3.4.1.3. Substitution threat
- 3.4.1.4. Threat of new entrant
- 3.4.1.5. Competitive rivalry
- 3.4.2. PESTEL Analysis
- 3.4.1. Industry Analysis - Porter's Five Forces Analysis
- 3.5. COVID-19 Impact Analysis
Chapter 4. Type Business Analysis
- 4.1. Fertility Services Market: Type Movement Analysis
- 4.2. Fertility Services Type Market: Segment Dashboard
- 4.3. Type Movement & Market Share Analysis, 2023 & 2030
- 4.4. Global Fertility Services Market Estimates & Forecast, by Type
- 4.5. Diagnosis
- 4.5.1. Diagnosis market, 2018 - 2030 (USD Million)
- 4.5.2. Male infertility
- 4.5.2.1. Male Infertility market, 2018 - 2030 (USD Million)
- 4.5.2.2. DNA fragmentation technique
- 4.5.2.2.1. DNA fragmentation technique market, 2018 - 2030 (USD Million)
- 4.5.2.3. Oxidative stress analysis
- 4.5.2.3.1. Oxidative stress analysis market, 2018 - 2030 (USD Million)
- 4.5.2.4. Microscopic examination
- 4.5.2.4.1. Microscopic examination market, 2018 - 2030 (USD Million)
- 4.5.2.5. Sperm agglutination
- 4.5.2.5.1. Sperm agglutination market, 2018 - 2030 (USD Million)
- 4.5.2.6. Computer assisted semen analysis.
- 4.5.2.6.1. Computer assisted semen analysis market, 2018 - 2030 (USD Million)
- 4.5.2.7. Sperm penetration assay
- 4.5.2.7.1. Sperm penetration assay market, 2018 - 2030 (USD Million)
- 4.5.2.8. Others
- 4.5.2.8.1. Others market, 2018 - 2030 (USD Million)
- 4.5.3. Female infertility
- 4.5.3.1. Female infertility market, 2018 - 2030 (USD Million)
- 4.5.3.2. Ovarian reserve testing
- 4.5.3.2.1. Ovarian reserve testing market, 2018 - 2030 (USD Million)
- 4.5.3.3. Hysterosalpingography
- 4.5.3.3.1. Hysterosalpingography market, 2018 - 2030 (USD Million)
- 4.5.3.4. Hormone testing
- 4.5.3.4.1. Hormone testing market, 2018 - 2030 (USD Million)
- 4.5.3.5. Other tests
- 4.5.3.5.1. Other tests market, 2018 - 2030 (USD Million)
- 4.6. Treatment
- 4.6.1. Treatment market, 2018 - 2030 (USD Million)
- 4.6.2. In-Vitro Fertilization (IVF)
- 4.6.2.1. In-Vitro Fertilization (IVF) market, 2018 - 2030 (USD Million)
- 4.6.3. Artificial insemination
- 4.6.3.1. Artificial insemination market, 2018 - 2030 (USD Million)
- 4.7. Preservation
- 4.7.1. Preservation market, 2018 - 2030 (USD Million)
- 4.7.2. Egg & embryo freezing
- 4.7.2.1. Egg & embryo freezing market, 2018 - 2030 (USD Million)
- 4.7.3. Sperm banking
- 4.7.3.1. Sperm banking market, 2018 - 2030 (USD Million)
Chapter 5. Provider Business Analysis
- 5.1. Fertility Services Market: Provider Movement Analysis
- 5.2. Fertility Services Provider Market: Segment Dashboard
- 5.3. Provider Movement & Market Share Analysis, 2023 & 2030
- 5.4. Global Fertility Services Market Estimates & Forecast, by Provider
- 5.5. Fertility Clinics
- 5.5.1. Fertility clinics market, 2018 - 2030 (USD Million)
- 5.6. Hospitals and Others
- 5.6.1. Hospitals and others market, 2018 - 2030 (USD Million)
Chapter 6. Regional Business Analysis
- 6.1. Regional Market Share Analysis, 2023 & 2030
- 6.2. Regional Market Dashboard
- 6.3. Global Regional Market Snapshot
- 6.4. Market Size, & Forecasts Trend Analysis, 2018 to 2030:
- 6.5. North America
- 6.5.1. North America Fertility Services Market, 2018 - 2030 (USD Billion)
- 6.5.2. U.S.
- 6.5.2.1. Key country dynamics
- 6.5.2.2. Regulatory framework
- 6.5.2.3. Reimbursement scenario
- 6.5.2.4. Competitive scenario
- 6.5.2.5. U.S. fertility services market, 2018 - 2030 (USD Million)
- 6.5.3. Canada
- 6.5.3.1. Key country dynamics
- 6.5.3.2. Regulatory framework
- 6.5.3.3. Reimbursement scenario
- 6.5.3.4. Competitive scenario
- 6.5.3.5. Canada fertility services market, 2018 - 2030 (USD Million)
- 6.5.4. Mexico
- 6.5.4.1. Key country dynamics
- 6.5.4.2. Regulatory framework
- 6.5.4.3. Reimbursement scenario
- 6.5.4.4. Competitive scenario
- 6.5.4.5. Mexico fertility services market, 2018 - 2030 (USD Million)
- 6.6. Europe
- 6.6.1. Europe Fertility Services Market, 2018 - 2030 (USD Million)
- 6.6.2. UK
- 6.6.2.1. Key country dynamics
- 6.6.2.2. Regulatory framework
- 6.6.2.3. Reimbursement scenario
- 6.6.2.4. Competitive scenario
- 6.6.2.5. UK fertility services market, 2018 - 2030 (USD Million)
- 6.6.3. Germany
- 6.6.3.1. Key country dynamics
- 6.6.3.2. Regulatory framework
- 6.6.3.3. Reimbursement scenario
- 6.6.3.4. Competitive scenario
- 6.6.3.5. Germany fertility services market, 2018 - 2030 (USD Million)
- 6.6.4. France
- 6.6.4.1. Key country dynamics
- 6.6.4.2. Regulatory framework
- 6.6.4.3. Reimbursement scenario
- 6.6.4.4. Competitive scenario
- 6.6.4.5. France fertility services market, 2018 - 2030 (USD Million)
- 6.6.5. Italy
- 6.6.5.1. Key country dynamics
- 6.6.5.2. Regulatory framework
- 6.6.5.3. Reimbursement scenario
- 6.6.5.4. Competitive scenario
- 6.6.5.5. Italy fertility services market, 2018 - 2030 (USD Million)
- 6.6.6. Spain
- 6.6.6.1. Key country dynamics
- 6.6.6.2. Regulatory framework
- 6.6.6.3. Reimbursement scenario
- 6.6.6.4. Competitive scenario
- 6.6.6.5. Spain fertility services market, 2018 - 2030 (USD Million)
- 6.6.7. Sweden
- 6.6.7.1. Key country dynamics
- 6.6.7.2. Regulatory framework
- 6.6.7.3. Reimbursement scenario
- 6.6.7.4. Competitive scenario
- 6.6.7.5. Sweden fertility services market, 2018 - 2030 (USD Million)
- 6.6.8. Norway
- 6.6.8.1. Key country dynamics
- 6.6.8.2. Regulatory framework
- 6.6.8.3. Reimbursement scenario
- 6.6.8.4. Competitive scenario
- 6.6.8.5. Norway fertility services market, 2018 - 2030 (USD Million)
- 6.6.9. Denmark
- 6.6.9.1. Key country dynamics
- 6.6.9.2. Regulatory framework
- 6.6.9.3. Reimbursement scenario
- 6.6.9.4. Competitive scenario
- 6.6.9.5. Denmark fertility services market, 2018 - 2030 (USD Million)
- 6.7. Asia Pacific
- 6.7.1. Asia Pacific Fertility Services Market, 2018 - 2030 (USD Billion)
- 6.7.2. Japan
- 6.7.2.1. Key country dynamics
- 6.7.2.2. Regulatory framework
- 6.7.2.3. Reimbursement scenario
- 6.7.2.4. Competitive scenario
- 6.7.2.5. Japan fertility services market, 2018 - 2030 (USD Million)
- 6.7.3. China
- 6.7.3.1. Key country dynamics
- 6.7.3.2. Regulatory framework
- 6.7.3.3. Reimbursement scenario
- 6.7.3.4. Competitive scenario
- 6.7.3.5. China fertility services market, 2018 - 2030 (USD Million)
- 6.7.4. India
- 6.7.4.1. Key country dynamics
- 6.7.4.2. Regulatory framework
- 6.7.4.3. Reimbursement scenario
- 6.7.4.4. Competitive scenario
- 6.7.4.5. India fertility services market, 2018 - 2030 (USD Million)
- 6.7.5. Australia
- 6.7.5.1. Key country dynamics
- 6.7.5.2. Regulatory framework
- 6.7.5.3. Reimbursement scenario
- 6.7.5.4. Competitive scenario
- 6.7.5.5. Australia fertility services market, 2018 - 2030 (USD Million)
- 6.7.6. Thailand
- 6.7.6.1. Key country dynamics
- 6.7.6.2. Regulatory framework
- 6.7.6.3. Reimbursement scenario
- 6.7.6.4. Competitive scenario
- 6.7.6.5. Thailand fertility services market, 2018 - 2030 (USD Million)
- 6.7.7. South Korea
- 6.7.7.1. Key country dynamics
- 6.7.7.2. Regulatory framework
- 6.7.7.3. Reimbursement scenario
- 6.7.7.4. Competitive scenario
- 6.7.7.5. South Korea fertility services market, 2018 - 2030 (USD Million)
- 6.8. Latin America
- 6.8.1. Latin America Fertility Services Market, 2018 - 2030 (USD Billion)
- 6.8.2. Brazil
- 6.8.2.1. Key country dynamics
- 6.8.2.2. Regulatory framework
- 6.8.2.3. Reimbursement scenario
- 6.8.2.4. Competitive scenario
- 6.8.2.5. Brazil fertility services market, 2018 - 2030 (USD Million)
- 6.8.3. Argentina
- 6.8.3.1. Key country dynamics
- 6.8.3.2. Regulatory framework
- 6.8.3.3. Reimbursement scenario
- 6.8.3.4. Competitive scenario
- 6.8.3.5. Argentina fertility services market, 2018 - 2030 (USD Million)
- 6.9. MEA
- 6.9.1. MEA Fertility Services Market, 2018 - 2030 (USD Billion)
- 6.9.2. South Africa
- 6.9.2.1. Key country dynamics
- 6.9.2.2. Regulatory framework
- 6.9.2.3. Reimbursement scenario
- 6.9.2.4. Competitive scenario
- 6.9.2.5. South Africa fertility services market, 2018 - 2030 (USD Million)
- 6.9.3. Saudi Arabia
- 6.9.3.1. Key country dynamics
- 6.9.3.2. Regulatory framework
- 6.9.3.3. Reimbursement scenario
- 6.9.3.4. Competitive scenario
- 6.9.3.5. Saudi Arabia fertility services market, 2018 - 2030 (USD Million)
- 6.9.4. UAE
- 6.9.4.1. Key country dynamics
- 6.9.4.2. Regulatory framework
- 6.9.4.3. Reimbursement scenario
- 6.9.4.4. Competitive scenario
- 6.9.4.5. UAE fertility services market, 2018 - 2030 (USD Million)
- 6.9.5. Kuwait
- 6.9.5.1. Key country dynamics
- 6.9.5.2. Regulatory framework
- 6.9.5.3. Reimbursement scenario
- 6.9.5.4. Competitive scenario
- 6.9.5.5. Kuwait fertility services market, 2018 - 2030 (USD Million)
Chapter 7. Competitive Landscape
- 7.1. Company Categorization
- 7.2. Company Market Position Analysis
- 7.3. Strategy Mapping
- 7.3.1. Expansion
- 7.3.2. Acquisition
- 7.3.3. Collaborations
- 7.3.4. Others
- 7.4. Company Profiles/Listing
- 7.4.1. PFCLA
- 7.4.1.1. Overview
- 7.4.1.2. Financial Performance
- 7.4.1.3. Service Benchmarking
- 7.4.1.4. Strategic Initiatives
- 7.4.2. Mayo Foundation for Medical Education and Research (MFMER)
- 7.4.2.1. Overview
- 7.4.2.2. Financial Performance
- 7.4.2.3. Service Benchmarking
- 7.4.2.4. Strategic Initiatives
- 7.4.3. Cleveland Clinic
- 7.4.3.1. Overview
- 7.4.3.2. Financial Performance
- 7.4.3.3. Service Benchmarking
- 7.4.3.4. Strategic Initiatives
- 7.4.4. Apricity Fertility UK Limited
- 7.4.4.1. Overview
- 7.4.4.2. Financial Performance
- 7.4.4.3. Service Benchmarking
- 7.4.4.4. Strategic Initiatives
- 7.4.5. King's Fertility Limited
- 7.4.5.1. Overview
- 7.4.5.2. Financial Performance
- 7.4.5.3. Service Benchmarking
- 7.4.5.4. Strategic Initiatives
- 7.4.6. Dallas IVF
- 7.4.6.1. Overview
- 7.4.6.2. Financial Performance
- 7.4.6.3. Service Benchmarking
- 7.4.6.4. Strategic Initiatives
- 7.4.7. Midwest Fertility Specialists
- 7.4.7.1. Overview
- 7.4.7.2. Financial Performance
- 7.4.7.3. Service Benchmarking
- 7.4.7.4. Strategic Initiatives
- 7.4.8. Europe IVF
- 7.4.8.1. Overview
- 7.4.8.2. Financial Performance
- 7.4.8.3. Service Benchmarking
- 7.4.8.4. Strategic Initiatives
- 7.4.9. Care Fertility
- 7.4.9.1. Overview
- 7.4.9.2. Financial Performance
- 7.4.9.3. Service Benchmarking
- 7.4.9.4. Strategic Initiatives
- 7.4.10. Aspire Fertility
- 7.4.10.1. Overview
- 7.4.10.2. Financial Performance
- 7.4.10.3. Service Benchmarking
- 7.4.10.4. Strategic Initiatives
- 7.4.11. Virtus Health
- 7.4.11.1. Overview
- 7.4.11.2. Financial Performance
- 7.4.11.3. Service Benchmarking
- 7.4.11.4. Strategic Initiatives
- 7.4.12. Monash IVF Group
- 7.4.12.1. Overview
- 7.4.12.2. Financial Performance
- 7.4.12.3. Service Benchmarking
- 7.4.12.4. Strategic Initiatives
- 7.4.1. PFCLA

