|
|
市場調査レポート
商品コード
1511791
膵外分泌機能不全診断の市場規模、シェア、動向分析レポート:診断方法別、最終用途別、地域別、セグメント予測、2024年~2030年Exocrine Pancreatic Insufficiency Diagnostics Market Size, Share & Trends Analysis Report By Diagnostic Method (Laboratory, Imaging), By End-use (Hospitals & Clinics, Research Institutes), By Region, And Segment Forecasts, 2024 - 2030 |
||||||
|
|||||||
カスタマイズ可能
|
|||||||

| 膵外分泌機能不全診断の市場規模、シェア、動向分析レポート:診断方法別、最終用途別、地域別、セグメント予測、2024年~2030年 |
|
出版日: 2024年06月03日
発行: Grand View Research
ページ情報: 英文 125 Pages
納期: 2~10営業日
|

全表示
- 概要
- 図表
- 目次
膵外分泌機能不全診断市場の成長と動向:
Grand View Research, Inc.の最新レポートによると、世界の膵外分泌機能不全診断市場規模は2030年までに54億4,000万米ドルに達すると予測され、2024年から2030年までのCAGRは7.2%で成長しています。
外分泌膵不全(EPI)診断は、特に様々な患者集団におけるその高い有病率と、いくつかの根本的な原因との関連性を考慮すると、この疾患の特定と管理に極めて重要です。診断の主な促進要因の一つは、慢性膵炎患者の有病率です。研究によると、慢性膵炎と診断された患者の約60%から90%において、診断から10年から12年以内にEPIが蔓延しています。慢性膵炎はEPIの重要な原因であり、その比較的高い有病率は早期発見と管理の重要性を強調しています。
さらに、進行膵がんも本疾患と強く関連する疾患の一つです。調査によると、進行膵がん患者の66%から92%がEPIを発症しています。このような患者においてEPIを早期に診断することは、症状の管理を改善し、生活の質を改善することにつながります。炎症性腸疾患(IBD)もEPIと関連しており、IBD患者の14%から74%がEPIに罹患する可能性があることが研究で示唆されています。このような患者において膵外分泌機能不全を適時に診断し治療することは、症状を緩和し栄養状態を改善するのに役立ちます。
さらに、肥満手術を受ける患者は、酵素および栄養補助食品を摂取しているにもかかわらず、EPIを発症するリスクがあります。このことは、この患者集団における膵外分泌機能不全を同定するための継続的なモニタリングと診断検査の重要性を強調しています。さらに、HIV/AIDS患者におけるEPIの有病率は26%~45%と推定されています。これらの患者における膵外分泌機能不全の早期発見は、栄養状態および全体的な健康転帰を最適化するために不可欠です。
膵外分泌機能不全に関連する病態は多岐にわたるため、包括的な診断アプローチの必要性が強調されています。膵外分泌機能不全診断薬に対する需要を促進する要因としては、様々な患者集団における高い有病率、慢性膵炎や膵がんなどの慢性疾患との関連、効果的な管理と患者の転帰改善のための早期発見の重要性などが挙げられます。診断技術が進歩すれば、早期発見と個別化管理がますます可能になり、患者のケアと転帰の改善につながります。
ChiRhoClin, Inc.、Certest Biotec、ScheBo Biotech AG、Immundiagnostik AG、Laboratory Corporation of America Holdingsなどの主要な市場参入企業は、膵外分泌機能不全診断における技術革新の最前線にいます。これらの企業は常に製品の拡充に注力しています。例えば、2021年6月、CERTEST BIOTECは、8月4日から8日までカリフォルニアで開催される第71回AACC年次学術総会および臨床検査室展示会に参加し、最新の開発品を展示すると発表しました。
膵外分泌機能不全診断市場レポートハイライト
- 診断方法に基づくと、ラボ検査分野が2023年に最も高い収益シェアで市場全体を支配しました。これは、検査室における自動化、使い捨てキット、サンプル採取&保管、アッセイなどの広範な進歩に起因します。
- EPI診断における研究開発の拡大は、予測期間中の市場成長を促進すると予測されます。
- 新しい技術やアッセイのイントロダクション、確立された技術の統合は、診断における重要な前進を意味します。診断技術の進歩に後押しされ、膵疾患に対する認識が高まり続けていることから、米国のEPI診断における便検査市場は、今後数年間で継続的な拡大が見込まれます。
- 病院・診療所の最終用途セグメントは、いくつかの要因によって2023年の市場を独占しました。症状やリスク要因に関するヘルスケア専門家や患者の意識の高まりが、こうした環境での診断率の上昇につながっています。病院や診療所における診断サービスの利用しやすさは、外分泌型膵不全のスクリーニングや検査を広く普及させ、診断技術の進歩はEPI検出の精度と効率を高め、このセグメントの成長をさらに促進します。
- 北米は、高度なヘルスケアインフラ、対象疾患の有病率の上昇、良好な規制環境などの要因により、市場を独占しています。
目次
第1章 調査手法と範囲
第2章 エグゼクティブサマリー
第3章 膵外分泌機能不全診断市場の変数、動向、範囲
- 市場系統の見通し
- 親市場の見通し
- 関連/付随市場の見通し
- 市場力学
- 市場 促進要因分析
- 市場抑制要因分析
- 膵外分泌機能不全診断市場分析ツール
- 業界分析- ポーターのファイブフォース分析
- PESTEL分析
- 価格分析
- 数量分析(ラボベースの試験装置)
第4章 膵外分泌機能不全診断市場:診断方法の推定・動向分析
- セグメントダッシュボード
- 世界の膵外分泌機能不全診断市場の変動分析
- 診断方法別:世界の膵外分泌機能不全診断市場展望
- 臨床検査
- 画像検査
第5章 膵外分泌機能不全診断市場:最終用途の推定・動向分析
- セグメントダッシュボード
- 世界の膵外分泌機能不全診断市場の変動分析
- 最終用途別展望別:世界の膵外分泌機能不全診断市場
- 病院・クリニック
- 診断ラボ
- 研究機関
第6章 膵外分泌機能不全診断市場:診断方法と最終用途別の地域推定・動向分析
- 地域ダッシュボード
- 市場規模、予測動向分析、2018年から2030年:
- 北米
- 欧州
- アジア太平洋地域
- ラテンアメリカ
- 中東・アフリカ
第7章 競合情勢
- 主要市場参入企業による最近の動向と影響分析
- 企業/競合の分類
- ベンダー情勢
- 主要ディストリビューターとチャネルパートナーのリスト
- 主要顧客
- 主要企業の市場シェア分析、2023年
- ChiRhoClin
- Certest Biotec
- ScheBo Biotech AG
- Immundiagnostik AG
- Laboratory Corporation of America Holdings
- Boster Biological Technology
- ALPCO Diagnostics
- Quest Diagnostics Incorporated
- DiaSorin SpA
- ARUP Laboratories
- Verisana Laboratories
- Alpha Laboratories
List of Tables
- Table 1 List of abbreviation
- Table 2 North America exocrine pancreatic insufficiency diagnostics market, by region, 2018 - 2030 (USD Million)
- Table 3 North America exocrine pancreatic insufficiency diagnostics market, by diagnostic method, 2018 - 2030 (USD Million)
- Table 4 North America exocrine pancreatic insufficiency diagnostics market, by end-use, 2018 - 2030 (USD Million)
- Table 5 U.S. exocrine pancreatic insufficiency diagnostics market, by diagnostic method, 2018 - 2030 (USD Million)
- Table 6 U.S. exocrine pancreatic insufficiency diagnostics market, by end-use, 2018 - 2030 (USD Million)
- Table 7 Canada exocrine pancreatic insufficiency diagnostics market, by diagnostic method, 2018 - 2030 (USD Million)
- Table 8 Canada exocrine pancreatic insufficiency diagnostics market, by end-use, 2018 - 2030 (USD Million)
- Table 9 Europe exocrine pancreatic insufficiency diagnostics market, by region, 2018 - 2030 (USD Million)
- Table 10 Europe exocrine pancreatic insufficiency diagnostics market, by diagnostic method, 2018 - 2030 (USD Million)
- Table 11 Europe exocrine pancreatic insufficiency diagnostics market, by end-use, 2018 - 2030 (USD Million)
- Table 12 Germany exocrine pancreatic insufficiency diagnostics market, by diagnostic method, 2018 - 2030 (USD Million)
- Table 13 Germany exocrine pancreatic insufficiency diagnostics market, by end-use, 2018 - 2030 (USD Million)
- Table 14 UK exocrine pancreatic insufficiency diagnostics market, by diagnostic method, 2018 - 2030 (USD Million)
- Table 15 UK exocrine pancreatic insufficiency diagnostics market, by end-use, 2018 - 2030 (USD Million)
- Table 16 France exocrine pancreatic insufficiency diagnostics market, by diagnostic method, 2018 - 2030 (USD Million)
- Table 17 France exocrine pancreatic insufficiency diagnostics market, by end-use, 2018 - 2030 (USD Million)
- Table 18 Italy exocrine pancreatic insufficiency diagnostics market, by diagnostic method, 2018 - 2030 (USD Million)
- Table 19 Italy exocrine pancreatic insufficiency diagnostics market, by end-use, 2018 - 2030 (USD Million)
- Table 20 Spain exocrine pancreatic insufficiency diagnostics market, by diagnostic method, 2018 - 2030 (USD Million)
- Table 21 Spain exocrine pancreatic insufficiency diagnostics market, by end-use, 2018 - 2030 (USD Million)
- Table 22 Denmark exocrine pancreatic insufficiency diagnostics market, by diagnostic method, 2018 - 2030 (USD Million)
- Table 23 Denmark exocrine pancreatic insufficiency diagnostics market, by end-use, 2018 - 2030 (USD Million)
- Table 24 Sweden exocrine pancreatic insufficiency diagnostics market, by diagnostic method, 2018 - 2030 (USD Million)
- Table 25 Sweden exocrine pancreatic insufficiency diagnostics market, by end-use, 2018 - 2030 (USD Million)
- Table 26 Norway exocrine pancreatic insufficiency diagnostics market, by diagnostic method, 2018 - 2030 (USD Million)
- Table 27 Norway exocrine pancreatic insufficiency diagnostics market, by end-use, 2018 - 2030 (USD Million)
- Table 28 Asia Pacific exocrine pancreatic insufficiency diagnostics market, by region 2018 - 2030 (USD Million)
- Table 29 Asia Pacific exocrine pancreatic insufficiency diagnostics market, by diagnostic method, 2018 - 2030 (USD Million)
- Table 30 Asia Pacific exocrine pancreatic insufficiency diagnostics market, by end-use, 2018 - 2030 (USD Million)
- Table 31 Japan exocrine pancreatic insufficiency diagnostics market, by diagnostic method, 2018 - 2030 (USD Million)
- Table 32 Japan exocrine pancreatic insufficiency diagnostics market, by end-use, 2018 - 2030 (USD Million)
- Table 33 China exocrine pancreatic insufficiency diagnostics market, by diagnostic method, 2018 - 2030 (USD Million)
- Table 34 China exocrine pancreatic insufficiency diagnostics market, by end-use, 2018 - 2030 (USD Million)
- Table 35 India exocrine pancreatic insufficiency diagnostics market, by diagnostic method, 2018 - 2030 (USD Million)
- Table 36 India exocrine pancreatic insufficiency diagnostics market, by end-use, 2018 - 2030 (USD Million)
- Table 37 Australia exocrine pancreatic insufficiency diagnostics market, by diagnostic method, 2018 - 2030 (USD Million)
- Table 38 Australia exocrine pancreatic insufficiency diagnostics market, by end-use, 2018 - 2030 (USD Million)
- Table 39 Thailand exocrine pancreatic insufficiency diagnostics market, by diagnostic method, 2018 - 2030 (USD Million)
- Table 40 Thailand exocrine pancreatic insufficiency diagnostics market, by end-use, 2018 - 2030 (USD Million)
- Table 41 South Korea exocrine pancreatic insufficiency diagnostics market, by diagnostic method, 2018 - 2030 (USD Million)
- Table 42 South Korea exocrine pancreatic insufficiency diagnostics market, by end-use, 2018 - 2030 (USD Million)
- Table 43 Latin America exocrine pancreatic insufficiency diagnostics market, by region, 2018 - 2030 (USD Million)
- Table 44 Latin America exocrine pancreatic insufficiency diagnostics market, by diagnostic method, 2018 - 2030 (USD Million)
- Table 45 Latin America exocrine pancreatic insufficiency diagnostics market, by end-use, 2018 - 2030 (USD Million)
- Table 46 Brazil exocrine pancreatic insufficiency diagnostics market, by diagnostic method, 2018 - 2030 (USD Million)
- Table 47 Brazil exocrine pancreatic insufficiency diagnostics market, by end-use, 2018 - 2030 (USD Million)
- Table 48 Mexico exocrine pancreatic insufficiency diagnostics market, by diagnostic method, 2018 - 2030 (USD Million)
- Table 49 Mexico exocrine pancreatic insufficiency diagnostics market, by end-use, 2018 - 2030 (USD Million)
- Table 50 Argentina exocrine pancreatic insufficiency diagnostics market, by diagnostic method, 2018 - 2030 (USD Million)
- Table 51 Argentina exocrine pancreatic insufficiency diagnostics market, by end-use, 2018 - 2030 (USD Million)
- Table 52 MEA exocrine pancreatic insufficiency diagnostics market, by region, 2018 - 2030 (USD Million)
- Table 53 MEA exocrine pancreatic insufficiency diagnostics market, by diagnostic method, 2018 - 2030 (USD Million)
- Table 54 MEA exocrine pancreatic insufficiency diagnostics market, by end-use, 2018 - 2030 (USD Million)
- Table 55 South Africa exocrine pancreatic insufficiency diagnostics market, by diagnostic method, 2018 - 2030 (USD Million)
- Table 56 South Africa exocrine pancreatic insufficiency diagnostics market, by end-use, 2018 - 2030 (USD Million)
- Table 57 Saudi Arabia exocrine pancreatic insufficiency diagnostics market, by diagnostic method, 2018 - 2030 (USD Million)
- Table 58 Saudi Arabia exocrine pancreatic insufficiency diagnostics market, by end-use, 2018 - 2030 (USD Million)
- Table 59 UAE exocrine pancreatic insufficiency diagnostics market, by diagnostic method, 2018 - 2030 (USD Million)
- Table 60 UAE exocrine pancreatic insufficiency diagnostics market, by end-use, 2018 - 2030 (USD Million)
- Table 61 Kuwait exocrine pancreatic insufficiency diagnostics market, by diagnostic method, 2018 - 2030 (USD Million)
- Table 62 Kuwait exocrine pancreatic insufficiency diagnostics market, by end-use, 2018 - 2030 (USD Million)
List of Figures
- Fig. 1 Market research process
- Fig. 2 Data triangulation techniques
- Fig. 3 Primary research pattern
- Fig. 4 Primary interviews in North America
- Fig. 5 Primary interviews in Europe
- Fig. 6 Primary interviews in Asia Pacific
- Fig. 7 Primary interviews in Latin America
- Fig. 8 Primary interviews in MEA
- Fig. 9 Market research approaches
- Fig. 10 Value-chain-based sizing & forecasting
- Fig. 11 QFD modeling for market share assessment
- Fig. 12 Market formulation & validation
- Fig. 13 Exocrine pancreatic insufficiency diagnostics market: market outlook
- Fig. 14 Parent market outlook
- Fig. 15 Related/ancillary market outlook
- Fig. 16 Exocrine pancreatic insufficiency diagnostics market driver impact
- Fig. 17 Exocrine pancreatic insufficiency diagnostics market restraint impact
- Fig. 18 Exocrine pancreatic insufficiency diagnostics market: Diagnostic method movement analysis
- Fig. 19 Exocrine pancreatic insufficiency diagnostics market: Diagnostic method outlook and key takeaways
- Fig. 20 Laboratory tests market estimates and forecast, 2018 - 2030
- Fig. 21 Indirect pancreatic function tests market estimates and forecast, 2018 - 2030
- Fig. 22 Stool tests market estimates and forecast, 2018 - 2030
- Fig. 23 Blood tests market estimates and forecast, 2018 - 2030
- Fig. 24 Other tests market estimates and forecast, 2018 - 2030
- Fig. 25 Imaging tests market estimates and forecast, 2018 - 2030
- Fig. 26 CT scans market estimates and forecast, 2018 - 2030
- Fig. 27 MRI market estimates and forecast, 2018 - 2030
- Fig. 28 Endoscopic ultrasound for pancreatic function tests market estimates and forecast, 2018 2030
- Fig. 29 Exocrine pancreatic insufficiency diagnostics market: End-use movement analysis
- Fig. 30 Exocrine pancreatic insufficiency diagnostics market: End-use outlook and key takeaways
- Fig. 31 Hospitals & clinics market estimates and forecast, 2018 - 2030
- Fig. 32 Diagnostic laboratories estimates and forecast, 2018 - 2030
- Fig. 33 Research institutes market estimates and forecast, 2018 - 2030
- Fig. 34 Global Exocrine pancreatic insufficiency diagnostics market: Regional movement analysis
- Fig. 35 Global Exocrine pancreatic insufficiency diagnostics market: Regional outlook and key takeaways
- Fig. 36 Global Exocrine pancreatic insufficiency diagnostics market share and leading players
- Fig. 37 North America
- Fig. 38 North America market estimates and forecasts, 2018 - 2030 (USD Million)
- Fig. 39 U.S. key country dynamics
- Fig. 40 U.S. market estimates and forecasts, 2018 - 2030 (USD Million)
- Fig. 41 Canada key country dynamics
- Fig. 42 Canada market estimates and forecasts, 2018 - 2030 (USD Million)
- Fig. 43 Europe
- Fig. 44 Europe market estimates and forecasts, 2018 - 2030 (USD Million)
- Fig. 45 UK key country dynamics
- Fig. 46 UK market estimates and forecasts, 2018 - 2030 (USD Million)
- Fig. 47 Germany key country dynamics
- Fig. 48 Germany market estimates and forecasts, 2018 - 2030 (USD Million)
- Fig. 49 France key country dynamics
- Fig. 50 France market estimates and forecasts, 2018 - 2030 (USD Million)
- Fig. 51 Italy key country dynamics
- Fig. 52 Italy market estimates and forecasts, 2018 - 2030 (USD Million)
- Fig. 53 Spain key country dynamics
- Fig. 54 Spain market estimates and forecasts, 2018 - 2030 (USD Million)
- Fig. 55 Denmark key country dynamics
- Fig. 56 Denmark market estimates and forecasts, 2018 - 2030 (USD Million)
- Fig. 57 Sweden key country dynamics
- Fig. 58 Sweden market estimates and forecasts, 2018 - 2030 (USD Million)
- Fig. 59 Norway key country dynamics
- Fig. 60 Norway market estimates and forecasts, 2018 - 2030 (USD Million)
- Fig. 61 Asia Pacific
- Fig. 62 Asia Pacific market estimates and forecasts, 2018 - 2030 (USD Million)
- Fig. 63 China key country dynamics
- Fig. 64 China market estimates and forecasts, 2018 - 2030 (USD Million)
- Fig. 65 Japan key country dynamics
- Fig. 66 Japan market estimates and forecasts, 2018 - 2030 (USD Million)
- Fig. 67 India key country dynamics
- Fig. 68 India market estimates and forecasts, 2018 - 2030 (USD Million)
- Fig. 69 Australia key country dynamics
- Fig. 70 Australia market estimates and forecasts, 2018 - 2030 (USD Million)
- Fig. 71 Thailand key country dynamics
- Fig. 72 Thailand market estimates and forecasts, 2018 - 2030 (USD Million)
- Fig. 73 South Korea key country dynamics
- Fig. 74 South Korea market estimates and forecasts, 2018 - 2030 (USD Million)
- Fig. 75 Latin America
- Fig. 76 Latin America market estimates and forecasts, 2018 - 2030 (USD Million)
- Fig. 77 Brazil key country dynamics
- Fig. 78 Brazil market estimates and forecasts, 2018 - 2030 (USD Million)
- Fig. 79 Mexico key country dynamics
- Fig. 80 Mexico market estimates and forecasts, 2018 - 2030 (USD Million)
- Fig. 81 Argentina key country dynamics
- Fig. 82 Argentina market estimates and forecasts, 2018 - 2030 (USD Million)
- Fig. 83 Middle East and Africa
- Fig. 84 Middle East and Africa market estimates and forecasts, 2018 - 2030 (USD Million)
- Fig. 85 South Africa key country dynamics
- Fig. 86 South Africa market estimates and forecasts, 2018 - 2030 (USD Million)
- Fig. 87 Saudi Arabia key country dynamics
- Fig. 88 Saudi Arabia market estimates and forecasts, 2018 - 2030 (USD Million)
- Fig. 89 UAE key country dynamics
- Fig. 90 UAE market estimates and forecasts, 2018 - 2030 (USD Million)
- Fig. 91 Kuwait key country dynamics
- Fig. 92 Kuwait market estimates and forecasts, 2018 - 2030 (USD Million)
- Fig. 93 Market share of key market players- Exocrine pancreatic insufficiency diagnostics market
Exocrine Pancreatic Insufficiency Diagnostics Market Growth & Trends:
The global exocrine pancreatic insufficiency diagnostics market size is anticipated to reach USD 5.44 billion by 2030 and is growing at a CAGR of 7.2% from 2024 to 2030, according to a new report by Grand View Research, Inc. Exocrine pancreatic insufficiency (EPI) diagnostics are crucial for identifying and managing the condition, especially considering its high prevalence in various patient populations and its association with several underlying causes. One of the major driving factors for diagnostics is the prevalence of patients with chronic pancreatitis. Studies have shown that EPI is prevalent in about 60% to 90% of patients diagnosed with chronic pancreatitis within 10 to 12 years of diagnosis. Chronic pancreatitis is a significant contributor to EPI, and its relatively high prevalence underscores the importance of early detection and management.
Furthermore, advanced pancreatic cancer is another condition strongly associated with the disease. Research indicates that between 66% to 92% of patients with advanced pancreatic cancer develop EPI. Early diagnosis of EPI in these patients can lead to better management of symptoms and improved quality of life. Inflammatory bowel disease (IBD) is also linked to EPI, with studies suggesting that between 14% and 74% of IBD patients may suffer from EPI. Timely diagnosis and treatment of exocrine pancreatic insufficiency in these patients can help alleviate symptoms and improve nutritional status.
In addition, patients undergoing bariatric surgery are at risk of developing EPI despite receiving enzymatic and nutritional supplements. This highlights the importance of ongoing monitoring and diagnostic testing to identify exocrine pancreatic insufficiency in this patient population. Moreover, the prevalence of EPI in patients with HIV/AIDS is estimated to be between 26% and 45%. Early detection of exocrine pancreatic insufficiency in these individuals is essential for optimizing nutritional status and overall health outcomes.
The diverse range of conditions associated with EPI underscores the need for comprehensive diagnostic approaches. Factors driving the demand for exocrine pancreatic insufficiency diagnostics include high prevalence in various patient populations, the association with chronic conditions such as chronic pancreatitis and pancreatic cancer, and the importance of early detection for effective management and improved patient outcomes. As diagnostic technologies advance, early detection and personalized management will become increasingly feasible, leading to better patient care and outcomes.
Key market players such as ChiRhoClin, Inc., Certest Biotec, ScheBo Biotech AG, Immundiagnostik AG, and Laboratory Corporation of America Holdings are at the forefront of innovation in exocrine pancreatic insufficiency diagnostics. These companies are constantly focusing on expanding their products. For instance, in June 2021, CERTEST BIOTEC announced to participate and showcase its product with latest developments at 71st Annual Scientific Meeting and Exhibition of Clinical Laboratories of the AACC held from August 4 to 8 in California.
Exocrine Pancreatic Insufficiency Diagnostics Market Report Highlights:
- Based on diagnostic method, the laboratory tests segment dominated the overall market with the highest revenue share in 2023. This can be attributed to the extensive advancements such as automation in the laboratory, disposable kits, sample collections & storage, and assays
- Growing R&D in EPI diagnostics is projected to propel market growth over the forecast period
- The introduction of new techniques and assays and the integration of established technologies signifies a significant step forward in diagnostics. As awareness about pancreatic disorders continues to grow, fueled by advancements in diagnostic technologies, the U.S. market for stool tests in EPI diagnostics is poised for continued expansion in the coming years
- The hospitals and clinics end-use segment dominated the market in 2023, driven by several factors. Increased awareness among healthcare professionals and patients about symptoms and risk factors has led to higher diagnosis rates in these settings. Accessibility of diagnostic services in hospitals and clinics facilitates widespread screening and testing for exocrine pancreatic insufficiency, and advancements in diagnostic technologies enhance the accuracy and efficiency of EPI detection, further driving growth in this segment
- North America dominated the market owing to factors such as advanced healthcare infrastructure, rising prevalence of target diseases, and favorable regulatory environment
Table of Contents
Chapter 1. Methodology and Scope
- 1.1. Market Segmentation & Scope
- 1.2. Segment Definitions
- 1.2.1. Diagnostic Method
- 1.2.2. End-use
- 1.2.3. Regional scope
- 1.2.4. Estimates and forecasts timeline
- 1.3. Research Methodology
- 1.4. Information Procurement
- 1.4.1. Purchased database
- 1.4.2. GVR's internal database
- 1.4.3. Secondary sources
- 1.4.4. Primary research
- 1.4.5. Details of primary research
- 1.4.5.1. Data for primary interviews in North America
- 1.4.5.2. Data for primary interviews in Europe
- 1.4.5.3. Data for primary interviews in Asia Pacific
- 1.4.5.4. Data for primary interviews in Latin America
- 1.4.5.5. Data for Primary interviews in MEA
- 1.5. Information or Data Analysis
- 1.5.1. Data analysis models
- 1.6. Market Formulation & Validation
- 1.7. Model Details
- 1.7.1. Commodity flow analysis (Model 1)
- 1.7.2. Approach 1: Commodity flow approach
- 1.7.3. Volume price analysis (Model 2)
- 1.7.4. Approach 2: Volume price analysis
- 1.8. List of Secondary Sources
- 1.9. List of Primary Sources
- 1.10. Objectives
Chapter 2. Executive Summary
- 2.1. Market Outlook
- 2.2. Segment Outlook
- 2.2.1. Diagnostic method Outlook
- 2.2.2. End-use Outlook
- 2.2.3. Regional Outlook
- 2.3. Competitive Insights
Chapter 3. Exocrine Pancreatic Insufficiency Diagnostics Market Variables, Trends & Scope
- 3.1. Market Lineage Outlook
- 3.1.1. Parent market outlook
- 3.1.2. Related/ancillary market outlook
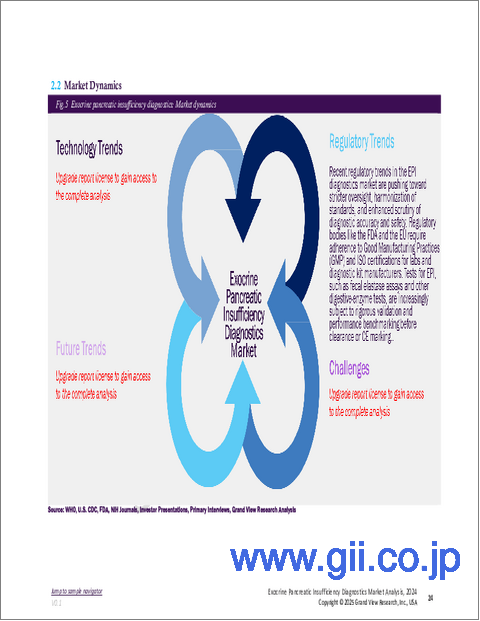
- 3.2. Market Dynamics
- 3.2.1. Market Driver Analysis
- 3.2.1.1. Increasing disease awareness
- 3.2.1.2. Focus on early detection
- 3.2.1.3. Increasing cases of exocrine pancreatic insufficiency
- 3.2.2. Market Restraint Analysis
- 3.2.2.1. Regulatory hurdles and compliance requirements
- 3.2.2.2. Underdiagnosis and misdiagnosis
- 3.2.1. Market Driver Analysis
- 3.3. Exocrine Pancreatic Insufficiency Diagnostics Market Analysis Tools
- 3.3.1. Industry Analysis - Porter's
- 3.3.1.1. Supplier power
- 3.3.1.2. Buyer power
- 3.3.1.3. Substitution threat
- 3.3.1.4. Threat of new entrant
- 3.3.1.5. Competitive rivalry
- 3.3.2. PESTEL Analysis
- 3.3.2.1. Political landscape
- 3.3.2.2. Technological landscape
- 3.3.2.3. Economic landscape
- 3.3.3. Pricing Analysis
- 3.3.4. Volume Analysis (Laboratory-based Testing Devices)
- 3.3.1. Industry Analysis - Porter's
Chapter 4. Exocrine Pancreatic Insufficiency Diagnostics Market: Diagnostic Method Estimates & Trend Analysis
- 4.1. Segment Dashboard
- 4.2. Global Exocrine Pancreatic Insufficiency Diagnostics Market Movement Analysis
- 4.3. Global Exocrine Pancreatic Insufficiency Diagnostics Market by Diagnostic Method Outlook
- 4.4. Laboratory Tests
- 4.4.1. Laboratory tests market estimates and forecasts 2018 - 2030 (USD Million)
- 4.4.2. Indirect Pancreatic Function Tests
- 4.4.2.1. Market estimates and forecasts 2018 - 2030 (USD Million)
- 4.4.2.2. Stool Tests
- 4.4.2.2.1. Market estimates and forecasts 2018 - 2030 (USD Million)
- 4.4.2.3. Blood Tests
- 4.4.2.3.1. Market estimates and forecasts 2018 - 2030 (USD Million)
- 4.4.3. Other Tests
- 4.4.3.1. Market estimates and forecasts 2018 - 2030 (USD Million)
- 4.5. Imaging Tests
- 4.5.1. Imaging tests market estimates and forecasts 2018 - 2030 (USD Million)
- 4.5.2. CT scans
- 4.5.2.1. Market estimates and forecasts 2018 - 2030 (USD Million)
- 4.5.3. MRI
- 4.5.3.1. Market estimates and forecasts 2018 - 2030 (USD Million)
- 4.5.4. Endoscopic Ultrasound for pancreatic function tests
- 4.5.4.1. Market estimates and forecasts 2018 - 2030 (USD Million)
Chapter 5. Exocrine Pancreatic Insufficiency Diagnostics Market: End-use Estimates & Trend Analysis
- 5.1. Segment Dashboard
- 5.2. Global Exocrine Pancreatic Insufficiency Diagnostics Market Movement Analysis
- 5.3. Global Exocrine Pancreatic Insufficiency Diagnostics Market by End-use Outlook
- 5.4. Hospitals & Clinics
- 5.4.1. Hospitals & Clinics market estimates and forecasts 2018 - 2030 (USD Million)
- 5.5. Diagnostic Laboratories
- 5.5.1. Diagnostic laboratories market estimates and forecasts 2018 - 2030 (USD Million)
- 5.6. Research Institutes
- 5.6.1. Research Institutes market estimates and forecasts 2018 - 2030 (USD Million)
Chapter 6. Exocrine Pancreatic Insufficiency Diagnostics Market: Regional Estimates & Trend Analysis by Diagnostic Method, and End-use
- 6.1. Regional Dashboard
- 6.2. Market Size, & Forecasts Trend Analysis, 2018 to 2030:
- 6.3. North America
- 6.3.1. U.S.
- 6.3.1.1. Key country dynamics
- 6.3.1.2. Regulatory framework/ reimbursement structure
- 6.3.1.3. Competitive scenario
- 6.3.1.4. U.S. market estimates and forecasts 2018 - 2030 (USD Million)
- 6.3.2. Canada
- 6.3.2.1. Key country dynamics
- 6.3.2.2. Regulatory framework/ reimbursement structure
- 6.3.2.3. Competitive scenario
- 6.3.2.4. Canada market estimates and forecasts 2018 - 2030 (USD Million)
- 6.3.1. U.S.
- 6.4. Europe
- 6.4.1. UK
- 6.4.1.1. Key country dynamics
- 6.4.1.2. Regulatory framework/ reimbursement structure
- 6.4.1.3. Competitive scenario
- 6.4.1.4. UK market estimates and forecasts 2018 - 2030 (USD Million)
- 6.4.2. Germany
- 6.4.2.1. Key country dynamics
- 6.4.2.2. Regulatory framework/ reimbursement structure
- 6.4.2.3. Competitive scenario
- 6.4.2.4. Germany market estimates and forecasts 2018 - 2030 (USD Million)
- 6.4.3. France
- 6.4.3.1. Key country dynamics
- 6.4.3.2. Regulatory framework/ reimbursement structure
- 6.4.3.3. Competitive scenario
- 6.4.3.4. France market estimates and forecasts 2018 - 2030 (USD Million)
- 6.4.4. Italy
- 6.4.4.1. Key country dynamics
- 6.4.4.2. Regulatory framework/ reimbursement structure
- 6.4.4.3. Competitive scenario
- 6.4.4.4. Italy market estimates and forecasts 2018 - 2030 (USD Million)
- 6.4.5. Spain
- 6.4.5.1. Key country dynamics
- 6.4.5.2. Regulatory framework/ reimbursement structure
- 6.4.5.3. Competitive scenario
- 6.4.5.4. Spain market estimates and forecasts 2018 - 2030 (USD Million)
- 6.4.6. Denmark
- 6.4.6.1. Key country dynamics
- 6.4.6.2. Regulatory framework/ reimbursement structure
- 6.4.6.3. Competitive scenario
- 6.4.6.4. Denmark market estimates and forecasts 2018 - 2030 (USD Million)
- 6.4.7. Sweden
- 6.4.7.1. Key country dynamics
- 6.4.7.2. Regulatory framework/ reimbursement structure
- 6.4.7.3. Competitive scenario
- 6.4.7.4. Sweden market estimates and forecasts 2018 - 2030 (USD Million)
- 6.4.8. Norway
- 6.4.8.1. Key country dynamics
- 6.4.8.2. Regulatory framework/ reimbursement structure
- 6.4.8.3. Competitive scenario
- 6.4.8.4. Norway market estimates and forecasts 2018 - 2030 (USD Million)
- 6.4.1. UK
- 6.5. Asia Pacific
- 6.5.1. Japan
- 6.5.1.1. Key country dynamics
- 6.5.1.2. Regulatory framework/ reimbursement structure
- 6.5.1.3. Competitive scenario
- 6.5.1.4. Japan market estimates and forecasts 2018 - 2030 (USD Million)
- 6.5.2. China
- 6.5.2.1. Key country dynamics
- 6.5.2.2. Regulatory framework/ reimbursement structure
- 6.5.2.3. Competitive scenario
- 6.5.2.4. China market estimates and forecasts 2018 - 2030 (USD Million)
- 6.5.3. India
- 6.5.3.1. Key country dynamics
- 6.5.3.2. Regulatory framework/ reimbursement structure
- 6.5.3.3. Competitive scenario
- 6.5.3.4. India market estimates and forecasts 2018 - 2030 (USD Million)
- 6.5.4. Australia
- 6.5.4.1. Key country dynamics
- 6.5.4.2. Regulatory framework/ reimbursement structure
- 6.5.4.3. Competitive scenario
- 6.5.4.4. Australia market estimates and forecasts 2018 - 2030 (USD Million)
- 6.5.5. Thailand
- 6.5.5.1. Key country dynamics
- 6.5.5.2. Regulatory framework/ reimbursement structure
- 6.5.5.3. Competitive scenario
- 6.5.5.4. Thailand market estimates and forecasts 2018 - 2030 (USD Million)
- 6.5.6. South Korea
- 6.5.6.1. Key country dynamics
- 6.5.6.2. Regulatory framework/ reimbursement structure
- 6.5.6.3. Competitive scenario
- 6.5.6.4. South Korea market estimates and forecasts 2018 - 2030 (USD Million)
- 6.5.1. Japan
- 6.6. Latin America
- 6.6.1. Brazil
- 6.6.1.1. Key country dynamics
- 6.6.1.2. Regulatory framework/ reimbursement structure
- 6.6.1.3. Competitive scenario
- 6.6.1.4. Brazil market estimates and forecasts 2018 - 2030 (USD Million)
- 6.6.2. Mexico
- 6.6.2.1. Key country dynamics
- 6.6.2.2. Regulatory framework/ reimbursement structure
- 6.6.2.3. Competitive scenario
- 6.6.2.4. Mexico market estimates and forecasts 2018 - 2030 (USD Million)
- 6.6.3. Argentina
- 6.6.3.1. Key country dynamics
- 6.6.3.2. Regulatory framework/ reimbursement structure
- 6.6.3.3. Competitive scenario
- 6.6.3.4. Argentina market estimates and forecasts 2018 - 2030 (USD Million)
- 6.6.1. Brazil
- 6.7. MEA
- 6.7.1. South Africa
- 6.7.1.1. Key country dynamics
- 6.7.1.2. Regulatory framework/ reimbursement structure
- 6.7.1.3. Competitive scenario
- 6.7.1.4. South Africa market estimates and forecasts 2018 - 2030 (USD Million)
- 6.7.2. Saudi Arabia
- 6.7.2.1. Key country dynamics
- 6.7.2.2. Regulatory framework/ reimbursement structure
- 6.7.2.3. Competitive scenario
- 6.7.2.4. Saudi Arabia market estimates and forecasts 2018 - 2030 (USD Million)
- 6.7.3. UAE
- 6.7.3.1. Key country dynamics
- 6.7.3.2. Regulatory framework/ reimbursement structure
- 6.7.3.3. Competitive scenario
- 6.7.3.4. UAE market estimates and forecasts 2018 - 2030 (USD Million)
- 6.7.4. Kuwait
- 6.7.4.1. Key country dynamics
- 6.7.4.2. Regulatory framework/ reimbursement structure
- 6.7.4.3. Competitive scenario
- 6.7.4.4. Kuwait market estimates and forecasts 2018 - 2030 (USD Million)
- 6.7.1. South Africa
Chapter 7. Competitive Landscape
- 7.1. Recent Developments & Impact Analysis, By Key Market Participants
- 7.2. Company/Competition Categorization
- 7.3. Vendor Landscape
- 7.3.1. List of key distributors and channel partners
- 7.3.2. Key customers
- 7.3.3. Key company market share analysis, 2023
- 7.3.4. ChiRhoClin
- 7.3.4.1. Company overview
- 7.3.4.2. Financial performance
- 7.3.4.3. Product benchmarking
- 7.3.4.4. Strategic initiatives
- 7.3.5. Certest Biotec
- 7.3.5.1. Company overview
- 7.3.5.2. Financial performance
- 7.3.5.3. Product benchmarking
- 7.3.5.4. Strategic initiatives
- 7.3.6. ScheBo Biotech AG
- 7.3.6.1. Company overview
- 7.3.6.2. Financial performance
- 7.3.6.3. Product benchmarking
- 7.3.6.4. Strategic initiatives
- 7.3.7. Immundiagnostik AG
- 7.3.7.1. Company overview
- 7.3.7.2. Financial performance
- 7.3.7.3. Product benchmarking
- 7.3.7.4. Strategic initiatives
- 7.3.8. Laboratory Corporation of America Holdings
- 7.3.8.1. Company overview
- 7.3.8.2. Financial performance
- 7.3.8.3. Product benchmarking
- 7.3.8.4. Strategic initiatives
- 7.3.9. Boster Biological Technology
- 7.3.9.1. Company overview
- 7.3.9.2. Financial performance
- 7.3.9.3. Product benchmarking
- 7.3.9.4. Strategic initiatives
- 7.3.10. ALPCO Diagnostics
- 7.3.10.1. Company overview
- 7.3.10.2. Financial performance
- 7.3.10.3. Product benchmarking
- 7.3.10.4. Strategic initiatives
- 7.3.11. Quest Diagnostics Incorporated
- 7.3.11.1. Company overview
- 7.3.11.2. Financial performance
- 7.3.11.3. Product benchmarking
- 7.3.11.4. Strategic initiatives
- 7.3.12. DiaSorin S.p.A.
- 7.3.12.1. Company overview
- 7.3.12.2. Financial performance
- 7.3.12.3. Product benchmarking
- 7.3.12.4. Strategic initiatives
- 7.3.13. ARUP Laboratories
- 7.3.13.1. Company overview
- 7.3.13.2. Financial performance
- 7.3.13.3. Product benchmarking
- 7.3.13.4. Strategic initiatives
- 7.3.14. Verisana Laboratories
- 7.3.14.1. Company overview
- 7.3.14.2. Financial performance
- 7.3.14.3. Product benchmarking
- 7.3.14.4. Strategic initiatives
- 7.3.15. Alpha Laboratories
- 7.3.15.1. Company overview
- 7.3.15.2. Financial performance
- 7.3.15.3. Product benchmarking
- 7.3.15.4. Strategic initiatives
