|
|
市場調査レポート
商品コード
1493185
HbA1c検査装置の世界市場:市場規模、シェア、動向分析 - 装置タイプ別、技術別、最終用途別、地域別、セグメント予測、2024~2030年HbA1c Testing Devices Market Size, Share & Trends Analysis Report By Type of Device (Point-of-care (POC) Testing Devices, Laboratory-based Testing Devices), By Technology, By End-use, By Region, And Segment Forecasts, 2024 - 2030 |
||||||
|
|||||||
カスタマイズ可能
|
|||||||

| HbA1c検査装置の世界市場:市場規模、シェア、動向分析 - 装置タイプ別、技術別、最終用途別、地域別、セグメント予測、2024~2030年 |
|
出版日: 2024年05月06日
発行: Grand View Research
ページ情報: 英文 125 Pages
納期: 2~10営業日
|

全表示
- 概要
- 図表
- 目次
世界のHbA1c検査装置の市場規模は、2024~2030年にかけてCAGR 6.48%で成長し、2030年には31億5,000万米ドルに達すると予測されています。
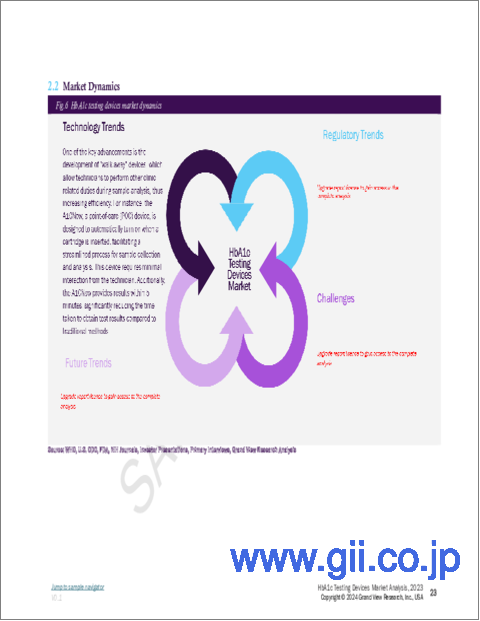
HbA1c検査装置の世界市場は、糖尿病有病率の上昇と正確で効率的なモニタリングソリューションの需要に牽引され、著しい成長を遂げています。CDCによると、2021年には人口の11.6%にあたる3,840万人の米国人が糖尿病に罹患しています。この中には200万人の1型糖尿病患者が含まれ、そのうち約30万4,000人が小児および青年です。この報告書はまた、毎年120万人のアメリカ人が糖尿病と診断されていることを強調しており、糖尿病のケアと管理に対する根強い必要性を強調しています。HbA1c検査は、長期的な血糖コントロールに関する貴重な洞察を提供し、ヘルスケアプロバイダーが患者の治療計画を最適化するのを支援することによって、糖尿病管理において重要な役割を果たしています。
血糖コントロールの重要性とHbA1c検査装置は、正確なモニタリングツールに対する需要の増加、技術革新の促進、特に中低所得国での市場拡大により、市場成長の原動力となっています。不十分なコントロールは合併症を引き起こし、患者のQOLとヘルスケアコストに影響を与えます。ある研究によると、DCCT(Diabetes Control and Complications Trial)は、厳格なグルコースコントロールが長期的な合併症を減らすことを示しており、集中治療の費用対効果を強調しています。低・中所得国(LMICs)では、診断が遅いため、血糖コントロールと患者教育が重要です。そのため、入院治療や合併症治療に比べてコストを削減するために、早期診断、体系的な合併症スクリーニング、タイムリーな治療強化の必要性が高まっています。
市場は、迅速な結果を提供し、タイムリーな介入と個別化された治療計画を可能にするPOC(Point-of-care)検査装置への顕著なシフトを目の当たりにしています。POC検査装置は、患者がHbA1c値を簡便かつ効果的にモニタリングできるようにするため、在宅医療の現場で広く普及しています。この動向は、ヘルスケアにおける患者中心のケアとリモートモニタリングソリューションの採用が重視されるようになっていることを反映しています。
ARKRAY, Inc.、Abbott Laboratories、Chek、Siemens Healthineers、Danaher Corporation、Bio-Rad Laboratories, Inc.、Trivitron Healthcare、EKF Diagnostics、Tosoh Corporationなどの主要な市場プレーヤーは、HbA1c検査装置の技術革新の最前線にいます。これらの企業は、HbA1c検査装置の精度、スピード、使いやすさを向上させる先進技術の開発に常に注力し、医療従事者や患者の進化するニーズに応えています。例えば、2022年8月、DxGen Corp.とPrecision Diabetes, Inc.は提携し、HbA1cを含む糖尿病検査用の自動ポイントオブケア分析器、Epithod AutoDxを発売しました。Epithod AutoDxは、ユーザーフレンドリーな設計により、医院や診療所などの環境において迅速な結果を得ることが可能で、パンデミックに伴う現場での検査需要の高まりに対応しています。
HbA1c検査装置市場レポートハイライト
- ポイントオブケア(POC)検査装置は、HbA1c検査装置分野で圧倒的なシェアを占め、糖尿病管理における十分な情報に基づく意思決定に不可欠な用途であることから、予測期間中に最も速いCAGRで成長すると予測されます。
- イムノアッセイは、迅速かつ簡便な測定結果が得られることから、技術分野で優位を占めています。
- 病院と診療所の最終用途セグメントが2023年の市場を独占したが、これは病院と診療所でこれらのデバイスを効果的に扱うための高度な技術とインフラが整っているためです。
- 北米がHbA1c検査装置産業で優位を占めたのは、高度なヘルスケアインフラ、対象疾患の有病率の上昇、良好な規制環境などの要因によるものです。
目次
第1章 調査手法と範囲
第2章 エグゼクティブサマリー
第3章 HbA1c検査装置市場の変数、動向、範囲
- 市場系統の見通し
- 親市場の見通し
- 関連/付随市場の見通し
- 市場力学
- 市場促進要因分析
- 市場抑制要因分析
- HbA1c検査装置市場分析ツール
- 産業分析 - ポーターのファイブフォース分析
- PESTEL分析
- 価格分析
- ボリューム分析(実験室ベースの検査装置)
第4章 HbA1c検査装置市場:装置タイプの推定・動向分析
- セグメントダッシュボード
- 世界のHbA1c検査装置市場の変動分析
- 世界のHbA1c検査装置市場:装置タイプ別の展望
- 実験室ベースの検査装置
- ポイントオブケア(POC)検査装置
第5章 HbA1c検査装置市場:技術の推定・動向分析
- セグメントダッシュボード
- 世界のHbA1c検査装置市場の変動分析
- 世界のHbA1c検査装置市場:技術別の展望
- 免疫学的検査
- クロマトグラフィー
- 酵素アッセイ
- ボロネートアフィニティークロマトグラフィー
- 高速液体クロマトグラフィー
- その他
第6章 HbA1c検査装置市場:最終用途の推定・動向分析
- セグメントダッシュボード
- 世界のHbA1c検査装置市場の変動分析
- 世界のHbA1c検査装置市場:最終用途別の展望
- 病院・クリニック
- 診断検査室
- ホームケア設定
第7章 HbA1c検査装置市場:地域の推定・動向分析 - 装置タイプ別、技術別、最終用途別
- 地域ダッシュボード
- 市場規模・予測動向分析、2018~2030年:
- 北米
- 欧州
- アジア太平洋
- ラテンアメリカ
- 中東・アフリカ
第8章 競合情勢
- 主要市場参入企業による最近の動向と影響分析
- 企業/競合の分類
- ベンダー情勢
- 主要代理店・チャネルパートナーリスト
- 主要顧客
- 主要企業の市場シェア分析、2023年
- Bio-Rad Laboratories, Inc.
- Abbott
- F. Hoffmann-La Roche Ltd
- Siemens Healthineers AG
- HUMAN
- Trinity Biotech
- Menarini Diagnostics srl
- SAKAE CO. LTD.
- Ceragem Medisys Inc
- SEKISUI MEDICAL CO., LTD.
List of Tables
- Table 1 List of abbreviations
- Table 2 North America HbA1c testing devices market, by region, 2018 - 2030 (USD Million)
- Table 3 North America HbA1c testing devices market, by type of device, 2018 - 2030 (USD Million)
- Table 4 North America HbA1c testing devices market, by technology, 2018 - 2030 (USD Million)
- Table 5 North America HbA1c testing devices market, by end-use, 2018 - 2030 (USD Million)
- Table 6 U.S. HbA1c testing devices market, by type of device, 2018 - 2030 (USD Million)
- Table 7 U.S. HbA1c testing devices market, by technology, 2018 - 2030 (USD Million)
- Table 8 U.S. HbA1c testing devices market, by end-use, 2018 - 2030 (USD Million)
- Table 9 Canada HbA1c testing devices market, by type of device, 2018 - 2030 (USD Million)
- Table 10 Canada HbA1c testing devices market, by technology, 2018 - 2030 (USD Million)
- Table 11 Canada HbA1c testing devices market, by end-use, 2018 - 2030 (USD Million)
- Table 12 Europe HbA1c testing devices market, by region, 2018 - 2030 (USD Million)
- Table 13 Europe HbA1c testing devices market, by type of device, 2018 - 2030 (USD Million)
- Table 14 Europe HbA1c testing devices market, by technology, 2018 - 2030 (USD Million)
- Table 15 Europe HbA1c testing devices market, by end-use, 2018 - 2030 (USD Million)
- Table 16 Germany HbA1c testing devices market, by type of device, 2018 - 2030 (USD Million)
- Table 17 Germany HbA1c testing devices market, by technology, 2018 - 2030 (USD Million)
- Table 18 Germany HbA1c testing devices market, by end-use, 2018 - 2030 (USD Million)
- Table 19 UK HbA1c testing devices market, by type of device, 2018 - 2030 (USD Million)
- Table 20 UK HbA1c testing devices market, by technology, 2018 - 2030 (USD Million)
- Table 21 UK HbA1c testing devices market, by end-use, 2018 - 2030 (USD Million)
- Table 22 France HbA1c testing devices market, by type of device, 2018 - 2030 (USD Million)
- Table 23 France HbA1c testing devices market, by technology, 2018 - 2030 (USD Million)
- Table 24 France HbA1c testing devices market, by end-use, 2018 - 2030 (USD Million)
- Table 25 Italy HbA1c testing devices market, by type of device, 2018 - 2030 (USD Million)
- Table 26 Italy HbA1c testing devices market, by technology, 2018 - 2030 (USD Million)
- Table 27 Italy HbA1c testing devices market, by end-use, 2018 - 2030 (USD Million)
- Table 28 Spain HbA1c testing devices market, by type of device, 2018 - 2030 (USD Million)
- Table 29 Spain HbA1c testing devices market, by technology, 2018 - 2030 (USD Million)
- Table 30 Spain HbA1c testing devices market, by end-use, 2018 - 2030 (USD Million)
- Table 31 Denmark HbA1c testing devices market, by type of device, 2018 - 2030 (USD Million)
- Table 32 Denmark HbA1c testing devices market, by technology, 2018 - 2030 (USD Million)
- Table 33 Denmark HbA1c testing devices market, by end-use, 2018 - 2030 (USD Million)
- Table 34 Sweden HbA1c testing devices market, by type of device, 2018 - 2030 (USD Million)
- Table 35 Sweden HbA1c testing devices market, by technology, 2018 - 2030 (USD Million)
- Table 36 Sweden HbA1c testing devices market, by end-use, 2018 - 2030 (USD Million)
- Table 37 Norway HbA1c testing devices market, by type of device, 2018 - 2030 (USD Million)
- Table 38 Norway HbA1c testing devices market, by technology, 2018 - 2030 (USD Million)
- Table 39 Norway HbA1c testing devices market, by end-use, 2018 - 2030 (USD Million)
- Table 40 Asia Pacific HbA1c testing devices market, by region, 2018 - 2030 (USD Million)
- Table 41 Asia Pacific HbA1c testing devices market, by type of device, 2018 - 2030 (USD Million)
- Table 42 Asia Pacific HbA1c testing devices market, by technology, 2018 - 2030 (USD Million)
- Table 43 Asia Pacific HbA1c testing devices market, by end-use, 2018 - 2030 (USD Million)
- Table 44 China HbA1c testing devices market, by type of device, 2018 - 2030 (USD Million)
- Table 45 China HbA1c testing devices market, by technology, 2018 - 2030 (USD Million)
- Table 46 China HbA1c testing devices market, by end-use, 2018 - 2030 (USD Million)
- Table 47 Japan HbA1c testing devices market, by type of device, 2018 - 2030 (USD Million)
- Table 48 Japan HbA1c testing devices market, by technology, 2018 - 2030 (USD Million)
- Table 49 Japan HbA1c testing devices market, by end-use, 2018 - 2030 (USD Million)
- Table 50 India HbA1c testing devices market, by type of device, 2018 - 2030 (USD Million)
- Table 51 India HbA1c testing devices market, by technology, 2018 - 2030 (USD Million)
- Table 52 India HbA1c testing devices market, by end-use, 2018 - 2030 (USD Million)
- Table 53 South Korea HbA1c testing devices market, by type of device, 2018 - 2030 (USD Million)
- Table 54 South Korea HbA1c testing devices market, by technology, 2018 - 2030 (USD Million)
- Table 55 South Korea HbA1c testing devices market, by end-use, 2018 - 2030 (USD Million)
- Table 56 Australia HbA1c testing devices market, by type of device, 2018 - 2030 (USD Million)
- Table 57 Australia HbA1c testing devices market, by technology, 2018 - 2030 (USD Million)
- Table 58 Australia HbA1c testing devices market, by end-use, 2018 - 2030 (USD Million)
- Table 59 Thailand HbA1c testing devices market, by type of device, 2018 - 2030 (USD Million)
- Table 60 Thailand HbA1c testing devices market, by technology, 2018 - 2030 (USD Million)
- Table 61 Thailand HbA1c testing devices market, by end-use, 2018 - 2030 (USD Million)
- Table 62 Latin America HbA1c testing devices market, by region, 2018 - 2030 (USD Million)
- Table 63 Latin America HbA1c testing devices market, by type of device, 2018 - 2030 (USD Million)
- Table 64 Latin America HbA1c testing devices market, by technology, 2018 - 2030 (USD Million)
- Table 65 Latin America HbA1c testing devices market, by end-use, 2018 - 2030 (USD Million)
- Table 66 Brazil HbA1c testing devices market, by type of device, 2018 - 2030 (USD Million)
- Table 67 Brazil HbA1c testing devices market, by technology, 2018 - 2030 (USD Million)
- Table 68 Brazil HbA1c testing devices market, by end-use, 2018 - 2030 (USD Million)
- Table 69 Mexico HbA1c testing devices market, by type of device, 2018 - 2030 (USD Million)
- Table 70 Mexico HbA1c testing devices market, by technology, 2018 - 2030 (USD Million)
- Table 71 Mexico HbA1c testing devices market, by end-use, 2018 - 2030 (USD Million)
- Table 72 Argentina HbA1c testing devices market, by type of device, 2018 - 2030 (USD Million)
- Table 73 Argentina HbA1c testing devices market, by technology, 2018 - 2030 (USD Million)
- Table 74 Argentina HbA1c testing devices market, by end-use, 2018 - 2030 (USD Million)
- Table 75 MEA HbA1c testing devices market, by region, 2018 - 2030 (USD Million)
- Table 76 MEA HbA1c testing devices market, by type of device, 2018 - 2030 (USD Million)
- Table 77 MEA HbA1c testing devices market, by technology, 2018 - 2030 (USD Million)
- Table 78 MEA HbA1c testing devices market, by end-use, 2018 - 2030 (USD Million)
- Table 79 South Africa HbA1c testing devices market, by type of device, 2018 - 2030 (USD Million)
- Table 80 South Africa HbA1c testing devices market, by technology, 2018 - 2030 (USD Million)
- Table 81 South Africa HbA1c testing devices market, by end-use, 2018 - 2030 (USD Million)
- Table 82 Saudi Arabia HbA1c testing devices market, by type of device, 2018 - 2030 (USD Million)
- Table 83 Saudi Arabia HbA1c testing devices market, by technology, 2018 - 2030 (USD Million)
- Table 84 Saudi Arabia HbA1c testing devices market, by end-use, 2018 - 2030 (USD Million)
- Table 85 UAE HbA1c testing devices market, by type of device, 2018 - 2030 (USD Million)
- Table 86 UAE HbA1c testing devices market, by technology, 2018 - 2030 (USD Million)
- Table 87 UAE HbA1c testing devices market, by end-use, 2018 - 2030 (USD Million)
- Table 88 Kuwait HbA1c testing devices market, by type of device, 2018 - 2030 (USD Million)
- Table 89 Kuwait HbA1c testing devices market, by technology, 2018 - 2030 (USD Million)
- Table 90 Kuwait HbA1c testing devices market, by end-use, 2018 - 2030 (USD Million)
List of Figures
- Fig. 1 Market research process
- Fig. 2 Data triangulation techniques
- Fig. 3 Primary research pattern
- Fig. 4 Primary interviews in North America
- Fig. 5 Primary interviews in Europe
- Fig. 6 Primary interviews in APAC
- Fig. 7 Primary interviews in Latin America
- Fig. 8 Primary interviews in MEA
- Fig. 9 Market research approaches
- Fig. 10 Value-chain-based sizing & forecasting
- Fig. 11 QFD modeling for market share assessment
- Fig. 12 Market formulation & validation
- Fig. 13 HbA1c testing devices market: market outlook
- Fig. 14 Parent market outlook
- Fig. 15 Related/ancillary market outlook
- Fig. 16 HbA1c testing devices market driver impact
- Fig. 17 HbA1c testing devices market restraint impact
- Fig. 18 HbA1c testing devices market: Type of device movement analysis
- Fig. 19 HbA1c testing devices market: Type of device outlook and key takeaways
- Fig. 20 Laboratory-based testing devices market estimates and forecast, 2018 - 2030
- Fig. 21 Point-of-care (POC) testing devices estimates and forecast, 2018 - 2030
- Fig. 22 HbA1c testing devices market: Technology movement analysis
- Fig. 23 HbA1c testing devices market: Technology outlook and key takeaways
- Fig. 24 Immunoassays market estimates and forecast, 2018 - 2030
- Fig. 25 Chromatography estimates and forecast, 2018 - 2030
- Fig. 26 Enzymatic Assays market estimates and forecast, 2018 - 2030
- Fig. 27 Boronate Affinity Chromatography market estimates and forecast, 2018 - 2030
- Fig. 28 High-Performance Liquid Chromatography market estimates and forecast, 2018 - 2030
- Fig. 29 Others estimates and forecast, 2018 - 2030
- Fig. 30 HbA1c testing devices market: End-use movement analysis
- Fig. 31 HbA1c testing devices market: End-use outlook and key takeaways
- Fig. 32 Hospitals & clinics market estimates and forecast, 2018 - 2030
- Fig. 33 Diagnostic laboratories estimates and forecast, 2018 - 2030
- Fig. 34 Homecare settings market estimates and forecast, 2018 - 2030
- Fig. 35 Global HbA1c testing devices market: Regional movement analysis
- Fig. 36 Global HbA1c testing devices market: Regional outlook and key takeaways
- Fig. 37 Global HbA1c testing devices market share and leading players
- Fig. 38 North America, by country
- Fig. 39 North America
- Fig. 40 North America market estimates and forecasts, 2018 - 2030
- Fig. 41 U.S. key country dynamics
- Fig. 42 U.S. market estimates and forecasts, 2018 - 2030
- Fig. 43 Canada key country dynamics
- Fig. 44 Canada market estimates and forecasts, 2018 - 2030
- Fig. 45 Europe
- Fig. 46 Europe market estimates and forecasts, 2018 - 2030
- Fig. 47 UK key country dynamics
- Fig. 48 UK market estimates and forecasts, 2018 - 2030
- Fig. 49 Germany key country dynamics
- Fig. 50 Germany market estimates and forecasts, 2018 - 2030
- Fig. 51 France key country dynamics
- Fig. 52 France market estimates and forecasts, 2018 - 2030
- Fig. 53 Italy key country dynamics
- Fig. 54 Italy market estimates and forecasts, 2018 - 2030
- Fig. 55 Spain key country dynamics
- Fig. 56 Spain market estimates and forecasts, 2018 - 2030
- Fig. 57 Denmark key country dynamics
- Fig. 58 Denmark market estimates and forecasts, 2018 - 2030
- Fig. 59 Sweden key country dynamics
- Fig. 60 Sweden market estimates and forecasts, 2018 - 2030
- Fig. 61 Norway key country dynamics
- Fig. 62 Norway market estimates and forecasts, 2018 - 2030
- Fig. 63 Asia Pacific
- Fig. 64 Asia Pacific market estimates and forecasts, 2018 - 2030
- Fig. 65 China key country dynamics
- Fig. 66 China market estimates and forecasts, 2018 - 2030
- Fig. 67 Japan key country dynamics
- Fig. 68 Japan market estimates and forecasts, 2018 - 2030
- Fig. 69 India key country dynamics
- Fig. 70 India market estimates and forecasts, 2018 - 2030
- Fig. 71 Thailand key country dynamics
- Fig. 72 Thailand market estimates and forecasts, 2018 - 2030
- Fig. 73 South Korea key country dynamics
- Fig. 74 South Korea market estimates and forecasts, 2018 - 2030
- Fig. 75 Australia key country dynamics
- Fig. 76 Australia market estimates and forecasts, 2018 - 2030
- Fig. 77 Latin America
- Fig. 78 Latin America market estimates and forecasts, 2018 - 2030
- Fig. 79 Brazil key country dynamics
- Fig. 80 Brazil market estimates and forecasts, 2018 - 2030
- Fig. 81 Mexico key country dynamics
- Fig. 82 Mexico market estimates and forecasts, 2018 - 2030
- Fig. 83 Argentina key country dynamics
- Fig. 84 Argentina market estimates and forecasts, 2018 - 2030
- Fig. 85 Middle East and Africa
- Fig. 86 Middle East and Africa market estimates and forecasts, 2018 - 2030
- Fig. 87 South Africa key country dynamics
- Fig. 88 South Africa market estimates and forecasts, 2018 - 2030
- Fig. 89 Saudi Arabia key country dynamics
- Fig. 90 Saudi Arabia market estimates and forecasts, 2018 - 2030
- Fig. 91 UAE key country dynamics
- Fig. 92 UAE market estimates and forecasts, 2018 - 2030
- Fig. 93 Kuwait key country dynamics
- Fig. 94 Kuwait market estimates and forecasts, 2018 - 2030
- Fig. 95 Market share of key market players - HbA1c testing devices market
HbA1c Testing Devices Market Growth & Trends:
The global HbA1c testing devices market size is anticipated to reach USD 3.15 billion by 2030, growing at a CAGR of 6.48% from 2024 to 2030, according to a new report by Grand View Research, Inc. The global market for HbA1c testing devices is witnessing significant growth, driven by the rising prevalence of diabetes and the demand for accurate and efficient monitoring solutions. According to the CDC, in 2021, 38.4 million Americans, or 11.6% of the population, had diabetes. This includes 2 million Americans with type 1 diabetes, approximately 304,000 of whom are children and adolescents. The report also highlights that 1.2 million Americans are diagnosed with diabetes annually, underscoring the persistent need for diabetes care and management. HbA1c testing plays a crucial role in diabetes management by providing valuable insights into long-term blood sugar control and assisting healthcare providers in optimizing patient treatment plans.
The importance of glycemic control and HbA1c testing devices drive market growth by increasing demand for accurate monitoring tools, fostering innovation, and expanding market reach, particularly in low- and middle-income countries. Inadequate control leads to complications, impacting patients' quality of life and healthcare costs. According to a study, the Diabetes Control and Complications Trial (DCCT) shows that strict glucose control reduces long-term complications, highlighting the cost-effectiveness of intensive treatment. In low- and middle-income countries (LMICs), owing to late diagnosis, glycemic control and patient education become crucial. This, in turn, propels the need for early diagnosis, systematic complication screening, and timely treatment intensification to lower costs compared to inpatient care and treatment of complications.
The market is witnessing a notable shift towards Point-of-care (POC) testing devices, which offer rapid results, enabling timely interventions and personalized treatment plans. POC devices are gaining extensive popularity in homecare settings, enabling patients to monitor their HbA1c levels conveniently and effectively. This trend reflects the growing emphasis on patient-centric care and adoption of remote monitoring solutions in healthcare.
Key market players such as ARKRAY, Inc., Abbott Laboratories, Chek, Siemens Healthineers, Danaher Corporation, Bio-Rad Laboratories, Inc., Trivitron Healthcare, EKF Diagnostics, and Tosoh Corporation are at the forefront of innovation in HbA1c testing devices. These companies are constantly focusing on developing advanced technologies to enhance the accuracy, speed, and user-friendliness of HbA1c testing devices, catering to the evolving needs of healthcare professionals and patients. For instance, in August 2022 , DxGen Corp. and Precision Diabetes, Inc. partnered to launch Epithod AutoDx, an automatic point-of-care analyzer for diabetes tests, including HbA1c. With a user-friendly design, it enables rapid results in settings such as physician offices and clinics, addressing the growing demand for on-site testing amid the pandemic.
HbA1c Testing Devices Market Report Highlights:
- Point-of-care (POC) testing devices dominated the HbA1c type of device segment and are anticipated to grow at the fastest CAGR over the forecast period owing to their vital use for informed decision-making in diabetes management.
- Immunoassays dominated the technology segment attributed to rapid and simplified results associated with the technology.
- The hospitals and clinics end-use segment dominated the market in 2023, which is attributed to the well-equipped advanced technology and infrastructure available in hospitals and clinics to handle these devices effectively.
- North America dominated the HbA1c testing devices industry owing to factors such as advanced healthcare infrastructure, rising prevalence of target diseases, and favorable regulatory environment.
Table of Contents
Chapter 1. Methodology and Scope
- 1.1. Market Segmentation & Scope
- 1.2. Segment Definitions
- 1.2.1. Type of Device
- 1.2.2. Technology
- 1.2.3. End-use
- 1.2.4. Regional scope
- 1.2.5. Estimates and forecasts timeline
- 1.3. Research Methodology
- 1.4. Information Procurement
- 1.4.1. Purchased database
- 1.4.2. GVR's internal database
- 1.4.3. Secondary sources
- 1.4.4. Primary research
- 1.4.5. Details of primary research
- 1.4.5.1. Data for primary interviews in North America
- 1.4.5.2. Data for primary interviews in Europe
- 1.4.5.3. Data for primary interviews in Asia Pacific
- 1.4.5.4. Data for primary interviews in Latin America
- 1.4.5.5. Data for Primary interviews in MEA
- 1.5. Information or Data Analysis
- 1.5.1. Data analysis models
- 1.6. Market Formulation & Validation
- 1.7. Model Details
- 1.7.1. Commodity flow analysis (Model 1)
- 1.7.2. Approach 1: Commodity flow approach
- 1.7.3. Volume price analysis (Model 2)
- 1.7.4. Approach 2: Volume price analysis
- 1.8. List of Secondary Sources
- 1.9. List of Primary Sources
- 1.10. Objectives
Chapter 2. Executive Summary
- 2.1. Market Outlook
- 2.2. Segment Outlook
- 2.2.1. Type of device
- 2.2.2. Technology outlook
- 2.2.3. End-use outlook
- 2.2.4. Regional outlook
- 2.3. Competitive Insights
Chapter 3. HbA1c Testing Devices Market Variables, Trends & Scope
- 3.1. Market Lineage Outlook
- 3.1.1. Parent market outlook
- 3.1.2. Related/ancillary market outlook
- 3.2. Market Dynamics
- 3.2.1. Market driver analysis
- 3.2.1.1. Increasing prevalence of diabetes
- 3.2.1.2. Technological advancement
- 3.2.1.3. Development of novel testing methodologies.
- 3.2.2. Market restraint analysis
- 3.2.2.1. High cost of devices
- 3.2.2.2. Stringent regulatory policies
- 3.2.1. Market driver analysis
- 3.3. HbA1c Testing Devices Market Analysis Tools
- 3.3.1. Industry Analysis - Porter's
- 3.3.1.1. Supplier power
- 3.3.1.2. Buyer power
- 3.3.1.3. Substitution threat
- 3.3.1.4. Threat of new entrant
- 3.3.1.5. Competitive rivalry
- 3.3.2. PESTEL Analysis
- 3.3.2.1. Political landscape
- 3.3.2.2. Technological landscape
- 3.3.2.3. Economic landscape
- 3.3.3. Pricing Analysis
- 3.3.4. Volume Analysis (Laboratory-based Testing Devices)
- 3.3.1. Industry Analysis - Porter's
Chapter 4. HbA1c Testing Devices Market: Type of Device Estimates & Trend Analysis
- 4.1. Segment Dashboard
- 4.2. Global HbA1c Testing Devices Market Movement Analysis
- 4.3. Global HbA1c Testing Devices Market by Type of Device Outlook
- 4.4. Laboratory-based Testing Devices
- 4.4.1. Laboratory-based Testing Devices market estimates and forecasts 2018 to 2030 (USD Million)
- 4.5. Point-of-care (POC) Testing Devices
- 4.5.1 Point-of-care (POC) testing devices market estimates and forecasts 2018 to 2030 (USD Million)
Chapter 5. HbA1c Testing Devices Market: Technology Estimates & Trend Analysis
- 5.1. Segment Dashboard
- 5.2. Global HbA1c Testing Devices Market Movement Analysis
- 5.3. Global HbA1c Testing Devices Market by Technology Outlook
- 5.4. Immunoassays
- 5.4.1. Immunoassays market estimates and forecasts, 2018 to 2030 (USD Million)
- 5.5. Chromatography
- 5.5.1. Chromatography market estimates and forecasts, 2018 to 2030 (USD Million)
- 5.6. Enzymatic Assays
- 5.6.1. Enzymatic Assays market estimates and forecasts, 2018 to 2030 (USD Million)
- 5.7. Boronate Affinity Chromatography
- 5.7.1. Boronate Affinity Chromatography market estimates and forecasts, 2018 to 2030 (USD Million)
- 5.8. High-Performance Liquid Chromatography
- 5.8.1. High-Performance Liquid Chromatography market estimates and forecasts, 2018 to 2030 (USD Million)
- 5.9. Others
- 5.9.1. Others market estimates and forecasts, 2018 to 2030 (USD Million)
Chapter 6. HbA1c Testing Devices Market: End-use Estimates & Trend Analysis
- 6.1. Segment Dashboard
- 6.2. Global HbA1c Testing Devices Market Movement Analysis
- 6.3. Global HbA1c Testing Devices Market by End-use Outlook
- 6.4. Hospitals & Clinics
- 6.4.1. Hospitals & Clinics market estimates and forecasts, 2018 to 2030 (USD Million)
- 6.5. Diagnostic Laboratories
- 6.5.1. Diagnostic laboratories market estimates and forecasts, 2018 to 2030 (USD Million)
- 6.6. Homecare Settings
- 6.6.1. Homecare Settings market estimates and forecasts, 2018 to 2030 (USD Million)
Chapter 7. HbA1c Testing Devices Market: Regional Estimates & Trend Analysis by Type of Device, Technology, and End-use
- 7.1. Regional Dashboard
- 7.2. Market Size & Forecasts Trend Analysis, 2018 to 2030:
- 7.3. North America
- 7.3.1. U.S.
- 7.3.1.1. Key country dynamics
- 7.3.1.2. Regulatory framework/ reimbursement structure
- 7.3.1.3. Competitive scenario
- 7.3.1.4. U.S. market estimates and forecasts, 2018 to 2030 (USD Million)
- 7.3.2. Canada
- 7.3.2.1. Key country dynamics
- 7.3.2.2. Regulatory framework/ reimbursement structure
- 7.3.2.3. Competitive scenario
- 7.3.2.4. Canada market estimates and forecasts, 2018 to 2030 (USD Million)
- 7.3.1. U.S.
- 7.4. Europe
- 7.4.1. UK
- 7.4.1.1. Key country dynamics
- 7.4.1.2. Regulatory framework/ reimbursement structure
- 7.4.1.3. Competitive scenario
- 7.4.1.4. UK market estimates and forecasts, 2018 to 2030 (USD Million)
- 7.4.2. Germany
- 7.4.2.1. Key country dynamics
- 7.4.2.2. Regulatory framework/ reimbursement structure
- 7.4.2.3. Competitive scenario
- 7.4.2.4. Germany market estimates and forecasts, 2018 to 2030 (USD Million)
- 7.4.3. France
- 7.4.3.1. Key country dynamics
- 7.4.3.2. Regulatory framework/ reimbursement structure
- 7.4.3.3. Competitive scenario
- 7.4.3.4. France market estimates and forecasts, 2018 to 2030 (USD Million)
- 7.4.4. Italy
- 7.4.4.1. Key country dynamics
- 7.4.4.2. Regulatory framework/ reimbursement structure
- 7.4.4.3. Competitive scenario
- 7.4.4.4. Italy market estimates and forecasts, 2018 to 2030 (USD Million)
- 7.4.5. Spain
- 7.4.5.1. Key country dynamics
- 7.4.5.2. Regulatory framework/ reimbursement structure
- 7.4.5.3. Competitive scenario
- 7.4.5.4. Spain market estimates and forecasts, 2018 to 2030 (USD Million)
- 7.4.6. Norway
- 7.4.6.1. Key country dynamics
- 7.4.6.2. Regulatory framework/ reimbursement structure
- 7.4.6.3. Competitive scenario
- 7.4.6.4. Norway market estimates and forecasts, 2018 to 2030 (USD Million)
- 7.4.7. Sweden
- 7.4.7.1. Key country dynamics
- 7.4.7.2. Regulatory framework/ reimbursement structure
- 7.4.7.3. Competitive scenario
- 7.4.7.4. Sweden market estimates and forecasts, 2018 to 2030 (USD Million)
- 7.4.8. Denmark
- 7.4.8.1. Key country dynamics
- 7.4.8.2. Regulatory framework/ reimbursement structure
- 7.4.8.3. Competitive scenario
- 7.4.8.4. Denmark market estimates and forecasts, 2018 to 2030 (USD Million)
- 7.4.1. UK
- 7.5. Asia Pacific
- 7.5.1. Japan
- 7.5.1.1. Key country dynamics
- 7.5.1.2. Regulatory framework/ reimbursement structure
- 7.5.1.3. Competitive scenario
- 7.5.1.4. Japan market estimates and forecasts, 2018 to 2030 (USD Million)
- 7.5.2. China
- 7.5.2.1. Key country dynamics
- 7.5.2.2. Regulatory framework/ reimbursement structure
- 7.5.2.3. Competitive scenario
- 7.5.2.4. China market estimates and forecasts, 2018 to 2030 (USD Million)
- 7.5.3. India
- 7.5.3.1. Key country dynamics
- 7.5.3.2. Regulatory framework/ reimbursement structure
- 7.5.3.3. Competitive scenario
- 7.5.3.4. India market estimates and forecasts, 2018 to 2030 (USD Million)
- 7.5.4. Australia
- 7.5.4.1. Key country dynamics
- 7.5.4.2. Regulatory framework/ reimbursement structure
- 7.5.4.3. Competitive scenario
- 7.5.4.4. Australia market estimates and forecasts, 2018 to 2030 (USD Million)
- 7.5.5. South Korea
- 7.5.5.1. Key country dynamics
- 7.5.5.2. Regulatory framework/ reimbursement structure
- 7.5.5.3. Competitive scenario
- 7.5.5.4. South Korea market estimates and forecasts, 2018 to 2030 (USD Million)
- 7.5.6. Thailand
- 7.5.6.1. Key country dynamics
- 7.5.6.2. Regulatory framework/ reimbursement structure
- 7.5.6.3. Competitive scenario
- 7.5.6.4. Thailand market estimates and forecasts, 2018 to 2030 (USD Million)
- 7.5.1. Japan
- 7.6. Latin America
- 7.6.1. Brazil
- 7.6.1.1. Key country dynamics
- 7.6.1.2. Regulatory framework/ reimbursement structure
- 7.6.1.3. Competitive scenario
- 7.6.1.4. Brazil market estimates and forecasts, 2018 to 2030 (USD Million)
- 7.6.2. Mexico
- 7.6.2.1. Key country dynamics
- 7.6.2.2. Regulatory framework/ reimbursement structure
- 7.6.2.3. Competitive scenario
- 7.6.2.4. Mexico market estimates and forecasts, 2018 to 2030 (USD Million)
- 7.6.3. Argentina
- 7.6.3.1. Key country dynamics
- 7.6.3.2. Regulatory framework/ reimbursement structure
- 7.6.3.3. Competitive scenario
- 7.6.3.4. Argentina market estimates and forecasts, 2018 to 2030 (USD Million)
- 7.6.1. Brazil
- 7.7. MEA
- 7.7.1. South Africa
- 7.7.1.1. Key country dynamics
- 7.7.1.2. Regulatory framework/ reimbursement structure
- 7.7.1.3. Competitive scenario
- 7.7.1.4. South Africa market estimates and forecasts, 2018 to 2030 (USD Million)
- 7.7.2. Saudi Arabia
- 7.7.2.1. Key country dynamics
- 7.7.2.2. Regulatory framework/ reimbursement structure
- 7.7.2.3. Competitive scenario
- 7.7.2.4. Saudi Arabia market estimates and forecasts, 2018 to 2030 (USD Million)
- 7.7.3. UAE
- 7.7.3.1. Key country dynamics
- 7.7.3.2. Regulatory framework/ reimbursement structure
- 7.7.3.3. Competitive scenario
- 7.7.3.4. UAE market estimates and forecasts, 2018 to 2030 (USD Million)
- 7.7.4. Kuwait
- 7.7.4.1. Key country dynamics
- 7.7.4.2. Regulatory framework/ reimbursement structure
- 7.7.4.3. Competitive scenario
- 7.7.4.4. Kuwait market estimates and forecasts, 2018 to 2030 (USD Million)
- 7.7.1. South Africa
Chapter 8. Competitive Landscape
- 8.1. Recent Developments & Impact Analysis, By Key Market Participants
- 8.2. Company/Competition Categorization
- 8.3. Vendor Landscape
- 8.3.1. List of key distributors and channel partners
- 8.3.2. Key customers
- 8.3.3. Key company market share analysis, 2023
- 8.3.4. Bio-Rad Laboratories, Inc.
- 8.3.4.1. Company overview
- 8.3.4.2. Financial performance
- 8.3.4.3. Product benchmarking
- 8.3.4.4. Strategic initiatives
- 8.3.5. Abbott
- 8.3.5.1. Company overview
- 8.3.5.2. Financial performance
- 8.3.5.3. Product benchmarking
- 8.3.5.4. Strategic initiatives
- 8.3.6. F. Hoffmann-La Roche Ltd
- 8.3.6.1. Company overview
- 8.3.6.2. Financial performance
- 8.3.6.3. Product benchmarking
- 8.3.6.4. Strategic initiatives
- 8.3.7. Siemens Healthineers AG
- 8.3.7.1. Company overview
- 8.3.7.2. Financial performance
- 8.3.7.3. Product benchmarking
- 8.3.7.4. Strategic initiatives
- 8.3.8. HUMAN
- 8.3.8.1. Company overview
- 8.3.8.2. Financial performance
- 8.3.8.3. Product benchmarking
- 8.3.8.4. Strategic initiatives
- 8.3.9. Trinity Biotech
- 8.3.9.1. Company overview
- 8.3.9.2. Financial performance
- 8.3.9.3. Product benchmarking
- 8.3.9.4. Strategic initiatives
- 8.3.10. Menarini Diagnostics s.r.l
- 8.3.10.1. Company overview
- 8.3.10.2. Financial performance
- 8.3.10.3. Product benchmarking
- 8.3.10.4. Strategic initiatives
- 8.3.11. SAKAE CO. LTD.
- 8.3.11.1. Company overview
- 8.3.11.2. Financial performance
- 8.3.11.3. Product benchmarking
- 8.3.11.4. Strategic initiatives
- 8.3.12. Ceragem Medisys Inc
- 8.3.12.1. Company overview
- 8.3.12.2. Financial performance
- 8.3.12.3. Product benchmarking
- 8.3.12.4. Strategic initiatives
- 8.3.13. SEKISUI MEDICAL CO., LTD.
- 8.3.13.1. Company overview
- 8.3.13.2. Financial performance
- 8.3.13.3. Product benchmarking
- 8.3.13.4. Strategic initiatives
