|
|
市場調査レポート
商品コード
1475007
シアネートエステル樹脂の市場規模、シェア、動向分析レポート:タイプ別、用途別、最終用途別、地域別、セグメント別予測、2024年~2030年Cyanate Ester Resin Market Size, Share & Trends Analysis Report By Type (Bisphenol Derivatives, Novolac), By Application (Composites, Adhesives, Coatings), By End-use, By Region, And Segment Forecasts, 2024 - 2030 |
||||||

|
|||||||
カスタマイズ可能
|
|||||||

| シアネートエステル樹脂の市場規模、シェア、動向分析レポート:タイプ別、用途別、最終用途別、地域別、セグメント別予測、2024年~2030年 |
|
出版日: 2024年04月30日
発行: Grand View Research
ページ情報: 英文 120 Pages
納期: 2~10営業日
|

全表示
- 概要
- 図表
- 目次
シアネートエステル樹脂市場の成長と動向:
Grand View Research, Inc.の最新レポートによると、シアネートエステル樹脂の世界市場は2030年までに7億2,215万米ドルに達すると予測され、2024~2030年のCAGRは10.3%で成長すると予測されています。
この市場を牽引しているのは、航空宇宙産業や軍事産業における高温樹脂へのニーズの高まりと、シアネートエステル樹脂の優れた機械的・熱的特性です。
さらに、他の樹脂と比較して、シアネートエステルは優れた強度と電気特性を記載しています。さらに、高温環境でも優れた性能を発揮します。航空宇宙産業や軍需産業からの高温樹脂に対する需要の高まりや、燃費の良い自動車に対するニーズの高まりが、市場成長の原動力となりそうです。
リサイクル技術が進歩するにつれて、世界市場はより多くのリサイクル成分を製品に組み込むよう適応し、より循環的で資源効率の高いアプローチに貢献しています。持続可能な実践を支援する政府の政策と政策が、シアネートエステルの需要をさらに押し上げます。循環型経済は、シアン酸エステル製品の回収、分離、再処理を奨励し、埋立地からの転換を促します。
シアネートエステル樹脂市場レポート・ハイライト
- タイプ別では、ビスフェノール誘導体セグメントが2023年に52.68%の最大収益シェアで市場をリードしています。BPAタイプのシアネートエステルは、高い熱安定性、機械的強度、電気的特性を備えており、エレクトロニクス、航空宇宙・防衛、自動車などの産業におけるいくつかの用途に最適です。
- 用途別では、複合材料セグメントが予測期間中にCAGR 10.5%の大幅な成長が見込まれています。
- 最終用途別では、航空宇宙・防衛セグメントが2023年に43.50%の最大収益シェアで市場を占めました。シアネートエステルは、その軽量性と高強度により、航空宇宙産業で広く使用されています。
- 燃費効率と環境の持続可能性を重視する傾向が強まっていることが、市場成長の主要促進要因となっています。
- アジア太平洋は2023年の売上高シェア28.28%で市場を独占しています。アジア太平洋における航空宇宙産業と電気・電子機器製造業の拡大が、シアネートエステルの需要を促進すると予測されています。
- 2023年1月、NEXX Technologiesは垂直統合型シアネートエステルプリプレグ技術であるEnduredge NTC-425を発表しました。
目次
第1章 調査手法と範囲
第2章 エグゼクティブサマリー
第3章 シアネートエステル樹脂市場の変数、動向、範囲
- 世界のシアネートエステル樹脂市場の展望
- 業界バリューチェーン分析
- 生のタイプの展望
- 技術概要
- 規制の枠組み
- 市場力学
- 市場ドライバー分析
- 市場抑制要因分析
- 業界の課題
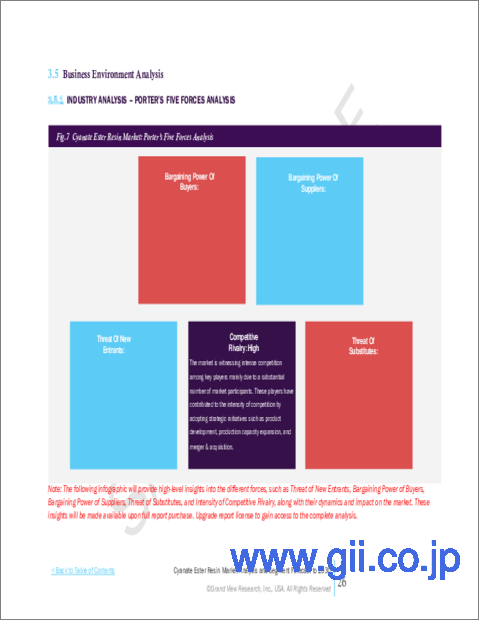
- ポーターのファイブフォース分析
- サプライヤーの力
- 買い手の力
- 代替の脅威
- 新規参入の脅威
- 競争企業間の敵対関係
- PESTEL分析
- 政治情勢
- 経済情勢
- 社会情勢
- 技術情勢
- 環境情勢
- 法的情勢
第4章 シアネートエステル樹脂市場:タイプ別展望予測と予測
- シアネートエステル樹脂市場:タイプ変動分析、2023年と2030年
- ビスフェノール誘導体
- ノボラック
- その他
第5章 シアネートエステル樹脂市場:用途展望の推定と予測
- シアネートエステル樹脂市場:用途分析、2023年と2030年
- 複合材料
- 接着剤
- コーティング
- その他
第6章 シアネートエステル樹脂市場:最終用途展望の推定と予測
- シアネートエステル樹脂市場:最終用途変動分析、2023年と2030年
- 航空宇宙と防衛
- 電気・電子
- 自動車
- その他
第7章 シアネートエステル樹脂市場の地域別展望の推定と予測
- 地域スナップショット
- シアネートエステル樹脂市場:地域変動分析、2023年と2030年
- 北米
- タイプ別、2018~2030年
- 最終用途別、2018~2030年
- 用途別、2018~2030年
- 米国
- カナダ
- メキシコ
- 欧州
- タイプ別、2018~2030年
- 最終用途別、2018~2030年
- 用途別、2018~2030年
- ドイツ
- フランス
- 英国
- イタリア
- アジア太平洋
- タイプ別、2018~2030年
- 最終用途別、2018~2030年
- 用途別、2018~2030年
- 中国
- 日本
- インド
- 中南米
- タイプ別、2018~2030年
- 最終用途別、2018~2030年
- 用途別、2018~2030年
- ブラジル
- アルゼンチン
- 中東・アフリカ
- タイプ別、2018~2030年
- 最終用途別、2018~2030年
- 用途別、2018~2030年
- GCC諸国
- 南アフリカ
第8章 競合情勢
- 主要市場参入企業による最近の動向と影響分析
- 企業分類
- 企業ランキング
- ヒートマップ分析
- 企業市場シェア分析、2023年
- 市場戦略
- ベンダー情勢
- 戦略マッピング
- 企業プロファイル/上場企業
List of Tables
- Table 1 Cyanate Ester Resin Market estimates and forecasts, 2018 - 2030 (Kilotons) (USD Million)
- Table 2 Cyanate Ester Resin Market estimates and forecasts by type, 2018 - 2030 (Kilotons) (USD Million)
- Table 3 Cyanate Ester Resin Market estimates and forecasts by Bisphenol derivatives 2018 - 2030 (Kilotons) (USD Million)
- Table 4 Cyanate Ester Resin Market estimates and forecasts by Novolac 2018 - 2030 (Kilotons) (USD Million)
- Table 5 Cyanate Ester Resin Market estimates and forecasts by others 2018 - 2030 (Kilotons) (USD Million)
- Table 6 Cyanate Ester Resin Market estimates and forecasts by application, 2018 - 2030 (Kilotons) (USD Million)
- Table 7 Cyanate Ester Resin Market estimates and forecasts in composites, 2018 - 2030 (Kilotons) (USD Million)
- Table 8 Cyanate Ester Resin Market estimates and forecasts in Adhesives, 2018 - 2030 (Kilotons) (USD Million)
- Table 9 Cyanate Ester Resin Market estimates and forecasts by coatings, 2018 - 2030 (Kilotons) (USD Million)
- Table 10 Cyanate Ester Resin Market estimates and forecasts in other applications, 2018 - 2030 (Kilotons) (USD Million)
- Table 11 Cyanate Ester Resin Market estimates and forecasts in end-use, 2018 - 2030 (Kilotons) (USD Million)
- Table 12 Cyanate Ester Resin Market estimates and forecasts in Aerospace & Defense, 2018 - 2030 (Kilotons) (USD Million)
- Table 13 Cyanate Ester Resin Market estimates and forecasts in Electrical & electronics, 2018 - 2030 (Kilotons) (USD Million)
- Table 14 Cyanate Ester Resin Market estimates and forecasts in Automotive, 2018 - 2030 (Kilotons) (USD Million)
- Table 15 Cyanate Ester Resin Market estimates and forecasts in Other end-use, 2018 - 2030 (Kilotons) (USD Million)
- Table 16 North America Cyanate Ester Resin Market estimates and forecasts, 2018 - 2030 (Kilotons) (USD Million)
- Table 17 North America Cyanate Ester Resin Market estimates and forecasts, by type, 2018 - 2030 (Kilotons) (USD Million)
- Table 18 North America Cyanate Ester Resin Market estimates and forecasts, by end-use, 2018 - 2030 (Kilotons) (USD Million)
- Table 19 North America Cyanate Ester Resin Market estimates and forecasts, by application, 2018 - 2030 (Kilotons) (USD Million)
- Table 20 U.S. Cyanate Ester Resin Market estimates and forecasts, 2018 - 2030 (Kilotons) (USD Million)
- Table 21 U.S. Cyanate Ester Resin Market estimates and forecasts, by type, 2018 - 2030 (Kilotons) (USD Million)
- Table 22 U.S. Cyanate Ester Resin Market estimates and forecasts, by end-use, 2018 - 2030 (Kilotons) (USD Million)
- Table 23 U.S. Cyanate Ester Resin Market estimates and forecasts, by application, 2018 - 2030 (Kilotons) (USD Million)
- Table 24 Canada Cyanate Ester Resin Market estimates and forecasts, 2018 - 2030 (Kilotons) (USD Million)
- Table 25 Canada Cyanate Ester Resin Market estimates and forecasts, by type, 2018 - 2030 (Kilotons) (USD Million)
- Table 26 Canada Cyanate Ester Resin Market estimates and forecasts, by end-use, 2018 - 2030 (Kilotons) (USD Million)
- Table 27 Canada Cyanate Ester Resin Market estimates and forecasts, by application, 2018 - 2030 (Kilotons) (USD Million)
- Table 28 Mexico Cyanate Ester Resin Market estimates and forecasts, 2018 - 2030 (Kilotons) (USD Million)
- Table 29 Mexico Cyanate Ester Resin Market estimates and forecasts, by type, 2018 - 2030 (Kilotons) (USD Million)
- Table 30 Mexico Cyanate Ester Resin Market estimates and forecasts, by end-use, 2018 - 2030 (Kilotons) (USD Million)
- Table 31 Mexico Cyanate Ester Resin Market estimates and forecasts, by application, 2018 - 2030 (Kilotons) (USD Million)
- Table 32 Europe Cyanate Ester Resin Market estimates and forecasts, 2018 - 2030 (Kilotons) (USD Million)
- Table 33 Europe Cyanate Ester Resin Market estimates and forecasts, by type, 2018 - 2030 (Kilotons) (USD Million)
- Table 34 Europe Cyanate Ester Resin Market estimates and forecasts, by end-use, 2018 - 2030 (Kilotons) (USD Million)
- Table 35 Europe Cyanate Ester Resin Market estimates and forecasts, by Application, 2018 - 2030 (Kilotons) (USD Million)
- Table 36 UK Cyanate Ester Resin Market estimates and forecasts, 2018 - 2030 (Kilotons) (USD Million)
- Table 37 UK Cyanate Ester Resin Market estimates and forecasts, by type, 2018 - 2030 (Kilotons) (USD Million)
- Table 38 UK Cyanate Ester Resin Market estimates and forecasts, by end-use, 2018 - 2030 (Kilotons) (USD Million)
- Table 39 UK Cyanate Ester Resin Market estimates and forecasts, by Application, 2018 - 2030 (Kilotons) (USD Million)
- Table 40 France Cyanate Ester Resin Market estimates and forecasts, 2018 - 2030 (Kilotons) (USD Million)
- Table 41 France Cyanate Ester Resin Market estimates and forecasts, by type, 2018 - 2030 (Kilotons) (USD Million)
- Table 42 France Cyanate Ester Resin Market estimates and forecasts, by end-use, 2018 - 2030 (Kilotons) (USD Million)
- Table 43 France Cyanate Ester Resin Market estimates and forecasts, by Application, 2018 - 2030 (Kilotons) (USD Million)
- Table 44 Italy Cyanate Ester Resin Market estimates and forecasts, 2018 - 2030 (Kilotons) (USD Million)
- Table 45 Italy Cyanate Ester Resin Market estimates and forecasts, by type, 2018 - 2030 (Kilotons) (USD Million)
- Table 46 Italy Cyanate Ester Resin Market estimates and forecasts, by end-use, 2018 - 2030 (Kilotons) (USD Million)
- Table 47 Italy Cyanate Ester Resin Market estimates and forecasts, by Application, 2018 - 2030 (Kilotons) (USD Million)
- Table 48 Asia Pacific Cyanate Ester Resin Market estimates and forecasts, 2018 - 2030 (Kilotons) (USD Million)
- Table 49 Asia Pacific Cyanate Ester Resin Market estimates and forecasts, by type, 2018 - 2030 (Kilotons) (USD Million)
- Table 50 Asia Pacific Cyanate Ester Resin Market estimates and forecasts, by end-use, 2018 - 2030 (Kilotons) (USD Million)
- Table 51 Asia Pacific Cyanate Ester Resin Market estimates and forecasts, by Application, 2018 - 2030 (Kilotons) (USD Million)
- Table 52 China Cyanate Ester Resin Market estimates and forecasts, 2018 - 2030 (Kilotons) (USD Million)
- Table 53 China Cyanate Ester Resin Market estimates and forecasts, by type, 2018 - 2030 (Kilotons) (USD Million)
- Table 54 China Cyanate Ester Resin Market estimates and forecasts, by end-use, 2018 - 2030 (Kilotons) (USD Million)
- Table 55 China Cyanate Ester Resin Market estimates and forecasts, by Application, 2018 - 2030 (Kilotons) (USD Million)
- Table 56 India Cyanate Ester Resin Market estimates and forecasts, 2018 - 2030 (Kilotons) (USD Million)
- Table 57 India Cyanate Ester Resin Market estimates and forecasts, by type, 2018 - 2030 (Kilotons) (USD Million)
- Table 58 India Cyanate Ester Resin Market estimates and forecasts, by end-use, 2018 - 2030 (Kilotons) (USD Million)
- Table 59 India Cyanate Ester Resin Market estimates and forecasts, by Application, 2018 - 2030 (Kilotons) (USD Million)
- Table 60 Japan Cyanate Ester Resin Market estimates and forecasts, 2018 - 2030 (Kilotons) (USD Million)
- Table 61 Japan Cyanate Ester Resin Market estimates and forecasts, by type, 2018 - 2030 (Kilotons) (USD Million)
- Table 62 Japan Cyanate Ester Resin Market estimates and forecasts, by end-use, 2018 - 2030 (Kilotons) (USD Million)
- Table 63 Japan Cyanate Ester Resin Market estimates and forecasts, by Application, 2018 - 2030 (Kilotons) (USD Million)
- Table 64 Central & South America Cyanate Ester Resin Market estimates and forecasts, 2018 - 2030 (Kilotons) (USD Million)
- Table 65 CSA Cyanate Ester Resin Market estimates and forecasts, by type, 2018 - 2030 (Kilotons) (USD Million)
- Table 66 CSA Cyanate Ester Resin Market estimates and forecasts, by end-use, 2018 - 2030 (Kilotons) (USD Million)
- Table 67 CSA Cyanate Ester Resin Market estimates and forecasts, by Application, 2018 - 2030 (Kilotons) (USD Million)
- Table 68 Brazil Cyanate Ester Resin Market estimates and forecasts, 2018 - 2030 (Kilotons) (USD Million)
- Table 69 Brazil Cyanate Ester Resin Market estimates and forecasts, by type, 2018 - 2030 (Kilotons) (USD Million)
- Table 70 Brazil Cyanate Ester Resin Market estimates and forecasts, by end-use, 2018 - 2030 (Kilotons) (USD Million)
- Table 71 Brazil Cyanate Ester Resin Market estimates and forecasts, by Application, 2018 - 2030 (Kilotons) (USD Million)
- Table 72 Argentina Cyanate Ester Resin Market estimates and forecasts, 2018 - 2030 (Kilotons) (USD Million)
- Table 73 Argentina Cyanate Ester Resin Market estimates and forecasts, by type, 2018 - 2030 (Kilotons) (USD Million)
- Table 74 Argentina Cyanate Ester Resin Market estimates and forecasts, by end-use, 2018 - 2030 (Kilotons) (USD Million)
- Table 75 Argentina Cyanate Ester Resin Market estimates and forecasts, by Application, 2018 - 2030 (Kilotons) (USD Million)
- Table 76 Middle East & Africa Cyanate Ester Resin Market estimates and forecasts, 2018 - 2030 (Kilotons) (USD Million)
- Table 77 MEA Cyanate Ester Resin Market estimates and forecasts, by type, 2018 - 2030 (Kilotons) (USD Million)
- Table 78 MEA Cyanate Ester Resin Market estimates and forecasts, by end-use, 2018 - 2030 (Kilotons) (USD Million)
- Table 79 MEA Cyanate Ester Resin Market estimates and forecasts, by Application, 2018 - 2030 (Kilotons) (USD Million)
- Table 80 UAE Cyanate Ester Resin Market estimates and forecasts, 2018 - 2030 (Kilotons) (USD Million)
- Table 81 UAE Cyanate Ester Resin Market estimates and forecasts, by type, 2018 - 2030 (Kilotons) (USD Million)
- Table 82 UAE Cyanate Ester Resin Market estimates and forecasts, by end-use, 2018 - 2030 (Kilotons) (USD Million)
- Table 83 UAE Cyanate Ester Resin Market estimates and forecasts, by Application, 2018 - 2030 (Kilotons) (USD Million)
- Table 84 Saudi Arabia Cyanate Ester Resin Market estimates and forecasts, 2018 - 2030 (Kilotons) (USD Million)
- Table 85 Saudi Arabia Cyanate Ester Resin Market estimates and forecasts, by type, 2018 - 2030 (Kilotons) (USD Million)
- Table 86 Saudi Arabia Cyanate Ester Resin Market estimates and forecasts, by end-use, 2018 - 2030 (Kilotons) (USD Million)
- Table 87 Saudi Arabia Cyanate Ester Resin Market estimates and forecasts, by Application, 2018 - 2030 (Kilotons) (USD Million)
- Table 88 South Africa Cyanate Ester Resin Market estimates and forecasts, 2018 - 2030 (Kilotons) (USD Million)
- Table 89 South Africa Cyanate Ester Resin Market estimates and forecasts, by type, 2018 - 2030 (Kilotons) (USD Million)
- Table 90 South Africa Cyanate Ester Resin Market estimates and forecasts, by end-use, 2018 - 2030 (Kilotons) (USD Million)
- Table 91 South Africa Cyanate Ester Resin Market estimates and forecasts, by Application, 2018 - 2030 (Kilotons) (USD Million)
List of Figures
- Fig. 1 Market segmentation
- Fig. 2 Information procurement
- Fig. 3 Data Analysis Models
- Fig. 4 Market Formulation and Validation
- Fig. 5 Market Snapshot
- Fig. 6 Segmental outlook- type, material, and application
- Fig. 7 Competitive outlook
- Fig. 8 Cyanate Ester Resin Market, 2018 - 2030 (Kilotons) (USD Million)
- Fig. 9 Value chain analysis
- Fig. 10 Market dynamics
- Fig. 11 Porter's Analysis
- Fig. 12 PESTEL Analysis
- Fig. 13 Cyanate Ester Resin Market, by type: Key takeaways
- Fig. 14 Cyanate Ester Resin Market, by type: Market share, 2023 & 2030
- Fig. 15 Cyanate Ester Resin Market, by application: Key takeaways
- Fig. 16 Cyanate Ester Resin Market, by application: Market share, 2023 & 2030
- Fig. 17 Cyanate Ester Resin Market, by end-use: Key takeaways
- Fig. 18 Cyanate Ester Resin Market, by end-use: Market share, 2023 & 2030
- Fig. 19 Cyanate Ester Resin Market, by region: Key takeaways
- Fig. 20 Cyanate Ester Resin Market, by region: Market share, 2023 & 2030
Cyanate Ester Resin Market Growth & Trends:
The global cyanate ester resin market is anticipated to reach USD 722.15 million by 2030 and is projected to grow at a CAGR of 10.3% from 2024 to 2030, according to a new report by Grand View Research, Inc. The market is primarily driven by the increasing need for high-temperature resins in the aerospace and military industries, as well as the exceptional mechanical and thermal properties of cyanate ester resin.
Moreover, compared to other resins, cyanate ester offers superior strength and electrical characteristics. Furthermore, it performs exceptionally well in high-temperature environments. The rising demand for high-temperature resins from the aerospace and military industries, as well as rising need for fuel-efficient automobiles, are likely to drive market growth.
As recycling technologies advance, the global market adapts to integrate more recycled content into its products, contributing to a more circular and resource-efficient approach. Government policies and regulations supporting sustainable practices further bolster the demand for cyanate ester. The circular economy encourages the collection, separation, and reprocessing of cyanate ester products, diverting them from landfills.
Cyanate Ester Resin Market Report Highlights:
- Based on type, the bisphenol derivatives segment led the market with the largest revenue share of 52.68% in 2023. BPA-type cyanate esters offers high thermal stability, mechanical strength, and electrical properties, making them ideal for several applications in industries such as electronics, aerospace & defense, and automobiles
- Based on application, the composites segment is expected to grow at a significant CAGR of 10.5% over the forecast period
- Based on end-use, the aerospace & defense segment held the market with the largest revenue share of 43.50% in 2023. Cyanate esters are widely used in aerospace industry owing to its lightweight qualities and high strength
- The increasing emphasis on fuel efficiency and environmental sustainability is the key driver of the market growth
- Asia Pacific dominated the market with the revenue share of 28.28% in 2023. The expanding aerospace and electrical & electronics manufacturing industry in Asia Pacific is anticipated to drive the requirement for cyanate ester
- In January 2023, NEXX Technologies unveiled the Enduredge NTC-425, a vertically integrated cyanate ester prepreg technology. This novel prepreg resin solution is unique in the composites sector due to its vertical integration and shop temperature out-time of 90-100 days (<75EsF), resulting in lower costs
Table of Contents
Chapter 1. Methodology and Scope
- 1.1. Market Segmentation & Scope
- 1.2. Market Definition
- 1.3. Information Procurement
- 1.3.1. Purchased Database
- 1.3.2. GVR's Internal Database
- 1.3.3. Secondary Sources & Third-Party Perspectives
- 1.3.4. Primary Research
- 1.4. Information Analysis
- 1.4.1. Data Analysis Models
- 1.5. Market Formulation & Data Visualization
- 1.6. Data Validation & Publishing
Chapter 2. Executive Summary
- 2.1. Market Insights
- 2.2. Segmental Outlook
- 2.3. Competitive Outlook
Chapter 3. Cyanate Ester Resin Market Variables, Trends & Scope
- 3.1. Global Cyanate Ester Resin Market Outlook
- 3.2. Industry Value Chain Analysis
- 3.2.1. Raw Type Outlook
- 3.3. Technology Overview
- 3.4. Regulatory Framework
- 3.5. Market Dynamics
- 3.5.1. Market Driver Analysis
- 3.5.2. Market Restraint Analysis
- 3.5.3. Industry Challenges
- 3.6. Porter's Five Forces Analysis
- 3.6.1. Supplier Power
- 3.6.2. Buyer Power
- 3.6.3. Substitution Threat
- 3.6.4. Threat from New Entrant
- 3.6.5. Competitive Rivalry
- 3.7. PESTEL Analysis
- 3.7.1. Political Landscape
- 3.7.2. Economic Landscape
- 3.7.3. Social Landscape
- 3.7.4. Technological Landscape
- 3.7.5. Environmental Landscape
- 3.7.6. Legal Landscape
Chapter 4. Cyanate Ester Resin Market: Type Outlook Estimates & Forecasts
- 4.1. Cyanate Ester Resin Market: Material Movement Analysis, 2023 & 2030
- 4.2. Bisphenol derivatives
- 4.2.1. Market estimates and forecast, 2018 - 2030 (Kilotons) (USD Million)
- 4.3. Novolac
- 4.3.1. Market estimates and forecast, 2018 - 2030 (Kilotons) (USD Million)
- 4.4. Others
- 4.4.1. Market estimates and forecast, 2018 - 2030 (Kilotons) (USD Million)
Chapter 5. Cyanate Ester Resin Market: Application Outlook Estimates & Forecasts
- 5.1. Cyanate Ester Resin Market: Application Analysis, 2023 & 2030
- 5.2. Composites
- 5.2.1. Market estimates and forecast, 2018 - 2030 (Kilotons) (USD Million)
- 5.3. Adhesives
- 5.3.1. Market estimates and forecast, 2018 - 2030 (Kilotons) (USD Million)
- 5.4. Coatings
- 5.4.1. Market estimates and forecast, 2018 - 2030 (Kilotons) (USD Million)
- 5.5. Other applications
- 5.5.1. Market estimates and forecast, 2018 - 2030 (Kilotons) (USD Million)
Chapter 6. Cyanate Ester Resin Market: End-Use Outlook Estimates & Forecasts
- 6.1. Cyanate Ester Resin Market: System Movement Analysis, 2023 & 2030
- 6.2. Aerospace & Defense
- 6.2.1. Market estimates and forecast, 2018 - 2030 (Kilotons) (USD Million)
- 6.3. Electrical & electronics
- 6.3.1. Market estimates and forecast, 2018 - 2030 (Kilotons) (USD Million)
- 6.4. Automotive
- 6.4.1. Market estimates and forecast, 2018 - 2030 (Kilotons) (USD Million)
- 6.5. Other end-use
- 6.5.1. Market estimates and forecast, 2018 - 2030 (Kilotons) (USD Million)
Chapter 7. Cyanate Ester Resin Market Regional Outlook Estimates & Forecasts
- 7.1. Regional Snapshot
- 7.2. Cyanate Ester Resin Market: Regional Movement Analysis, 2023 & 2030
- 7.3. North America
- 7.3.1. Market estimates and forecast, by type, 2018 - 2030 (Kilotons) (USD Million)
- 7.3.2. Market estimates and forecast, by end-use, 2018 - 2030 (Kilotons) (USD Million)
- 7.3.3. Market estimates and forecast, by application, 2018 - 2030 (Kilotons) (USD Million)
- 7.3.4. U.S.
- 7.3.4.1. Market estimates and forecast, by type, 2018 - 2030 (Kilotons) (USD Million)
- 7.3.4.2. Market estimates and forecast, by end-use, 2018 - 2030 (Kilotons) (USD Million)
- 7.3.4.3. Market estimates and forecast, by application, 2018 - 2030 (Kilotons) (USD Million)
- 7.3.5. Canada
- 7.3.5.1. Market estimates and forecast, by type, 2018 - 2030 (Kilotons) (USD Million)
- 7.3.5.2. Market estimates and forecast, by end-use, 2018 - 2030 (Kilotons) (USD Million)
- 7.3.5.3. Market estimates and forecast, by application, 2018 - 2030 (Kilotons) (USD Million)
- 7.3.6. Mexico
- 7.3.6.1. Market estimates and forecast, by type, 2018 - 2030 (Kilotons) (USD Million)
- 7.3.6.2. Market estimates and forecast, by end-use, 2018 - 2030 (Kilotons) (USD Million)
- 7.3.6.3. Market estimates and forecast, by application, 2018 - 2030 (Kilotons) (USD Million)
- 7.4. Europe
- 7.4.1. Market estimates and forecast, by type, 2018 - 2030 (Kilotons) (USD Million)
- 7.4.2. Market estimates and forecast, by end-use, 2018 - 2030 (Kilotons) (USD Million)
- 7.4.3. Market estimates and forecast, by application, 2018 - 2030 (Kilotons) (USD Million)
- 7.4.4. Germany
- 7.4.4.1. Market estimates and forecast, by type, 2018 - 2030 (Kilotons) (USD Million)
- 7.4.4.2. Market estimates and forecast, by end-use, 2018 - 2030 (Kilotons) (USD Million)
- 7.4.4.3. Market estimates and forecast, by application, 2018 - 2030 (Kilotons) (USD Million)
- 7.4.5. France
- 7.4.5.1. Market estimates and forecast, by type, 2018 - 2030 (Kilotons) (USD Million)
- 7.4.5.2. Market estimates and forecast, by end-use, 2018 - 2030 (Kilotons) (USD Million)
- 7.4.5.3. Market estimates and forecast, by application, 2018 - 2030 (Kilotons) (USD Million)
- 7.4.6. UK
- 7.4.6.1. Market estimates and forecast, by type, 2018 - 2030 (Kilotons) (USD Million)
- 7.4.6.2. Market estimates and forecast, by end-use, 2018 - 2030 (Kilotons) (USD Million)
- 7.4.6.3. Market estimates and forecast, by application, 2018 - 2030 (Kilotons) (USD Million)
- 7.4.7. Italy
- 7.4.7.1. Market estimates and forecast, by type, 2018 - 2030 (Kilotons) (USD Million)
- 7.4.7.2. Market estimates and forecast, by end-use, 2018 - 2030 (Kilotons) (USD Million)
- 7.4.7.3. Market estimates and forecast, by application, 2018 - 2030 (Kilotons) (USD Million)
- 7.5. Asia Pacific
- 7.5.1. Market estimates and forecast, by type, 2018 - 2030 (Kilotons) (USD Million)
- 7.5.2. Market estimates and forecast, by end-use, 2018 - 2030 (Kilotons) (USD Million)
- 7.5.3. Market estimates and forecast, by application, 2018 - 2030 (Kilotons) (USD Million)
- 7.5.4. China
- 7.5.4.1. Market estimates and forecast, by type, 2018 - 2030 (Kilotons) (USD Million)
- 7.5.4.2. Market estimates and forecast, by end-use, 2018 - 2030 (Kilotons) (USD Million)
- 7.5.4.3. Market estimates and forecast, by application, 2018 - 2030 (Kilotons) (USD Million)
- 7.5.5. Japan
- 7.5.5.1. Market estimates and forecast, by type, 2018 - 2030 (Kilotons) (USD Million)
- 7.5.5.2. Market estimates and forecast, by end-use, 2018 - 2030 (Kilotons) (USD Million)
- 7.5.5.3. Market estimates and forecast, by application, 2018 - 2030 (Kilotons) (USD Million)
- 7.5.6. India
- 7.5.6.1. Market estimates and forecast, by type, 2018 - 2030 (Kilotons) (USD Million)
- 7.5.6.2. Market estimates and forecast, by end-use, 2018 - 2030 (Kilotons) (USD Million)
- 7.5.6.3. Market estimates and forecast, by application, 2018 - 2030 (Kilotons) (USD Million)
- 7.6. Central & South America
- 7.6.1. Market estimates and forecast, by type, 2018 - 2030 (Kilotons) (USD Million)
- 7.6.2. Market estimates and forecast, by end-use, 2018 - 2030 (Kilotons) (USD Million)
- 7.6.3. Market estimates and forecast, by application, 2018 - 2030 (Kilotons) (USD Million)
- 7.6.4. Brazil
- 7.6.4.1. Market estimates and forecast, by type, 2018 - 2030 (Kilotons) (USD Million)
- 7.6.4.2. Market estimates and forecast, by end-use, 2018 - 2030 (Kilotons) (USD Million)
- 7.6.4.3. Market estimates and forecast, by application, 2018 - 2030 (Kilotons) (USD Million)
- 7.6.5. Argentina
- 7.6.5.1. Market estimates and forecast, by type, 2018 - 2030 (Kilotons) (USD Million)
- 7.6.5.2. Market estimates and forecast, by end-use, 2018 - 2030 (Kilotons) (USD Million)
- 7.6.5.3. Market estimates and forecast, by application, 2018 - 2030 (Kilotons) (USD Million)
- 7.7. Middle East & Africa
- 7.7.1. Market estimates and forecast, by type, 2018 - 2030 (Kilotons) (USD Million)
- 7.7.2. Market estimates and forecast, by end-use, 2018 - 2030 (Kilotons) (USD Million)
- 7.7.3. Market estimates and forecast, by application, 2018 - 2030 (Kilotons) (USD Million)
- 7.7.4. GCC Countries
- 7.7.4.1. Market estimates and forecast, by type, 2018 - 2030 (Kilotons) (USD Million)
- 7.7.4.2. Market estimates and forecast, by end-use, 2018 - 2030 (Kilotons) (USD Million)
- 7.7.4.3. Market estimates and forecast, by application, 2018 - 2030 (Kilotons) (USD Million)
- 7.7.5. South Africa
- 7.7.5.1. Market estimates and forecast, by type, 2018 - 2030 (Kilotons) (USD Million)
- 7.7.5.2. Market estimates and forecast, by end-use, 2018 - 2030 (Kilotons) (USD Million)
- 7.7.5.3. Market estimates and forecast, by application, 2018 - 2030 (Kilotons) (USD Million)
Chapter 8. Competitive Landscape
- 8.1. Recent Developments & Impact Analysis, By Key Market Participants
- 8.2. Company Categorization
- 8.3. Company Ranking
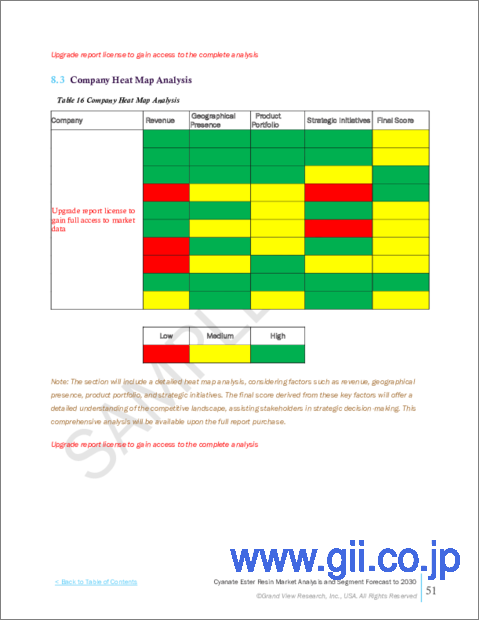
- 8.4. Heat Map Analysis
- 8.5. Company Market Share Analysis, 2023
- 8.6. Market Strategies
- 8.7. Vendor Landscape
- 8.7.1. List of raw material suppliers, key manufacturers, and distributors
- 8.7.2. List of prospective end-users
- 8.8. Strategy Mapping
- 8.9. Company Profiles/Listing
- 8.9.1. Huntsman International LLC
- 8.9.1.1. Company Overview
- 8.9.1.2. Financial Performance
- 8.9.1.3. Product Benchmarking
- 8.9.2. Arxada Ltd.
- 8.9.2.1. Company Overview
- 8.9.2.2. Financial Performance
- 8.9.2.3. Product Benchmarking
- 8.9.3. Toray Advanced Composites
- 8.9.3.1. Company Overview
- 8.9.3.2. Financial Performance
- 8.9.3.3. Product Benchmarking
- 8.9.4. Hexcel Corporation
- 8.9.4.1. Company Overview
- 8.9.4.2. Financial Performance
- 8.9.4.3. Product Benchmarking
- 8.9.5. MITSUBISHI GAS CHEMICAL COMPANY, INC
- 8.9.5.1. Company Overview
- 8.9.5.2. Financial Performance
- 8.9.5.3. Product Benchmarking
- 8.9.6. Henkel AG & Company
- 8.9.6.1. Company Overview
- 8.9.6.2. Financial Performance
- 8.9.6.3. Product Benchmarking
- 8.9.7. Novoset, LLC
- 8.9.7.1. Company Overview
- 8.9.7.2. Financial Performance
- 8.9.7.3. Product Benchmarking
- 8.9.8. Solvay
- 8.9.8.1. Company Overview
- 8.9.8.2. Financial Performance
- 8.9.8.3. Product Benchmarking
- 8.9.9. Syensqo
- 8.9.9.1. Company Overview
- 8.9.9.2. Financial Performance
- 8.9.9.3. Product Benchmarking
- 8.9.10. TenCate Advanced Composites
- 8.9.10.1. Company Overview
- 8.9.10.2. Financial Performance
- 8.9.10.3. Product Benchmarking
- 8.9.1. Huntsman International LLC
