|
|
市場調査レポート
商品コード
1474965
フローケミストリーの市場規模、シェア、動向分析レポート:リアクタータイプ別、用途別、地域別、セグメント予測、2024年~2030年Flow Chemistry Market Size, Share & Trends Analysis Report By Application, By Reactor Type, By Region, And Segment Forecasts, 2024 - 2030 |
||||||

|
|||||||
カスタマイズ可能
|
|||||||

| フローケミストリーの市場規模、シェア、動向分析レポート:リアクタータイプ別、用途別、地域別、セグメント予測、2024年~2030年 |
|
出版日: 2024年04月16日
発行: Grand View Research
ページ情報: 英文 154 Pages
納期: 2~10営業日
|

全表示
- 概要
- 図表
- 目次
フローケミストリー市場の成長と動向:
Grand View Research, Inc.の最新レポートによると、世界のフローケミストリー市場規模は2030年までに37億5,000万米ドルに達する見込みです。
2024年~2030年までのCAGRは11.6%で拡大する見込みです。バッチリアクターを上回る利点と製薬・化学産業への投資の増加が市場成長を後押しすると予測されています。
COVID-19の大流行により、顧客の要求に応じて汎用化学品から特殊化学品に移行する必要性が加速しています。さらに、パンデミックによるサプライチェーンの混乱により、連続製造の採用が増加しており、予測期間中にフローケミストリーの需要が増大すると予想されます。
ゴミ排出量の大幅な削減と再生不可能な工業方法の根絶は、世界の環境問題です。その結果、主要国では環境破壊を緩和するための政策を実施しています。いくつかの政府は、温室効果ガス排出削減目標を達成するための政策を実施しています。
連続攪拌タンク(CST)リアクターシステムは、操作にほとんど人が関与する必要がなく、その結果、導入に伴う人件費が削減されます。さらに、どちらのリアクターシステムも生産率が高く、生産コストの削減につながります。前述の要因は、予測期間中にCSTリアクターシステムの需要を押し上げる可能性が高いです。
製薬業界の成長は、強力な医薬品や希少医薬品の増加により、数年前から市場にプラスの影響を与えています。さらに、プロセスの安全性、投資コストの削減、品質基準の必要性が、予測期間中にフローケミストリーの需要を増大させる可能性が高いです。
特殊化学、ファインケミカル、その他の石油化学産業におけるマイクロリアクターの使用拡大により、環境への影響が大幅に削減されるとともに、製造コストも削減されています。マイクロリアクターは、バルク化学産業でスチレンや酸化エチレン(EO)などの化学品の製造に使用されており、市場の成長を後押しすると期待されています。
フローケミストリー市場レポートハイライト
- 医薬品用途分野は、再生可能エネルギー源を使用する技術への需要の高まりと製造コストの削減により、収益面で2024年~2030年にかけて有利なCAGR 12.0%で拡大すると予測されます。
- リアクタータイプ別では、マイクロリアクターが、環境に優しい装置と選択性を高める能力に対する需要の増加により、予測期間中に大きな成長を遂げると予想されます。
- アジア太平洋地域は、石油化学産業の急成長と、韓国とオーストラリアにおける学術・研究の活発化により、推定・予測期間中にCAGR 12.4%で大きく拡大すると見られています。
- 欧州では、ドイツが2023年に33.3%以上の最大の売上シェアを占めました。これは、先進的なインフラ、製薬・化学産業の成長、熟練した労働力によるものです。
- Am Technology、CEM Corp.、Biotage AB、Syrris Ltd.、Vapourtec Ltd.などの企業は、アジア太平洋地域でのM&Aや生産能力拡大により、地理的プレゼンスを強化しようとしています。
目次
第1章 フローケミストリー市場:調査手法と範囲
第2章 フローケミストリー市場:エグゼクティブサマリー
- 市場見通し
- セグメント別見通し
- 競合考察
第3章 フローケミストリー市場:変数、動向、範囲
- 市場セグメンテーションと範囲
- 浸透と成長の見込みマッピング
- バリューチェーン分析
- 規制の枠組み
- 市場力学
- ポーターの5つの力モデル
- PESTEL分析
- COVID-19:影響分析
第4章 フローケミストリー市場:リアクタータイプの推定・動向分析
- リアクタータイプの変動分析と市場シェア、2023年・2030年
- リアクタータイプ別、2018年~2030年
- CSTR
- プラグフローリアクター
- マイクロリアクター
- 充填層リアクター
- その他
第5章 フローケミストリー市場:用途の推定・動向分析
- 用途の変動分析と市場シェア、2023年・2030年
- 用途別、2018年~2030年
- 医薬品
- 化学薬品
- 学術研究
- 石油化学製品
- その他
第6章 フローケミストリー市場:地域の推定・動向分析
- 地域変動分析と市場シェア、2023年・2030年
- 北米
- 米国
- カナダ
- メキシコ
- 欧州
- 英国
- ドイツ
- フランス
- ロシア
- イタリア
- アジア太平洋地域
- 中国
- インド
- 日本
- 韓国
- オーストラリア
- 中南米
- ブラジル
- アルゼンチン
- 中東・アフリカ
- サウジアラビア
- アラブ首長国連邦
第7章 フローケミストリー市場-競合情勢
- 主要市場参入企業による最近の動向と影響分析
- ベンダー情勢
- 企業分類
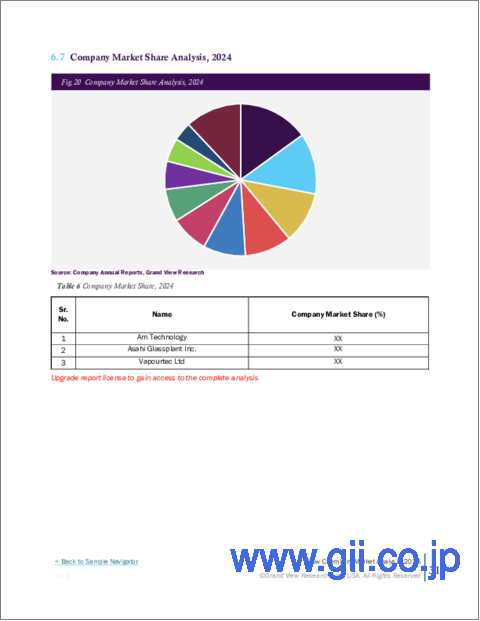
- 企業市場シェア分析、2023年
- 企業の市場ポジショニング
- 競合ダッシュボード分析
- 企業ヒートマップ分析、2023年
- 戦略マッピング
- 企業プロファイル
- Am Technology
- Asahi Glassplant Inc.
- METTLER TOLEDO
- Vapourtec Ltd.
- ThalesNano Inc.
- HEL Group
- Uniqsis Ltd.
- Ehrfeld Mikrotechnik BTS
- Future Chemistry Holding BV
- Corning Incorporated
- Parr Instrument Company
- Amar Equipment Pvt. Ltd.
- FABEX ENGINEERING PVT. LTD.
- Dalton Pharma Services
List of Tables
- Table 1 Flow chemistry market 2018 - 2030 (USD Million)
- Table 2 Flow chemistry market estimates and forecasts, by reactor type, 2018 - 2030 (USD Million)
- Table 3 CSTR flow chemistry market estimates and forecasts, 2018 - 2030 (USD Million)
- Table 4 Plug flow reactor flow chemistry market estimates and forecasts, 2018 - 2030 (USD Million)
- Table 5 Microreactor flow chemistry market estimates and forecasts, 2018 - 2030 (USD Million)
- Table 6 Packed-bed reactor flow chemistry market estimates and forecasts, 2018 - 2030 (USD Million)
- Table 7 Others flow chemistry market estimates and forecasts, 2018 - 2030 (USD Million)
- Table 8 Flow chemistry market estimates and forecasts, by application, 2018 - 2030 (USD Million)
- Table 9 Pharmaceuticals flow chemistry market estimates and forecasts, 2018 - 2030 (USD Million)
- Table 10 Chemicals flow chemistry market estimates and forecasts, 2018 - 2030 (USD Million)
- Table 11 Academia & research flow chemistry market estimates and forecasts, 2018 - 2030 (USD Million)
- Table 12 Petrochemicals flow chemistry market estimates and forecasts, 2018 - 2030 (USD Million)
- Table 13 Others flow chemistry market estimates and forecasts, 2018 - 2030 (USD Million)
- Table 14 North America flow chemistry market estimates and forecasts, 2018 - 2030, (USD Million)
- Table 15 North America flow chemistry market estimates and forecasts, by reactor type, 2018 - 2030 (USD Million)
- Table 16 North America flow chemistry market estimates and forecasts, by application, 2018 - 2030 (USD Million)
- Table 17 U.S. Macroeconomic Outlook
- Table 18 U.S. flow chemistry market estimates and forecasts, 2018 - 2030 (USD Million)
- Table 19 U.S. flow chemistry market estimates and forecasts, by reactor type, 2018 - 2030 (USD Million)
- Table 20 U.S. flow chemistry market estimates and forecasts, by application, 2018 - 2030 (USD Million)
- Table 21 Canada Macroeconomic Outlook
- Table 22 Canada flow chemistry market estimates and forecasts, 2018 - 2030 (USD Million)
- Table 23 Canada flow chemistry market estimates and forecasts, by reactor type, 2018 - 2030 (USD Million)
- Table 24 Canada flow chemistry market estimates and forecasts, by application, 2018 - 2030 (USD Million)
- Table 25 Mexico Macroeconomic Outlook
- Table 26 Mexico flow chemistry market estimates and forecasts, 2018 - 2030 (USD Million)
- Table 27 Mexico flow chemistry market estimates and forecasts, by reactor type, 2018 - 2030 (USD Million)
- Table 28 Mexico flow chemistry market estimates and forecasts, by application, 2018 - 2030 (USD Million)
- Table 29 Europe flow chemistry market estimates and forecasts, 2018 - 2030 (USD Million)
- Table 30 Europe flow chemistry market estimates and forecasts, by reactor type, 2018 - 2030 (USD Million)
- Table 31 Europe flow chemistry market estimates and forecasts, by application, 2018 - 2030 (USD Million)
- Table 32 UK Macroeconomic Outlook
- Table 33 UK flow chemistry market estimates and forecasts, 2018 - 2030 (USD Million)
- Table 34 UK flow chemistry market estimates and forecasts, by reactor type, 2018 - 2030 (USD Million)
- Table 35 UK flow chemistry market estimates and forecasts, by application, 2018 - 2030 (USD Million)
- Table 36 Germany Macroeconomic Outlook
- Table 37 Germany flow chemistry market estimates and forecasts, 2018 - 2030 (USD Million)
- Table 38 Germany flow chemistry market estimates and forecasts, by reactor type, 2018 - 2030 (USD Million)
- Table 39 Germany flow chemistry market estimates and forecasts, by application, 2018 - 2030 (USD Million)
- Table 40 France Macroeconomic Outlook
- Table 41 France flow chemistry market estimates and forecasts, 2018 - 2030 (USD Million)
- Table 42 France flow chemistry market estimates and forecasts, by reactor type, 2018 - 2030 (USD Million)
- Table 43 France flow chemistry market estimates and forecasts, by application, 2018 - 2030 (USD Million)
- Table 44 Russia Macroeconomic Outlook
- Table 45 Russia flow chemistry market estimates and forecasts, 2018 - 2030 (USD Million)
- Table 46 Russia flow chemistry market estimates and forecasts, by reactor type, 2018 - 2030 (USD Million)
- Table 47 Russia flow chemistry market estimates and forecasts, by application, 2018 - 2030 (USD Million)
- Table 48 Italy Macroeconomic Outlook
- Table 49 Italy flow chemistry market estimates and forecasts, 2018 - 2030 (USD Million)
- Table 50 Italy flow chemistry market estimates and forecasts, by reactor type, 2018 - 2030 (USD Million)
- Table 51 Italy flow chemistry market estimates and forecasts, by application, 2018 - 2030 (USD Million)
- Table 52 Asia Pacific flow chemistry market estimates and forecasts, 2018 - 2030 (USD Million)
- Table 53 Asia Pacific flow chemistry market estimates and forecasts, by reactor type, 2018 - 2030 (USD Million)
- Table 54 Asia Pacific flow chemistry market estimates and forecasts, by application, 2018 - 2030 (USD Million)
- Table 55 China Macroeconomic Outlook
- Table 56 China flow chemistry market estimates and forecasts, 2018 - 2030 (USD Million)
- Table 57 China flow chemistry market estimates and forecasts, by reactor type, 2018 - 2030 (USD Million)
- Table 58 China flow chemistry market estimates and forecasts, by application, 2018 - 2030 (USD Million)
- Table 59 India Macroeconomic Outlook
- Table 60 India flow chemistry market estimates and forecasts, 2018 - 2030 (USD Million)
- Table 61 India flow chemistry market estimates and forecasts, by reactor type, 2018 - 2030 (USD Million)
- Table 62 India flow chemistry market estimates and forecasts, by application, 2018 - 2030 (USD Million)
- Table 63 Japan Macroeconomic Outlook
- Table 64 Japan flow chemistry market estimates and forecasts, 2018 - 2030 (USD Million)
- Table 65 Japan flow chemistry market estimates and forecasts, by reactor type, 2018 - 2030 (USD Million)
- Table 66 Japan flow chemistry market estimates and forecasts, by application, 2018 - 2030 (USD Million)
- Table 67 India Macroeconomic Outlook
- Table 68 India flow chemistry market estimates and forecasts, 2018 - 2030 (USD Million)
- Table 69 India flow chemistry market estimates and forecasts, by reactor type, 2018 - 2030 (USD Million)
- Table 70 India flow chemistry market estimates and forecasts, by application, 2018 - 2030 (USD Million)
- Table 71 South Korea flow chemistry market estimates and forecasts, by reactor type, 2018 - 2030 (USD Million)
- Table 72 South Korea flow chemistry market estimates and forecasts, by application, 2018 - 2030 (USD Million)
- Table 73 Australia flow chemistry market estimates and forecasts, by reactor type, 2018 - 2030 (USD Million)
- Table 74 Australia flow chemistry market estimates and forecasts, by application, 2018 - 2030 (USD Million)
- Table 75 Central & South America flow chemistry market estimates and forecasts, 2018 - 2030 (USD Million)
- Table 76 Central & South America flow chemistry market estimates and forecasts, by reactor type, 2018 - 2030 (USD Million)
- Table 77 Central & South America flow chemistry market estimates and forecasts, by application, 2018 - 2030 (USD Million)
- Table 78 Brazil Macroeconomic Outlook
- Table 79 Brazil flow chemistry market estimates and forecasts, 2018 - 2030 (USD Million)
- Table 80 Brazil flow chemistry market estimates and forecasts, by reactor type, 2018 - 2030 (USD Million)
- Table 81 Brazil flow chemistry market estimates and forecasts, by application, 2018 - 2030 (USD Million)
- Table 82 Argentina Macroeconomic Outlook
- Table 83 Argentina flow chemistry market estimates and forecasts, 2018 - 2030 (USD Million)
- Table 84 Argentina flow chemistry market estimates and forecasts, by reactor type, 2018 - 2030 (USD Million)
- Table 85 Argentina flow chemistry market estimates and forecasts, by application, 2018 - 2030 (USD Million)
- Table 86 Middle East & Africa flow chemistry market estimates and forecasts, 2018 - 2030 (USD Million)
- Table 87 Middle East & Africa flow chemistry market estimates and forecasts, by reactor type, 2018 - 2030 (USD Million)
- Table 88 Middle East & Africa flow chemistry market estimates and forecasts, by application, 2018 - 2030 (USD Million)
- Table 89 Saudi Arabia flow chemistry market estimates and forecasts, by reactor type, 2018 - 2030 (USD Million)
- Table 90 Saudi Arabia flow chemistry market estimates and forecasts, by application, 2018 - 2030 (USD Million)
- Table 91 UAE Macroeconomic Outlook
- Table 92 UAE flow chemistry market estimates and forecasts, 2018 - 2030 (USD Million)
- Table 93 UAE flow chemistry market estimates and forecasts, by reactor type, 2018 - 2030 (USD Million)
- Table 94 UAE flow chemistry market estimates and forecasts, by application, 2018 - 2030 (USD Million)
List of Figures
- Fig. 1 Market research process
- Fig. 2 Data triangulation techniques
- Fig. 3 Primary research pattern
- Fig. 4 Market research approaches
- Fig. 5 QFD modeling for market share assessment
- Fig. 6 Information Procurement
- Fig. 7 Market Formulation and Validation
- Fig. 8 Data Validating & Publishing
- Fig. 9 Market Segmentation & Scope
- Fig. 10 Flow Chemistry Market Snapshot
- Fig. 11 Reactor Type Segment Snapshot
- Fig. 12 Application Segment Snapshot
- Fig. 13 Competitive Landscape Snapshot
- Fig. 14 Flow Chemistry Market Value, 2023 (USD Million)
- Fig. 15 Flow Chemistry Market - Value Chain Analysis
- Fig. 16 Flow Chemistry Market - Market Dynamics
- Fig. 17 Flow Chemistry Market - PORTER's Analysis
- Fig. 18 Flow Chemistry Market - PESTEL Analysis
- Fig. 19 Flow Chemistry Market Estimates & Forecasts, By Reactor Type: Key Takeaways
- Fig. 20 Flow Chemistry Market Share, By Reactor Type, 2023 & 2030
- Fig. 21 CSTR Market Estimates & Forecasts, 2018 - 2030 (USD Million)
- Fig. 22 Plug Flow Reactor Market Estimates & Forecasts, 2018 - 2030 (USD Million)
- Fig. 23 Microreactor Market Estimates & Forecasts, 2018 - 2030 (USD Million)
- Fig. 24 Packed-Bed Reactor Market Estimates & Forecasts, 2018 - 2030 (USD Million)
- Fig. 25 Other Reactors Market Estimates & Forecasts, 2018 - 2030 (USD Million)
- Fig. 26 Flow Chemistry Market Estimates & Forecasts, By Application: Key Takeaways
- Fig. 27 Flow Chemistry Market Share, By Application, 2023 & 2030
- Fig. 28 Flow Chemistry Market Estimates & Forecasts, in Pharmaceuticals, 2018 - 2030 (USD Million)
- Fig. 29 Flow Chemistry Market Estimates & Forecasts, in Chemicals, 2018 - 2030 (USD Million)
- Fig. 30 Flow Chemistry Market Estimates & Forecasts, in Academia & Research, 2018 - 2030 (USD Million)
- Fig. 31 Flow Chemistry Market Estimates & Forecasts, in Petrochemicals, 2018 - 2030 (USD Million)
- Fig. 32 Flow Chemistry Market Estimates & Forecasts, in Other Applications, 2018 - 2030 (USD Million)
- Fig. 33 North America Flow Chemistry Market Estimates & Forecasts, 2018 - 2030 (USD Million)
- Fig. 34 North America Flow Chemistry Market Estimates & Forecasts, By Reactor Type, 2018 - 2030 (USD Million)
- Fig. 35 North America Flow Chemistry Market Estimates & Forecasts, By Application, 2018 - 2030 (USD Million)
- Fig. 36 U.S. Flow Chemistry Market Estimates & Forecasts, 2018 - 2030 (USD Million)
- Fig. 37 U.S. Flow Chemistry Market Estimates & Forecasts, By Reactor Type, 2018 - 2030 (USD Million)
- Fig. 38 U.S. Flow Chemistry Market Estimates & Forecasts, By Application, 2018 - 2030 (USD Million)
- Fig. 39 Canada Flow Chemistry Market Estimates & Forecasts, 2018 - 2030 (USD Million)
- Fig. 40 Canada Flow Chemistry Market Estimates & Forecasts, By Reactor Type, 2018 - 2030 (USD Million)
- Fig. 41 Canada Flow Chemistry Market Estimates & Forecasts, By Application, 2018 - 2030 (USD Million)
- Fig. 42 Mexico Flow Chemistry Market Estimates & Forecasts, 2018 - 2030 (USD Million)
- Fig. 43 Mexico Flow Chemistry Market Estimates & Forecasts, By Reactor Type, 2018 - 2030 (USD Million)
- Fig. 44 Mexico Flow Chemistry Market Estimates & Forecasts, By Application, 2018 - 2030 (USD Million)
- Fig. 45 Europe Flow Chemistry Market Estimates & Forecasts, 2018 - 2030 (USD Million)
- Fig. 46 Europe Flow Chemistry Market Estimates & Forecasts, By Reactor Type, 2018 - 2030 (USD Million)
- Fig. 47 Europe Flow Chemistry Market Estimates & Forecasts, By Application, 2018 - 2030 (USD Million)
- Fig. 48 UK Flow Chemistry Market Estimates & Forecasts, 2018 - 2030 (USD Million)
- Fig. 49 UK Flow Chemistry Market Estimates & Forecasts, By Reactor Type, 2018 - 2030 (USD Million)
- Fig. 50 UK Flow Chemistry Market Estimates & Forecasts, By Application, 2018 - 2030 (USD Million)
- Fig. 51 Germany Flow Chemistry Market Estimates & Forecasts, 2018 - 2030 (USD Million)
- Fig. 52 Germany Flow Chemistry Market Estimates & Forecasts, By Reactor Type, 2018 - 2030 (USD Million)
- Fig. 53 Germany Flow Chemistry Market Estimates & Forecasts, By Application, 2018 - 2030 (USD Million)
- Fig. 54 France Flow Chemistry Market Estimates & Forecasts, 2018 - 2030 (USD Million)
- Fig. 55 France Flow Chemistry Market Estimates & Forecasts, By Reactor Type, 2018 - 2030 (USD Million)
- Fig. 56 France Flow Chemistry Market Estimates & Forecasts, By Application, 2018 - 2030 (USD Million)
- Fig. 57 Russia Flow Chemistry Market Estimates & Forecasts, 2018 - 2030 (USD Million)
- Fig. 58 Russia Flow Chemistry Market Estimates & Forecasts, By Reactor Type, 2018 - 2030 (USD Million)
- Fig. 59 Russia Flow Chemistry Market Estimates & Forecasts, By Application, 2018 - 2030 (USD Million)
- Fig. 60 Italy Flow Chemistry Market Estimates & Forecasts, 2018 - 2030 (USD Million)
- Fig. 61 Italy Flow Chemistry Market Estimates & Forecasts, By Reactor Type, 2018 - 2030 (USD Million)
- Fig. 62 Italy Flow Chemistry Market Estimates & Forecasts, By Application, 2018 - 2030 (USD Million)
- Fig. 63 Asia Pacific Flow Chemistry Market Estimates & Forecasts, 2018 - 2030 (USD Million)
- Fig. 64 Asia Pacific Flow Chemistry Market Estimates & Forecasts, By Reactor Type, 2018 - 2030 (USD Million)
- Fig. 65 Asia Pacific Flow Chemistry Market Estimates & Forecasts, By Application, 2018 - 2030 (USD Million)
- Fig. 66 China Flow Chemistry Market Estimates & Forecasts, 2018 - 2030 (USD Million)
- Fig. 67 China Flow Chemistry Market Estimates & Forecasts, By Reactor Type, 2018 - 2030 (USD Million)
- Fig. 68 China Flow Chemistry Market Estimates & Forecasts, By Application, 2018 - 2030 (USD Million)
- Fig. 69 India Flow Chemistry Market Estimates & Forecasts, 2018 - 2030 (USD Million)
- Fig. 70 India Flow Chemistry Market Estimates & Forecasts, By Reactor Type, 2018 - 2030 (USD Million)
- Fig. 71 India Flow Chemistry Market Estimates & Forecasts, By Application, 2018 - 2030 (USD Million)
- Fig. 72 Japan Flow Chemistry Market Estimates & Forecasts, 2018 - 2030 (USD Million)
- Fig. 73 Japan Flow Chemistry Market Estimates & Forecasts, By Reactor Type, 2018 - 2030 (USD Million)
- Fig. 74 Japan Flow Chemistry Market Estimates & Forecasts, By Application, 2018 - 2030 (USD Million)
- Fig. 75 South Korea Flow Chemistry Market Estimates & Forecasts, 2018 - 2030 (USD Million)
- Fig. 76 South Korea Flow Chemistry Market Estimates & Forecasts, By Reactor Type, 2018 - 2030 (USD Million)
- Fig. 77 South Korea Flow Chemistry Market Estimates & Forecasts, By Application, 2018 - 2030 (USD Million)
- Fig. 78 Australia Flow Chemistry Market Estimates & Forecasts, 2018 - 2030 (USD Million)
- Fig. 79 Australia Flow Chemistry Market Estimates & Forecasts, By Reactor Type, 2018 - 2030 (USD Million)
- Fig. 80 Australia Flow Chemistry Market Estimates & Forecasts, By Application, 2018 - 2030 (USD Million)
- Fig. 81 Central & South America Flow Chemistry Market Estimates & Forecasts, 2018 - 2030 (USD Million)
- Fig. 82 Central & South America Flow Chemistry Market Estimates & Forecasts, By Reactor Type, 2018 - 2030 (USD Million)
- Fig. 83 Central & South America Flow Chemistry Market Estimates & Forecasts, By Application, 2018 - 2030 (USD Million)
- Fig. 84 Brazil Flow Chemistry Market Estimates & Forecasts, 2018 - 2030 (USD Million)
- Fig. 85 Brazil Flow Chemistry Market Estimates & Forecasts, By Reactor Type, 2018 - 2030 (USD Million)
- Fig. 86 Brazil Flow Chemistry Market Estimates & Forecasts, By Application, 2018 - 2030 (USD Million)
- Fig. 87 Argentina Flow Chemistry Market Estimates & Forecasts, 2018 - 2030 (USD Million)
- Fig. 88 Argentina Flow Chemistry Market Estimates & Forecasts, By Reactor Type, 2018 - 2030 (USD Million)
- Fig. 89 Argentina Flow Chemistry Market Estimates & Forecasts, By Application, 2018 - 2030 (USD Million)
- Fig. 90 Middle East & Africa Flow Chemistry Market Estimates & Forecasts, 2018 - 2030 (USD Million)
- Fig. 91 Middle East & Africa Flow Chemistry Market Estimates & Forecasts, By Reactor Type, 2018 - 2030 (USD Million)
- Fig. 92 Middle East & Africa Flow Chemistry Market Estimates & Forecasts, By Application, 2018 - 2030 (USD Million)
- Fig. 93 Saudi Arabia Flow Chemistry Market Estimates & Forecasts, 2018 - 2030 (USD Million)
- Fig. 94 Saudi Arabia Flow Chemistry Market Estimates & Forecasts, By Reactor Type, 2018 - 2030 (USD Million)
- Fig. 95 Saudi Arabia Flow Chemistry Market Estimates & Forecasts, By Application, 2018 - 2030 (USD Million)
- Fig. 96 UAE Flow Chemistry Market Estimates & Forecasts, 2018 - 2030 (USD Million)
- Fig. 97 UAE Flow Chemistry Market Estimates & Forecasts, By Reactor Type, 2018 - 2030 (USD Million)
- Fig. 98 UAE Flow Chemistry Market Estimates & Forecasts, By Application, 2018 - 2030 (USD Million)
- Fig. 99 Key Company Categorization
- Fig. 100 Company Market Positioning
- Fig. 101 Key Company Market Share Analysis, 2023
- Fig. 102 Strategy Mapping
Flow Chemistry Market Growth & Trends:
The global flow chemistry market size is expected to reach USD 3.75 billion by 2030, according to a new report by Grand View Research, Inc. It is expected to expand at a CAGR of 11.6% from 2024 to 2030. Advantages over batch reactors and growing investments in the pharmaceutical and chemical industries are projected to boost the market growth.
The COVID-19 pandemic has accelerated the need to move away from chemical commodities to specialty chemicals as per the requirement of customers. Moreover, the adoption of continuous manufacturing has increased due to the supply chain disruptions caused by the pandemic, which is expected to augment the demand for flow chemistry over the forecast period.
Significant reductions in trash output and the eradication of non-renewable industrial methods are global environmental concerns. As a result, major economies are enacting policies to mitigate environmental damage. Several governments are implementing policies to meet the targets for reducing greenhouse gas emissions.
Continuous Stirred Tank (CST) reactor systems require little human involvement to operate, resulting in reduced labor costs associated with their deployment. Furthermore, both reactor systems have a high output rate, which leads to reduced production costs. The aforementioned factors are likely to boost the demand for CST reactor systems over the forecast period.
The growing pharmaceutical industry has positively impacted the market for several years on account of the increase in the number of potent and orphan drugs. Moreover, the need for process safety, reduction of investment cost, and quality standards are likely to augment the demand for flow chemistry over the forecast period.
The growing use of microreactors in the specialized chemical, fine chemical, and other petrochemical industries has helped to significantly reduce environmental impact while also lowering manufacturing costs. Microreactors are used in the bulk chemicals industry to produce several chemicals such as styrene and Ethylene Oxide (EO), which is expected to boost the market growth.
Flow Chemistry Market Report Highlights:
- The pharmaceuticals application segment is anticipated to expand at a lucrative CAGR of 12.0% from 2024 to 2030, in terms of revenue, due to the growing demand for technology that uses renewable energy sources and reduced manufacturing cost
- By reactor type, microreactor is expected to witness significant growth over the forecast owing to the increasing demand for environmentally-friendly equipment and the ability to increase selectivity
- Asia Pacific is estimated to expand at a significant CAGR of 12.4% over the forecast period on account of the rapidly growing petrochemical industries and a rise in academia and research in South Korea and Australi
- In Europe, Germany accounted for the largest revenue share of over 33.3% in 2023 owing to the advanced infrastructure, growing pharmaceutical and chemical industries, and skilled workforce
- Companies such as Am Technology, CEM Corp., Biotage AB, Syrris Ltd., and Vapourtec Ltd. are strategizing to strengthen their geographic presence by mergers and acquisitions or capacity expansions in Asia Pacific
Table of Contents
Chapter 1. Flow Chemistry Market: Methodology and Scope
- 1.1. Research Methodology
- 1.2. Research Scope & Assumption
- 1.3. Information Procurement
- 1.3.1. Purchased Database
- 1.3.2. GVR's Internal Database
- 1.3.3. Secondary Sources & Third-Party Perspectives
- 1.3.4. Primary Research
- 1.4. Information Analysis
- 1.4.1. Data Analysis Models
- 1.5. Market Formulation & Data Visualization
- 1.6. Data Validation & Publishing
Chapter 2. Flow Chemistry Market: Executive Summary
- 2.1. Market Outlook
- 2.2. Segmental Outlook
- 2.3. Competitive Insights
Chapter 3. Flow Chemistry Market: Variables, Trends & Scope
- 3.1. Market Segmentation & Scope
- 3.2. Penetration & Growth Prospect Mapping
- 3.3. Value Chain Analysis
- 3.4. Regulatory Framework
- 3.5. Market Dynamics
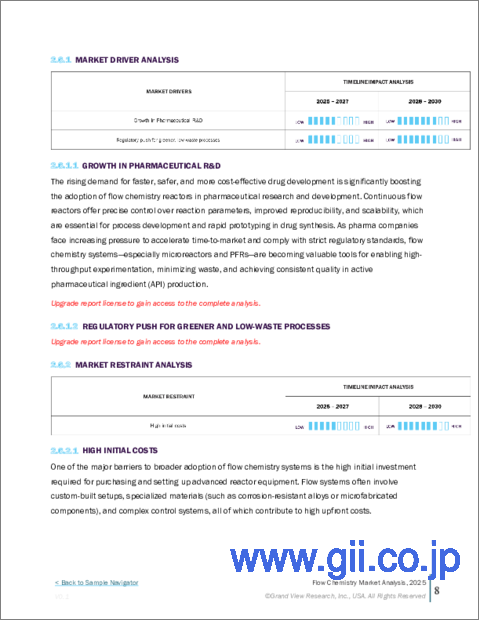
- 3.5.1. Market driver analysis
- 3.5.2. Market restraints analysis
- 3.5.3. Industry challenges
- 3.6. Porter's Five Forces Model
- 3.6.1. Supplier Power
- 3.6.2. Buyer Power
- 3.6.3. Threat of Substitutes
- 3.6.4. Threat from New Entrant
- 3.6.5. Competitive Rivalry
- 3.7. PESTEL Analysis
- 3.7.1. Political Landscape
- 3.7.2. Environmental Landscape
- 3.7.3. Social Landscape
- 3.7.4. Technology Landscape
- 3.7.5. Economic Landscape
- 3.7.6. Legal Landscape
- 3.8. COVID-19: Impact Analysis
Chapter 4. Flow Chemistry Market: Reactor Type Estimates & Trend Analysis
- 4.1. Reactor Type Movement Analysis & Market Share, 2023 & 2030
- 4.2. Flow Chemistry Market Estimates & Forecast, By Reactor Type, 2018 to 2030 (USD Million)
- 4.3. CSTR
- 4.3.1. Market estimates and forecasts, 2018 - 2030 (USD Million)
- 4.4. Plug Flow Reactor
- 4.4.1. Market estimates and forecasts, 2018 - 2030 (USD Million)
- 4.5. Microreactor
- 4.5.1. Market estimates and forecasts, 2018 - 2030 (USD Million)
- 4.6. Packed-Bed Reactor
- 4.6.1. Market estimates and forecasts, 2018 - 2030 (USD Million)
- 4.7. Others
- 4.7.1. Market estimates and forecasts, 2018 - 2030 (USD Million)
Chapter 5. Flow Chemistry Market: Application Estimates & Trend Analysis
- 5.1. Application Movement Analysis & Market Share, 2023 & 2030
- 5.2. Flow Chemistry Market Estimates & Forecast, By Application, 2018 to 2030 (USD Million)
- 5.3. Pharmaceuticals
- 5.3.1. Market estimates and forecasts, 2018 - 2030 (USD Million)
- 5.4. Chemicals
- 5.4.1. Market estimates and forecasts, 2018 - 2030 (USD Million)
- 5.5. Academia & Research
- 5.5.1. Market estimates and forecasts, 2018 - 2030 (USD Million)
- 5.6. Petrochemicals
- 5.6.1. Market estimates and forecasts, 2018 - 2030 (USD Million)
- 5.7. Others
- 5.7.1. Market estimates and forecasts, 2018 - 2030 (USD Million)
Chapter 6. Flow Chemistry Market: Regional Estimates & Trend Analysis
- 6.1. Regional Movement Analysis & Market Share, 2023 & 2030
- 6.2. North America
- 6.2.1. North America Flow Chemistry Market Estimates & Forecast, 2018 - 2030 (USD Million)
- 6.2.2. North America Flow Chemistry Market Estimates & Forecast, By Reactor Type, 2018 - 2030 (USD Million)
- 6.2.3. North America Flow Chemistry Market Estimates & Forecast, By Application, 2018 - 2030 (USD Million)
- 6.2.4. U.S.
- 6.2.4.1. Key country dynamics
- 6.2.4.2. U.S. flow chemistry market estimates & forecast, 2018 - 2030 (USD Million)
- 6.2.4.3. U.S. flow chemistry market estimates & forecast, By Reactor Type, 2018 - 2030 (USD Million)
- 6.2.4.4. U.S. flow chemistry market estimates & forecast, By Application, 2018 - 2030 (USD Million)
- 6.2.5. Canada
- 6.2.5.1. Key country dynamics
- 6.2.5.2. Canada flow chemistry market estimates & forecast, 2018 - 2030 (USD Million)
- 6.2.5.3. Canada flow chemistry market estimates & forecast, By Reactor Type, 2018 - 2030 (USD Million)
- 6.2.5.4. Canada flow chemistry market estimates & forecast, By Application, 2018 - 2030 (USD Million)
- 6.2.6. Mexico
- 6.2.6.1. Key country dynamics
- 6.2.6.2. Mexico flow chemistry market estimates & forecast, 2018 - 2030 (USD Million)
- 6.2.6.3. Mexico flow chemistry market estimates & forecast, By Reactor Type, 2018 - 2030 (USD Million)
- 6.2.6.4. Mexico flow chemistry market estimates & forecast, By Application, 2018 - 2030 (USD Million)
- 6.3. Europe
- 6.3.1. Europe Flow Chemistry Market Estimates & Forecast, 2018 - 2030 (USD Million)
- 6.3.2. Europe Flow Chemistry Market Estimates & Forecast, By Reactor Type, 2018 - 2030 (USD Million)
- 6.3.3. Europe Flow Chemistry Market Estimates & Forecast, By Application, 2018 - 2030 (USD Million)
- 6.3.4. UK
- 6.3.4.1. Key country dynamics
- 6.3.4.2. UK flow chemistry market estimates & forecast, 2018 - 2030 (USD Million)
- 6.3.4.3. UK flow chemistry market estimates & forecast, By Reactor Type, 2018 - 2030 (USD Million)
- 6.3.4.4. UK flow chemistry market estimates & forecast, By Application, 2018 - 2030 (USD Million)
- 6.3.5. Germany
- 6.3.5.1. Key country dynamics
- 6.3.5.2. Germany flow chemistry market estimates & forecast, 2018 - 2030 (USD Million)
- 6.3.5.3. Germany flow chemistry market estimates & forecast, By Reactor Type, 2018 - 2030 (USD Million)
- 6.3.5.4. Germany flow chemistry market estimates & forecast, By Application, 2018 - 2030 (USD Million)
- 6.3.6. France
- 6.3.6.1. Key country dynamics
- 6.3.6.2. France flow chemistry market estimates & forecast, 2018 - 2030 (USD Million)
- 6.3.6.3. France flow chemistry market estimates & forecast, By Reactor Type, 2018 - 2030 (USD Million)
- 6.3.6.4. France flow chemistry market estimates & forecast, By Application, 2018 - 2030 (USD Million)
- 6.3.7. Russia
- 6.3.7.1. Key country dynamics
- 6.3.7.2. Russia flow chemistry market estimates & forecast, 2018 - 2030 (USD Million)
- 6.3.7.3. Russia flow chemistry market estimates & forecast, By Reactor Type, 2018 - 2030 (USD Million)
- 6.3.7.4. Russia flow chemistry market estimates & forecast, By Application, 2018 - 2030 (USD Million)
- 6.3.8. Italy
- 6.3.8.1. Key country dynamics
- 6.3.8.2. Italy flow chemistry market estimates & forecast, 2018 - 2030 (USD Million)
- 6.3.8.3. Italy flow chemistry market estimates & forecast, By Reactor Type, 2018 - 2030 (USD Million)
- 6.3.8.4. Italy flow chemistry market estimates & forecast, By Application, 2018 - 2030 (USD Million)
- 6.4. Asia Pacific
- 6.4.1. Asia Pacific Flow Chemistry Market Estimates & Forecast, 2018 - 2030 (USD Million)
- 6.4.2. Asia Pacific Flow Chemistry Market Estimates & Forecast, By Reactor Type, 2018 - 2030 (USD Million)
- 6.4.3. Asia Pacific Flow Chemistry Market Estimates & Forecast, By Application, 2018 - 2030 (USD Million)
- 6.4.4. China
- 6.4.4.1. Key country dynamics
- 6.4.4.2. China flow chemistry market estimates & forecast, 2018 - 2030 (USD Million)
- 6.4.4.3. China flow chemistry market estimates & forecast, By Reactor Type, 2018 - 2030 (USD Million)
- 6.4.4.4. China flow chemistry market estimates & forecast, By Application, 2018 - 2030 (USD Million)
- 6.4.5. India
- 6.4.5.1. Key country dynamics
- 6.4.5.2. India flow chemistry market estimates & forecast, 2018 - 2030 (USD Million)
- 6.4.5.3. India flow chemistry market estimates & forecast, By Reactor Type, 2018 - 2030 (USD Million)
- 6.4.5.4. India flow chemistry market estimates & forecast, By Application, 2018 - 2030 (USD Million)
- 6.4.6. Japan
- 6.4.6.1. Key country dynamics
- 6.4.6.2. Japan flow chemistry market estimates & forecast, 2018 - 2030 (USD Million)
- 6.4.6.3. Japan flow chemistry market estimates & forecast, By Reactor Type, 2018 - 2030 (USD Million)
- 6.4.6.4. Japan flow chemistry market estimates & forecast, By Application, 2018 - 2030 (USD Million)
- 6.4.7. South Korea
- 6.4.7.1. Key country dynamics
- 6.4.7.2. South Korea flow chemistry market estimates & forecast, 2018 - 2030 (USD Million)
- 6.4.7.3. South Korea flow chemistry market estimates & forecast, By Reactor Type, 2018 - 2030 (USD Million)
- 6.4.7.4. South Korea flow chemistry market estimates & forecast, By Application, 2018 - 2030 (USD Million)
- 6.4.8. Australia
- 6.4.8.1. Key country dynamics
- 6.4.8.2. Australia flow chemistry market estimates & forecast, 2018 - 2030 (USD Million)
- 6.4.8.3. Australia flow chemistry market estimates & forecast, By Reactor Type, 2018 - 2030 (USD Million)
- 6.4.8.4. Australia flow chemistry market estimates & forecast, By Application, 2018 - 2030 (USD Million)
- 6.5. Central & South America
- 6.5.1. Central & South America Flow Chemistry Market Estimates & Forecast, 2018 - 2030 (USD Million)
- 6.5.2. Central & South America Flow Chemistry Market Estimates & Forecast, By Technology, 2018 - 2030 (USD Million)
- 6.5.3. Central & South America Flow Chemistry Market Estimates & Forecast, By Application, 2018 - 2030 (USD Million)
- 6.5.4. Brazil
- 6.5.4.1. Key country dynamics
- 6.5.4.2. Brazil flow chemistry market estimates & forecast, 2018 - 2030 (USD Million)
- 6.5.4.3. Brazil flow chemistry market estimates & forecast, By Reactor Type, 2018 - 2030 (USD Million)
- 6.5.4.4. Brazil flow chemistry market estimates & forecast, By Application, 2018 - 2030 (USD Million)
- 6.5.5. Argentina
- 6.5.5.1. Key country dynamics
- 6.5.5.2. Argentina flow chemistry market estimates & forecast, 2018 - 2030 (USD Million)
- 6.5.5.3. Argentina flow chemistry market estimates & forecast, By Reactor Type, 2018 - 2030 (USD Million)
- 6.5.5.4. Argentina flow chemistry market estimates & forecast, By Application, 2018 - 2030 (USD Million)
- 6.6. Middle East & Africa
- 6.6.1. Middle East & Africa Flow Chemistry Market Estimates & Forecast, 2018 - 2030 (USD Million)
- 6.6.2. Middle East & Africa Flow Chemistry Market Estimates & Forecast, By Reactor Type, 2018 - 2030 (USD Million)
- 6.6.3. Middle East & Africa Flow Chemistry Market Estimates & Forecast, By Application, 2018 - 2030 (USD Million)
- 6.6.4. Saudi Arabia
- 6.6.4.1. Key country dynamics
- 6.6.4.2. Saudi Arabia flow chemistry market estimates & forecast, 2018 - 2030 (USD Million)
- 6.6.4.3. Saudi Arabia flow chemistry market estimates & forecast, By Reactor Type, 2018 - 2030 (USD Million)
- 6.6.4.4. Saudi Arabia flow chemistry market estimates & forecast, By Application, 2018 - 2030 (USD Million)
- 6.6.5. UAE
- 6.6.5.1. Key country dynamics
- 6.6.5.2. UAE flow chemistry market estimates & forecast, 2018 - 2030 (USD Million)
- 6.6.5.3. UAE flow chemistry market estimates & forecast, By Reactor Type, 2018 - 2030 (USD Million)
- 6.6.5.4. UAE flow chemistry market estimates & forecast, By Application, 2018 - 2030 (USD Million)
Chapter 7. Flow Chemistry Market - Competitive Landscape
- 7.1. Recent Developments & Impact Analysis, By Key Market Participants
- 7.2. Vendor Landscape
- 7.3. Company Categorization
- 7.4. Company Market Share Analysis, 2023
- 7.5. Company Market Positioning
- 7.6. Competitive Dashboard Analysis
- 7.7. Company Heat Map Analysis, 2023
- 7.8. Strategy Mapping
- 7.8.1. Expansion
- 7.8.2. Mergers & Acquisition
- 7.8.3. Partnerships & Collaborations
- 7.8.4. New Product Launches
- 7.8.5. Research And Development
- 7.9. Company Profiles
- 7.9.1. Am Technology
- 7.9.1.1. Participant's overview
- 7.9.1.2. Financial performance
- 7.9.1.3. Product benchmarking
- 7.9.1.4. Recent developments
- 7.9.2. Asahi Glassplant Inc.
- 7.9.2.1. Participant's overview
- 7.9.2.2. Financial performance
- 7.9.2.3. Product benchmarking
- 7.9.2.4. Recent developments
- 7.9.3. METTLER TOLEDO
- 7.9.3.1. Participant's overview
- 7.9.3.2. Financial performance
- 7.9.3.3. Product benchmarking
- 7.9.3.4. Recent developments
- 7.9.4. Vapourtec Ltd.
- 7.9.4.1. Participant's overview
- 7.9.4.2. Financial performance
- 7.9.4.3. Product benchmarking
- 7.9.4.4. Recent developments
- 7.9.5. ThalesNano Inc.
- 7.9.5.1. Participant's overview
- 7.9.5.2. Financial performance
- 7.9.5.3. Product benchmarking
- 7.9.5.4. Recent developments
- 7.9.6. H.E.L. Group
- 7.9.6.1. Participant's overview
- 7.9.6.2. Financial performance
- 7.9.6.3. Product benchmarking
- 7.9.6.4. Recent developments
- 7.9.7. Uniqsis Ltd.
- 7.9.7.1. Participant's overview
- 7.9.7.2. Financial performance
- 7.9.7.3. Product benchmarking
- 7.9.7.4. Recent developments
- 7.9.8. Ehrfeld Mikrotechnik BTS
- 7.9.8.1. Participant's overview
- 7.9.8.2. Financial performance
- 7.9.8.3. Product benchmarking
- 7.9.8.4. Recent developments
- 7.9.9. Future Chemistry Holding BV
- 7.9.9.1. Participant's overview
- 7.9.9.2. Financial performance
- 7.9.9.3. Product benchmarking
- 7.9.9.4. Recent developments
- 7.9.10. Corning Incorporated
- 7.9.10.1. Participant's overview
- 7.9.10.2. Financial performance
- 7.9.10.3. Product benchmarking
- 7.9.10.4. Recent developments
- 7.9.11. Parr Instrument Company
- 7.9.11.1. Participant's overview
- 7.9.11.2. Financial performance
- 7.9.11.3. Product benchmarking
- 7.9.11.4. Recent developments
- 7.9.12. Amar Equipment Pvt. Ltd.
- 7.9.12.1. Participant's overview
- 7.9.12.2. Financial performance
- 7.9.12.3. Product benchmarking
- 7.9.12.4. Recent developments
- 7.9.13. FABEX ENGINEERING PVT. LTD.
- 7.9.13.1. Participant's overview
- 7.9.13.2. Financial performance
- 7.9.13.3. Product benchmarking
- 7.9.13.4. Recent developments
- 7.9.14. Dalton Pharma Services
- 7.9.14.1. Participant's overview
- 7.9.14.2. Financial performance
- 7.9.14.3. Product benchmarking
- 7.9.14.4. Recent developments
- 7.9.1. Am Technology

