|
|
市場調査レポート
商品コード
1588332
反芻動物メタン抑制の市場規模、シェア、動向分析レポート:製品別、動物タイプ別、地域別、セグメント別予測、2025年~2030年Ruminant Methane Reduction Market Size, Share & Trends Analysis Report By Product (Feed Additives/ Supplements), By Animal Type (Cattle, Sheep, Goats), By Region, And Segment Forecasts, 2025 - 2030 |
||||||
|
|||||||
カスタマイズ可能
|
|||||||

| 反芻動物メタン抑制の市場規模、シェア、動向分析レポート:製品別、動物タイプ別、地域別、セグメント別予測、2025年~2030年 |
|
出版日: 2024年10月16日
発行: Grand View Research
ページ情報: 英文 147 Pages
納期: 2~10営業日
|

全表示
- 概要
- 図表
- 目次
反芻動物メタン抑制市場の成長と動向:
Grand View Research, Inc.の最新レポートによると、世界の反芻動物メタン抑制の市場規模は2025年から2030年にかけてCAGR 6.34%を記録し、2030年までに42億2,000万米ドルに達すると予測されています。
畜産人口の増加が市場成長の主な要因です。インドのNational Dairy Development Boardによると、2023年のインドの家畜頭数は、ウシ科乳牛が約1億9,200万頭、アジア家畜水牛が約1億1,330万頭、合計3億750万頭です。
メタン削減のための革新的なソリューションを開発するための政府や市場関係者による研究開発(R&D)の高まりが、この市場の成長を促進すると予測されます。さらに、現在進行中の技術革新は、メタン排出を緩和するための費用対効果が高く効率的なソリューションを提供するため、反芻家畜のメタン削減需要を促進すると予想されます。
政府の厳しい規制や利害関係者の間で高まっている気候変動緩和に対する意識は、市場成長にとって極めて重要な要因の一部です。世界各国の政府は、農業セクターからのメタンを含む温室効果ガス排出削減の重要性を認識しつつあり、反芻動物からのメタン排出削減に役立つ慣行や技術の採用を農家に奨励するインセンティブを提供する政策を実施しています。
反芻動物メタン抑制市場レポート・ハイライト
- バイオテクノロジーと動物栄養学研究の研究開発と進歩の増加により、飼料添加物/サプリメントが2024年の収益シェア90%以上で製品セグメントを独占。
- 製品分野では、その他の製品分野が予測期間中に最も速いCAGRを記録する見込みです。
- 動物タイプ別では、メタン排出が環境に与える影響に対する意識の高まりと温室効果ガス排出削減に対する政府の関心の高まりにより、畜牛セクターが2024年に約80.08%の最大収益シェアを占めました。
- 動物タイプ別では、ヤギ部門が2025年から2030年にかけて最も速いCAGRを記録すると予測されています。ヤギからのメタン排出削減をターゲットとした技術革新と技術進歩が市場成長を促進すると予想されます。
- 北米は、メタン排出削減を目的とした投資と財政的インセンティブの増加により、2024年の市場を独占しました。一方、アジア太平洋は予測期間中に最も速いCAGRを示すと予想されます。
- 2023年4月、CH4 Global, Inc.は、メタン排出を最大90%削減するアスパラゴプシス(Asparagopsis)海藻を配合した独自のメタン削減飼料であるMethane Tamer Beef Feedlotを発表しました。
目次
第1章 調査手法と範囲
第2章 エグゼクティブサマリー
第3章 反芻動物メタン抑制市場の変数、動向、範囲
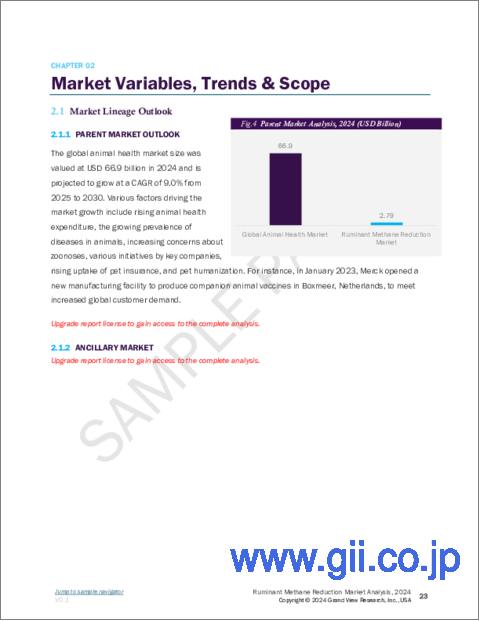
- 市場系統の見通し
- 親市場の見通し
- 関連/補助市場見通し
- 市場力学
- 市場促進要因分析
- 市場抑制要因分析
- 市場機会分析
- 市場の課題分析
- 反芻動物メタン抑制市場分析ツール
- ポーターの分析
- PESTEL分析
- 製品パイプライン分析
- COVID-19分析
第4章 反芻動物メタン抑制市場:製品別推定・動向分析
- セグメントダッシュボード
- 世界の反芻動物メタン抑制市場の変動分析
- 世界の反芻動物メタン抑制市場の規模と動向分析、製品別、2018~2030年
- 飼料添加物/サプリメント
- 植物由来
- 化学由来
- 微生物由来
- その他の製品
第5章 反芻動物メタン抑制市場:動物タイプ別推定・動向分析
- セグメントダッシュボード
- 世界の反芻動物メタン抑制市場の変動分析
- 世界の反芻動物メタン抑制市場の規模と動向分析、動物タイプ別、2018~2030年
- ウシ
- ヒツジ
- ヤギ
第6章 反芻動物メタン抑制市場:地域別推定・動向分析
- 地域ダッシュボード
- 市場規模と予測および動向分析、2018年から2030年北米
- 北米
- 米国
- カナダ
- メキシコ
- 欧州
- 英国
- ドイツ
- フランス
- イタリア
- スペイン
- スウェーデン
- デンマーク
- ノルウェー
- アジア太平洋
- 中国
- 日本
- インド
- 韓国
- オーストラリア
- タイ
- ラテンアメリカ
- ブラジル
- アルゼンチン
- 中東およびアフリカ
- サウジアラビア
- 南アフリカ
- アラブ首長国連邦
- クウェート
第7章 競合情勢
- 市場参入企業の分類
- 企業市況分析/ヒートマップ分析
- 2023年の企業市場シェアの推定分析
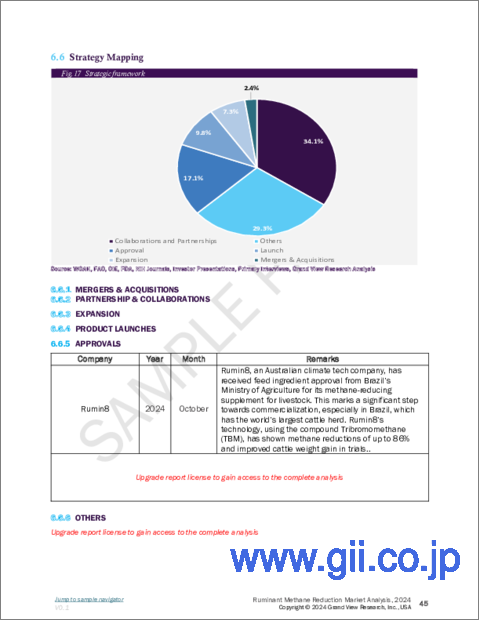
- 戦略マッピング
- 合併と買収
- パートナーシップとコラボレーション
- その他
- 企業プロファイル
- DSM
- Blue Ocean Barns.
- Alltech.
- CH4 GLOBAL, INC.
- Mootral
- Symbrosia Inc.
- Fonterra Co-operative Group Limited
- Elanco Animal Health Inc.
- Rumin8 Ltd
- Zelp Ltd
- Cargill, Incorporated
- FutureFeed
第8章 重要なポイント
List of Tables
- Table 1 List of Secondary Sources
- Table 2 List of Abbreviations
- Table 3 Global Ruminant Methane Reduction Market, by Product, 2018 - 2030 (USD Million)
- Table 4 Global Ruminant Methane Reduction Market, by Animal Type, 2018 - 2030 (USD Million)
- Table 5 Global Ruminant Methane Reduction Market, by Region, 2018 - 2030 (USD Million)
- Table 6 North America Ruminant Methane Reduction Market, by Country, 2018 - 2030 (USD Million)
- Table 7 North America Ruminant Methane Reduction Market, by Product, 2018 - 2030 (USD Million)
- Table 8 North America Ruminant Methane Reduction Market, by Animal Type, 2018 - 2030 (USD Million)
- Table 9 U.S. Ruminant Methane Reduction Market, by Product, 2018 - 2030 (USD Million)
- Table 10 U.S. Ruminant Methane Reduction Market, by Animal Type, 2018 - 2030 (USD Million)
- Table 11 Canada Ruminant Methane Reduction Market, by Product, 2018 - 2030 (USD Million)
- Table 12 Canada Ruminant Methane Reduction Market, by Animal Type, 2018 - 2030 (USD Million)
- Table 13 Mexico Ruminant Methane Reduction Market, by Product, 2018 - 2030 (USD Million)
- Table 14 Mexico Ruminant Methane Reduction Market, by Animal Type, 2018 - 2030 (USD Million)
- Table 15 Europe Ruminant Methane Reduction Market, by Country, 2018 - 2030 (USD Million)
- Table 16 Europe Ruminant Methane Reduction Market, by Product, 2018 - 2030 (USD Million)
- Table 17 Europe Ruminant Methane Reduction Market, by Animal Type, 2018 - 2030 (USD Million)
- Table 18 Germany Ruminant Methane Reduction Market, by Product, 2018 - 2030 (USD Million)
- Table 19 Germany Ruminant Methane Reduction Market, by Animal Type, 2018 - 2030 (USD Million)
- Table 20 UK Ruminant Methane Reduction Market, by Product, 2018 - 2030 (USD Million)
- Table 21 UK Ruminant Methane Reduction Market, by Animal Type, 2018 - 2030 (USD Million)
- Table 22 France Ruminant Methane Reduction Market, by Product, 2018 - 2030 (USD Million)
- Table 23 France Ruminant Methane Reduction Market, by Animal Type, 2018 - 2030 (USD Million)
- Table 24 Italy Ruminant Methane Reduction Market, by Product, 2018 - 2030 (USD Million)
- Table 25 Italy Ruminant Methane Reduction Market, by Animal Type, 2018 - 2030 (USD Million)
- Table 26 Spain Ruminant Methane Reduction Market, by Product, 2018 - 2030 (USD Million)
- Table 27 Spain Ruminant Methane Reduction Market, by Animal Type, 2018 - 2030 (USD Million)
- Table 28 Denmark Ruminant Methane Reduction Market, by Product, 2018 - 2030 (USD Million)
- Table 29 Denmark Ruminant Methane Reduction Market, by Animal Type, 2018 - 2030 (USD Million)
- Table 30 Sweden Ruminant Methane Reduction Market, by Product, 2018 - 2030 (USD Million)
- Table 31 Sweden Ruminant Methane Reduction Market, by Animal Type, 2018 - 2030 (USD Million)
- Table 32 Norway Ruminant Methane Reduction Market, by Product, 2018 - 2030 (USD Million)
- Table 33 Norway Ruminant Methane Reduction Market, by Animal Type, 2018 - 2030 (USD Million)
- Table 34 Asia Pacific Ruminant Methane Reduction Market, by Country, 2018 - 2030 (USD Million)
- Table 35 Asia Pacific Ruminant Methane Reduction Market, by Product, 2018 - 2030 (USD Million)
- Table 36 Asia Pacific Ruminant Methane Reduction Market, by Animal Type, 2018 - 2030 (USD Million)
- Table 37 China Ruminant Methane Reduction Market, by Product, 2018 - 2030 (USD Million)
- Table 38 China Ruminant Methane Reduction Market, by Animal Type, 2018 - 2030 (USD Million)
- Table 39 Japan Ruminant Methane Reduction Market, by Product, 2018 - 2030 (USD Million)
- Table 40 Japan Ruminant Methane Reduction Market, by Animal Type, 2018 - 2030 (USD Million)
- Table 41 India Ruminant Methane Reduction Market, by Product, 2018 - 2030 (USD Million)
- Table 42 India Ruminant Methane Reduction Market, by Animal Type, 2018 - 2030 (USD Million)
- Table 43 South Korea Ruminant Methane Reduction Market, by Product, 2018 - 2030 (USD Million)
- Table 44 South Korea Ruminant Methane Reduction Market, by Animal Type, 2018 - 2030 (USD Million)
- Table 45 Australia Ruminant Methane Reduction Market, by Product, 2018 - 2030 (USD Million)
- Table 46 Australia Ruminant Methane Reduction Market, by Animal Type, 2018 - 2030 (USD Million)
- Table 47 Thailand Ruminant Methane Reduction Market, by Product, 2018 - 2030 (USD Million)
- Table 48 Thailand Ruminant Methane Reduction Market, by Animal Type, 2018 - 2030 (USD Million)
- Table 49 Latin America Ruminant Methane Reduction Market, by Country, 2018 - 2030 (USD Million)
- Table 50 Latin America Ruminant Methane Reduction Market, by Product, 2018 - 2030 (USD Million)
- Table 51 Latin America Ruminant Methane Reduction Market, by Animal Type, 2018 - 2030 (USD Million)
- Table 52 Brazil Ruminant Methane Reduction Market, by Product, 2018 - 2030 (USD Million)
- Table 53 Brazil Ruminant Methane Reduction Market, by Animal Type, 2018 - 2030 (USD Million)
- Table 54 Argentina Ruminant Methane Reduction Market, by Product, 2018 - 2030 (USD Million)
- Table 55 Argentina Ruminant Methane Reduction Market, by Animal Type, 2018 - 2030 (USD Million)
- Table 56 Middle East & Africa Ruminant Methane Reduction Market, by Country, 2018 - 2030 (USD Million)
- Table 57 Middle East & Africa Ruminant Methane Reduction Market, by Product, 2018 - 2030 (USD Million)
- Table 58 Middle East & Africa Ruminant Methane Reduction Market, by Animal Type, 2018 - 2030 (USD Million)
- Table 59 South Africa Ruminant Methane Reduction Market, by Product, 2018 - 2030 (USD Million)
- Table 60 South Africa Ruminant Methane Reduction Market, by Animal Type, 2018 - 2030 (USD Million)
- Table 61 Saudi Arabia Ruminant Methane Reduction Market, by Product, 2018 - 2030 (USD Million)
- Table 62 Saudi Arabia Ruminant Methane Reduction Market, by Animal Type, 2018 - 2030 (USD Million)
- Table 63 UAE Ruminant Methane Reduction Market, by Product, 2018 - 2030 (USD Million)
- Table 64 UAE Ruminant Methane Reduction Market, by Animal Type, 2018 - 2030 (USD Million)
- Table 65 Kuwait Ruminant Methane Reduction Market, by Product, 2018 - 2030 (USD Million)
- Table 66 Kuwait Ruminant Methane Reduction Market, by Animal Type, 2018 - 2030 (USD Million)
- Table 67 Company Overview
- Table 68 Service Benchmarking
- Table 69 Financial Performance
- Table 70 Strategic Initiatives
List of Figures
- Fig. 1 Ruminant Methane Reduction Market segmentation
- Fig. 2 Market research process
- Fig. 3 Information procurement
- Fig. 4 Primary research pattern
- Fig. 5 Data Analysis Models
- Fig. 6 Market Formulation And Validation
- Fig. 7 Data Validating & Publishing
- Fig. 8 Volume-price analysis
- Fig. 9 Parent/ Related market analysis
- Fig. 10 Serviceable Available Market (SAM) analysis
- Fig. 11 Serviceable Obtainable Market (SOM) analysis
- Fig. 12 Market snapshot
- Fig. 13 Segment snapshot
- Fig. 14 Competitive landscape snapshot
- Fig. 15 Parent Market Analysis, 2024 (USD Million)
- Fig. 16 Ancillary market outlook, 2024
- Fig. 17 Ruminant methane reduction market dynamics
- Fig. 18 Ruminant methane reduction market: PORTER's analysis
- Fig. 19 Ruminant methane reduction market: PESTEL analysis
- Fig. 20 Ruminant methane reduction market by product: Key takeaways
- Fig. 21 Ruminant methane reduction market by product market share, 2025 & 2030
- Fig. 22 Feed additives/supplements market, 2018 - 2030 (USD Million)
- Fig. 23 Plant-based market, 2018 - 2030 (USD Million)
- Fig. 24 Chemical-based market, 2018 - 2030 (USD Million)
- Fig. 25 Microbial-based market, 2018 - 2030 (USD Million)
- Fig. 26 Other products market, 2018 - 2030 (USD Million)
- Fig. 27 Ruminant methane reduction market by animal type: Key takeaways
- Fig. 28 Ruminant methane reduction market by animal type, market share, 2024 & 2030
- Fig. 29 Cattle market, 2018 - 2030 (USD Million)
- Fig. 30 Sheep market, 2018 - 2030 (USD Million)
- Fig. 31 Goats market, 2018 - 2030 (USD Million)
- Fig. 32 Ruminant methane reduction market revenue, by region, 2024 & 2030 (USD Million)
- Fig. 33 Regional Market Share Analysis, 2024 & 2030
- Fig. 34 Regional Marketplace: Key Takeaways
- Fig. 35 Regional Marketplace: Key Takeaways
- Fig. 36 Regional Marketplace: Key Takeaways
- Fig. 37 North America ruminant methane reduction market estimates & forecast, 2018 - 2030 (USD Million)
- Fig. 38 U.S. ruminant methane reduction market estimates and forecasts, 2018 - 2030 (USD Million)
- Fig. 39 Canada ruminant methane reduction market estimates and forecasts, 2018 - 2030 (USD Million)
- Fig. 40 Europe ruminant methane reduction market estimates and forecasts, 2018 - 2030 (USD Million)
- Fig. 41 UK ruminant methane reduction market estimates and forecasts, 2018 - 2030 (USD Million)
- Fig. 42 Germany ruminant methane reduction market estimates and forecasts, 2018 - 2030 (USD Million)
- Fig. 43 France ruminant methane reduction market estimates and forecasts, 2018 - 2030 (USD Million)
- Fig. 44 Italy ruminant methane reduction market estimates and forecasts, 2018 - 2030 (USD Million)
- Fig. 45 Spain ruminant methane reduction market estimates and forecasts, 2018 - 2030 (USD Million)
- Fig. 46 Sweden ruminant methane reduction market estimates and forecasts, 2018 - 2030 (USD Million)
- Fig. 47 Denmark ruminant methane reduction market estimates and forecasts, 2018 - 2030 (USD Million)
- Fig. 48 Norway ruminant methane reduction market estimates and forecasts, 2018 - 2030 (USD Million)
- Fig. 49 Asia Pacific ruminant methane reduction market estimates and forecasts, 2018 - 2030 (USD Million)
- Fig. 50 Japan ruminant methane reduction market estimates and forecasts, 2018 - 2030 (USD Million)
- Fig. 51 China ruminant methane reduction market estimates and forecasts, 2018 - 2030 (USD Million)
- Fig. 52 India ruminant methane reduction market estimates and forecasts, 2018 - 2030 (USD Million)
- Fig. 53 Australia ruminant methane reduction market estimates and forecasts, 2018 - 2030 (USD Million)
- Fig. 54 South Korea ruminant methane reduction market estimates and forecasts, 2018 - 2030 (USD Million)
- Fig. 55 Thailand ruminant methane reduction market estimates and forecasts, 2018 - 2030 (USD Million)
- Fig. 56 Latin America ruminant methane reduction market estimates and forecasts, 2018 - 2030 (USD Million)
- Fig. 57 Brazil ruminant methane reduction market estimates and forecasts, 2018 - 2030 (USD Million)
- Fig. 58 Mexico ruminant methane reduction market estimates and forecasts, 2018 - 2030 (USD Million)
- Fig. 59 Argentina ruminant methane reduction market estimates and forecasts, 2018 - 2030 (USD Million)
- Fig. 60 Middle East & Africa ruminant methane reduction market estimates and forecasts, 2018 - 2030 (USD Million)
- Fig. 61 South Africa ruminant methane reduction market estimates and forecasts, 2018 - 2030 (USD Million)
- Fig. 62 Saudi Arabia ruminant methane reduction market estimates and forecasts, 2018 - 2030 (USD Million)
- Fig. 63 UAE ruminant methane reduction market estimates and forecasts, 2018 - 2030 (USD Million)
- Fig. 64 Kuwait ruminant methane reduction market estimates and forecasts, 2018 - 2030 (USD Million)
- Fig. 65 Market participant categorization
- Fig. 66 Heat map analysis
- Fig. 67 Key strategies deployed by market players
Ruminant Methane Reduction Market Growth & Trends:
The global ruminant methane reduction market size is expected to reach USD 4.22 billion by 2030, registering a CAGR of 6.34% from 2025 to 2030, according to a new report by Grand View Research, Inc. The increasing livestock population is a major factor contributing to the market growth. According to the National Dairy Development Board, India, the total cattle population in India in 2023 was approximately 192 million heads of bovine dairy cattle and around 113.3 million heads of Asian domestic water buffaloes, totaling 307.5 million heads.
The rising research and development (R&D) by government and market players to develop innovative solutions for methane reduction is projected to drive the growth of this market. Furthermore, ongoing advancements in technology technological innovations are expected to drive the demand for ruminant methane reduction, as they offer cost-effective and efficient solutions for mitigating methane emissions.
Stringent government regulations and rising awareness about climate change mitigation among stakeholders are some of the factors crucial to market growth. Governments across the world are increasingly recognizing the importance of reducing greenhouse gas emissions, including methane, from the agricultural sector and are implementing policies, providing incentives to encourage farmers to adopt practices and technologies that help in reducing methane emissions from ruminants.
Ruminant Methane Reduction Market Report Highlights:
- Feed additives/ Supplements dominated the product segment with a revenue share of over 90% in 2024, owing to increasing R&D and advancements in biotechnology and animal nutrition research.
- In the product segment, the other products sector is expected to witness the fastest CAGR during the forecast period.
- In the animal type segment, the cattle sector held the largest revenue share of around 80.08% in 2024, due to the rising awareness about methane emission impact on environment and increasing focus of government on greenhouse emission reduction.
- In the animal type segment, the goats sector is anticipated to witness the fastest CAGR from 2025 to 2030. Innovations and technological advancements targeting methane emission reduction from goats is expected to drive market growth.
- North America dominated the market in 2024, owing to increase in investments and financial incentives aimed at reducing methane emission. Asia Pacific, on the other hand, is expected to witness the fastest CAGR during forecast period.
- In April 2023, CH4 Global, Inc. introduced Methane Tamer Beef Feedlot, a proprietary methane-reducing feed formulation for cattle, featuring Asparagopsis seaweed to achieve up to 90% reduction in methane emissions
Table of Contents
Chapter 1. Methodology and Scope
- 1.1. Market Segmentation and Scope
- 1.1.1. Regional Scope
- 1.1.2. Estimates And Forecast Timeline
- 1.2. Market Definitions
- 1.3. Research Methodology
- 1.4. Information Procurement
- 1.4.1. Purchased Database
- 1.4.2. GVR's Internal Database
- 1.5. Market Formulation & Validation
- 1.6. Model Details
- 1.6.1. Commodity flow analysis
- 1.6.2. Global Market: CAGR Calculation
- 1.7. Research Scope and Assumptions
- 1.7.1. List of Secondary Sources
- 1.7.2. List of Primary Sources
- 1.7.3. Objectives
Chapter 2. Executive Summary
- 2.1. Market Outlook
- 2.2. Segment Outlook
- 2.3. Competitive Insights
Chapter 3. Ruminant Methane Reduction Market Variables, Trends, & Scope
- 3.1. Market Lineage Outlook
- 3.1.1. Parent Market Outlook
- 3.1.2. Related/Ancillary Market Outlook
- 3.2. Market Dynamics
- 3.2.1. Market Drivers Analysis
- 3.2.1.1. Rise In Livestock Population
- 3.2.1.2. Growing Awareness About Climate Change And Need For Ruminant Methane Reduction
- 3.2.1.3. Increasing R&D Investments
- 3.2.1.4. Supportive Initiatives By Industry Stakeholders
- 3.2.2. Market Restraints Analysis
- 3.2.2.1. Cost Considerations
- 3.2.2.2. Limited Availability And Scalability Of Methane Reduction Technologies
- 3.2.3. Market Opportunity Analysis
- 3.2.4. Market Challenges Analysis
- 3.2.1. Market Drivers Analysis
- 3.3. Ruminant Methane Reduction Market Analysis Tools
- 3.3.1. Porter's Analysis
- 3.3.1.1. Bargaining Power Of The Suppliers
- 3.3.1.2. Bargaining Power Of The Buyers
- 3.3.1.3. Threats Of Substitution
- 3.3.1.4. Threats From New Entrants
- 3.3.1.5. Competitive Rivalry
- 3.3.2. PESTEL Analysis
- 3.3.2.1. Political landscape
- 3.3.2.2. Economic and Social Landscape
- 3.3.2.3. Technological landscape
- 3.3.2.4. Environmental Landscape
- 3.3.2.5. Legal landscape
- 3.3.1. Porter's Analysis
- 3.4. Product Pipeline Analysis
- 3.5. Covid-19 Analysis
Chapter 4. Ruminant Methane Reduction Market: Product Estimates & Trend Analysis
- 4.1. Segment Dashboard
- 4.2. Global Ruminant Methane Reduction Market Movement Analysis
- 4.3. Global Ruminant Methane Reduction Market Size & Trend Analysis, by Product, 2018 to 2030 (USD Million)
- 4.4. Feed Additives/ Supplements
- 4.4.1. Market estimates and forecasts, 2018 - 2030 (USD Million)
- 4.4.2. Plant-based
- 4.4.2.1. Market estimates and forecasts, 2018 - 2030 (USD Million)
- 4.4.3. Chemical-based
- 4.4.3.1. Market estimates and forecasts, 2018 - 2030 (USD Million)
- 4.4.4. Microbial-based
- 4.4.4.1. Market estimates and forecasts, 2018 - 2030 (USD Million)
- 4.5. Other Products
- 4.5.1. Market estimates and forecasts, 2018 - 2030 (USD Million)
Chapter 5. Ruminant Methane Reduction Market: Animal Type Estimates & Trend Analysis
- 5.1. Segment Dashboard
- 5.2. Global Ruminant Methane Reduction Market Movement Analysis
- 5.3. Global Ruminant Methane Reduction Market Size & Trend Analysis, by Animal Type, 2018 to 2030 (USD Million)
- 5.4. Cattle
- 5.4.1. Market estimates and forecasts, 2018 - 2030 (USD Million)
- 5.5. Sheep
- 5.5.1. Market estimates and forecasts, 2018 - 2030 (USD Million)
- 5.6. Goats
- 5.6.1. Market estimates and forecasts, 2018 - 2030 (USD Million)
Chapter 6. Ruminant Methane Reduction Market: Regional Estimates & Trend Analysis
- 6.1. Regional Dashboard
- 6.2. Market Size & Forecasts and Trend Analysis, 2018 to 2030 North America
- 6.3. North America
- 6.3.1. Market estimates and forecasts, 2018 - 2030 (USD Million)
- 6.3.2. U.S.
- 6.3.2.1. Key Country Dynamics
- 6.3.2.2. U.S. Ruminant Methane Reduction Market Estimates and Forecasts, 2018 - 2030 (USD Million)
- 6.3.3. Canada
- 6.3.3.1. Key Country Dynamics
- 6.3.3.2. Canada Ruminant Methane Reduction Market Estimates and Forecasts, 2018 - 2030 (USD Million)
- 6.3.4. Mexico
- 6.3.4.1. Key Country Dynamics
- 6.3.4.2. Mexico Ruminant Methane Reduction Market Estimates and Forecasts, 2018 - 2030 (USD Million)
- 6.4. Europe
- 6.4.1. Market estimates and forecasts, 2018 - 2030 (USD Million)
- 6.4.2. UK
- 6.4.2.1. Key Country Dynamics
- 6.4.2.2. UK Ruminant Methane Reduction Market Estimates and Forecasts, 2018 - 2030 (USD Million)
- 6.4.3. Germany
- 6.4.3.1. Key Country Dynamics
- 6.4.3.2. Germany Ruminant Methane Reduction Market Estimates and Forecasts, 2018 - 2030 (USD Million)
- 6.4.4. France
- 6.4.4.1. Key Country Dynamics
- 6.4.4.2. France Ruminant Methane Reduction Market Estimates and Forecasts, 2018 - 2030 (USD Million)
- 6.4.5. Italy
- 6.4.5.1. Key Country Dynamics
- 6.4.5.2. Italy Ruminant Methane Reduction Market Estimates and Forecasts, 2018 - 2030 (USD Million)
- 6.4.6. Spain
- 6.4.6.1. Key Country Dynamics
- 6.4.6.2. Spain Ruminant Methane Reduction Market Estimates and Forecasts, 2018 - 2030 (USD Million)
- 6.4.7. Sweden
- 6.4.7.1. Key Country Dynamics
- 6.4.7.2. Sweden Ruminant Methane Reduction Market Estimates and Forecasts, 2018 - 2030 (USD Million)
- 6.4.8. Denmark
- 6.4.8.1. Key Country Dynamics
- 6.4.8.2. Denmark Ruminant Methane Reduction Market Estimates and Forecasts, 2018 - 2030 (USD Million)
- 6.4.9. Norway
- 6.4.9.1. Key Country Dynamics
- 6.4.9.2. Norway Ruminant Methane Reduction Market Estimates and Forecasts, 2018 - 2030 (USD Million)
- 6.5. Asia Pacific
- 6.5.1. Market estimates and forecasts, 2018 - 2030 (USD Million)
- 6.5.2. China
- 6.5.2.1. Key Country Dynamics
- 6.5.2.2. China Ruminant Methane Reduction Market Estimates and Forecasts, 2018 - 2030 (USD Million)
- 6.5.3. Japan
- 6.5.3.1. Key Country Dynamics
- 6.5.3.2. Japan Ruminant Methane Reduction Market Estimates and Forecasts, 2018 - 2030 (USD Million)
- 6.5.4. India
- 6.5.4.1. Key Country Dynamics
- 6.5.4.2. India Ruminant Methane Reduction Market Estimates and Forecasts, 2018 - 2030 (USD Million)
- 6.5.5. South Korea
- 6.5.5.1. Key Country Dynamics
- 6.5.5.2. South Korea Ruminant Methane Reduction Market Estimates and Forecasts, 2018 - 2030 (USD Million)
- 6.5.6. Australia
- 6.5.6.1. Key Country Dynamics
- 6.5.6.2. Australia Ruminant Methane Reduction Market Estimates and Forecasts, 2018 - 2030 (USD Million)
- 6.5.7. Thailand
- 6.5.7.1. Key Country Dynamics
- 6.5.7.2. Thailand Ruminant Methane Reduction Market Estimates and Forecasts, 2018 - 2030 (USD Million)
- 6.6. Latin America
- 6.6.1. Market estimates and forecasts, 2018 - 2030 (USD Million)
- 6.6.2. Brazil
- 6.6.2.1. Key Country Dynamics
- 6.6.2.2. Brazil Ruminant Methane Reduction Market Estimates and Forecasts, 2018 - 2030 (USD Million)
- 6.6.3. Argentina
- 6.6.3.1. Key Country Dynamics
- 6.6.3.2. Argentina Ruminant Methane Reduction Market Estimates and Forecasts, 2018 - 2030 (USD Million)
- 6.7. Middle East and Africa
- 6.7.1. Market estimates and forecasts, 2018 - 2030 (USD Million)
- 6.7.2. Saudi Arabia
- 6.7.2.1. Key Country Dynamics
- 6.7.2.2. Saudi Arabia Ruminant Methane Reduction Market Estimates and Forecasts, 2018 - 2030 (USD Million)
- 6.7.3. South Africa
- 6.7.3.1. Key Country Dynamics
- 6.7.3.2. South Africa Ruminant Methane Reduction Market Estimates and Forecasts, 2018 - 2030 (USD Million)
- 6.7.4. UAE
- 6.7.4.1. Key Country Dynamics
- 6.7.4.2. UAE Ruminant Methane Reduction Market Estimates and Forecasts, 2018 - 2030 (USD Million)
- 6.7.5. Kuwait
- 6.7.5.1. Key Country Dynamics
- 6.7.5.2. Kuwait Ruminant Methane Reduction Market Estimates and Forecasts, 2018 - 2030 (USD Million)
Chapter 7. Competitive Landscape
- 7.1. Market Participant Categorization
- 7.2. Company Market Position Analysis/ Heat Map Analysis
- 7.3. Estimated Company Market Share Analysis, 2023
- 7.4. Strategy Mapping
- 7.4.1. Mergers & Acquisitions
- 7.4.2. Partnerships & Collaborations
- 7.4.3. Others
- 7.5. Company Profiles
- 7.5.1. DSM
- 7.5.1.1. Participant's Overview
- 7.5.1.2. Financial Performance
- 7.5.1.3. Product Benchmarking
- 7.5.1.4. Strategic Initiatives
- 7.5.2. Blue Ocean Barns.
- 7.5.2.1. Participant's Overview
- 7.5.2.2. Financial Performance
- 7.5.2.3. Product Benchmarking
- 7.5.2.4. Strategic Initiatives
- 7.5.3. Alltech.
- 7.5.3.1. Participant's Overview
- 7.5.3.2. Financial Performance
- 7.5.3.3. Product Benchmarking
- 7.5.3.4. Strategic Initiatives
- 7.5.4. CH4 GLOBAL, INC.
- 7.5.4.1. Participant's Overview
- 7.5.4.2. Financial Performance
- 7.5.4.3. Product Benchmarking
- 7.5.4.4. Strategic Initiatives
- 7.5.5. Mootral
- 7.5.5.1. Participant's Overview
- 7.5.5.2. Financial Performance
- 7.5.5.3. Product Benchmarking
- 7.5.5.4. Strategic Initiatives
- 7.5.6. Symbrosia Inc.
- 7.5.6.1. Participant's Overview
- 7.5.6.2. Financial Performance
- 7.5.6.3. Product Benchmarking
- 7.5.6.4. Strategic Initiatives
- 7.5.7. Fonterra Co-operative Group Limited
- 7.5.7.1. Participant's Overview
- 7.5.7.2. Financial Performance
- 7.5.7.3. Product Benchmarking
- 7.5.7.4. Strategic Initiatives
- 7.5.8. Elanco Animal Health Inc.
- 7.5.8.1. Participant's Overview
- 7.5.8.2. Financial Performance
- 7.5.8.3. Product Benchmarking
- 7.5.8.4. Strategic Initiatives
- 7.5.9. Rumin8 Ltd
- 7.5.9.1. Participant's Overview
- 7.5.9.2. Financial Performance
- 7.5.9.3. Product Benchmarking
- 7.5.9.4. Strategic Initiatives
- 7.5.10. Zelp Ltd
- 7.5.10.1. Participant's Overview
- 7.5.10.2. Financial Performance
- 7.5.10.3. Product Benchmarking
- 7.5.10.4. Strategic Initiatives
- 7.5.11. Cargill, Incorporated
- 7.5.11.1. Participant's Overview
- 7.5.11.2. Financial Performance
- 7.5.11.3. Product Benchmarking
- 7.5.11.4. Strategic Initiatives
- 7.5.12. FutureFeed
- 7.5.12.1. Participant's Overview
- 7.5.12.2. Financial Performance
- 7.5.12.3. Product Benchmarking
- 7.5.12.4. Strategic Initiatives
- 7.5.1. DSM

