|
|
市場調査レポート
商品コード
1474906
mRNA医薬の市場規模、シェア、動向分析レポート:用途別、タイプ別、最終用途別、地域別、セグメント予測、2024年~2030年mRNA Therapeutics Market Size, Share & Trends Analysis Report By Application (Rare Genetic Diseases, Oncology, Respiratory Diseases, Infectious Diseases), By Type (Prophylactic, Therapeutic), By End-use, By Region, And Segment Forecasts, 2024 - 2030 |
||||||

|
|||||||
カスタマイズ可能
|
|||||||

| mRNA医薬の市場規模、シェア、動向分析レポート:用途別、タイプ別、最終用途別、地域別、セグメント予測、2024年~2030年 |
|
出版日: 2024年04月25日
発行: Grand View Research
ページ情報: 英文 120 Pages
納期: 2~10営業日
|

全表示
- 概要
- 図表
- 目次
mRNA医薬市場の成長と動向:
Grand View Research社の最新レポートによると、mRNA医薬の世界市場規模は2030年までに313億米ドルに達する見込みです。
2024年から2030年までのCAGRは17.05%で拡大する見込みです。市場成長を後押しする主な要因の一つは、糖尿病、HIV、がん、CVDなどの慢性疾患や感染症の罹患率の上昇です。エボラ出血熱、インフルエンザ、HIV、そして最近ではCOVID-19のようなウイルス性疾患と闘うための治療薬や予防接種の必要性が高まっていることが、業界の成長を促進すると予想されています。COVID-19ウイルスは多くの政府機関やワクチン製造業者が注目しており、これが市場拡大を加速すると予想されます。
さらに、第1相臨床試験段階と第2相臨床試験段階を組み合わせたり、保健機関からより迅速に規制当局の許可を取得したりするなど、複数の供給業者が斬新な技術を用いた結果、予測期間中に世界中でワクチン接種用量の入手が可能になり、業界の成長に寄与すると予測されます。最先端技術の使用により、mRNAワクチンや治療薬は従来の薬と比較して生成されます。これらの製品は製造コストが低く、感染症に対してより強力で、免疫原性が強化されています。mRNAの生体内全身デリバリーのための脂質ナノ粒子の組成の進歩によって、市場拡大の有利な見通しも生まれています。
例えば、2022年3月、米国立衛生研究所(National Institutes of Health)のアレルギー・感染症研究所(National Institute of Allergy and Infectious Diseases:NIAID)は、メッセンジャーRNA(mRNA)プラットフォームの活性成分に起因する3つの潜在的なHIVワクチンを評価する第1相臨床試験を開始しました。そのため、需要が増加し、業界の成長をさらに後押しすることになります。
もう一つの重要な成長促進要素として、製薬会社はmRNA技術に投資しています。市場は、バイオテクノロジー関連の研究開発(R&D)イニシアティブや医療技術の進歩など、さらなる要因によっても牽引されると予想されます。例えば、Moderna社とAstraZeneca社は、mRNAを用いた心筋虚血治療(心臓への血流が減少し、心筋から必要な酸素が奪われることで発症する心疾患の一種)に共同で取り組んでいます。同様に、心臓病に対するmRNA治療も Arcturus Therapeuticsによって試験中です。このような投資は、今後数年間の市場成長を補うものと思われます。
COVID-19パンデミックは業界の成長にプラスの影響を与えると予想されます。COVID-19ワクチンは、mRNA技術が使用されている疾患のひとつです。COVID-19ワクチンはがん治療で主に使用されるほか、mRNA市場を牽引する主な要因となっています。mRNA企業は、コロナウイルスの変異やウイルス変種の拡散の可能性から、次世代に向けたCOVID-19ワクチンの作製に励んでいます。例えば、2022年6月、食品医薬品局はModerna COVID-19ワクチンと、COVID-19の予防措置として生後6ヵ月の小児に使用するPfizer &BioNTech COVID-19ワクチンを承認しました。その結果、COVID-19パンデミックの間、これらの技術の使用は増加し、業界の成長につながると予測されています。
さらに、ここ数年、プレーヤーが現在の研究開発プロジェクトを支援するために戦略的提携を結ぶなど、統合の傾向が顕著になっています。例えば、2021年2月、GlaxoSmithKline plcとCureVac N.V.は、現在の提携関係を基礎として、COVID-19次世代mRNAワクチンを開発するための新たな1億5,236万米ドルの契約を発表しました。mRNAベースの治療薬/ワクチンのリードが概念実証を示し、臨床試験を経て最終的に市場に投入されるにつれて、この特殊な業界セグメントに関わる利害関係者にとってのビジネスチャンスは、予測される将来において大幅に増加すると思われます。
mRNA医薬市場レポートハイライト
- 用途別では、市場はさらに希少遺伝性疾患、腫瘍、呼吸器疾患、感染症、その他に区分されます。
- タイプ別では、市場はさらに予防と治療に分類されます。2023年のシェアは100%で、予防セグメントが市場を完全に支配しています。
- 最終用途に基づくと、市場はさらに病院・クリニック、研究機関、その他に区分されます。病院・診療所セグメントは2023年に45.36%のシェアで市場を独占し、2024年から2030年にかけて最も速い成長率を記録すると予想されています。
- 北米mRNA医薬市場は、2023年に40.37%のシェアで最大の収益シェアを占めました。
目次
第1章 調査手法と範囲
第2章 エグゼクティブサマリー
第3章 市場の変数、動向、範囲
- 市場系統の見通し
- 親市場の見通し
- 関連/補助市場見通し
- 市場力学
- 市場促進要因分析
- 市場抑制要因分析
- 業界分析ツール
- ポーターのファイブフォース分析
- PESTEL分析
- COVID-19の影響分析
第4章 用途のビジネス分析
- 用途のセグメントダッシュボード
- mRNA医薬市場:用途の変動分析
- mRNA医薬市場規模・動向分析、用途別、2018年~2030年
- 希少遺伝性疾患
- 腫瘍
- 呼吸器疾患
- 感染症
- その他
第5章 タイプのビジネス分析
- タイプのセグメントダッシュボード
- mRNA医薬市場:タイプの変動分析
- mRNA医薬市場規模・動向分析、タイプ別、2018~2030年
- 予防
- 治療
第6章 最終用途のビジネス分析
- 最終用途のセグメントダッシュボード
- mRNA医薬市場:最終用途の変動分析
- mRNA医薬市場規模・動向分析、最終用途別、2018~2030年
- 病院・クリニック
- 研究機関
- その他
第7章 地域のビジネス分析
- 地域のダッシュボード
- 市場規模と予測・動向分析、2023年と2030年
- 北米
- 米国
- カナダ
- 欧州
- 英国
- ドイツ
- フランス
- イタリア
- スペイン
- デンマーク
- スウェーデン
- ノルウェー
- アジア太平洋地域
- 日本
- 中国
- インド
- オーストラリア
- タイ
- 韓国
- ラテンアメリカ
- ブラジル
- メキシコ
- アルゼンチン
- 中東・アフリカ
- 南アフリカ
- サウジアラビア
- アラブ首長国連邦
- クウェート
第8章 競合情勢
- 企業分類
- 戦略マッピング
- 企業市況分析、2023年
- 企業プロファイル/上場企業
- Moderna Inc.
- BioNTech SE
- CureVac NV
- Arcturus Therapeutics
- Sanofi
- GSK plc.
- Argos Therapeutics Inc.
- Ethris
- Pfizer Inc.
- AstraZeneca
List of Tables
- Table 1 List of abbreviations
- Table 2 Global mRNA therapeutics market, by region, 2018 - 2030 (USD Million)
- Table 3 North America mRNA therapeutics market, by country, 2018 - 2030 (USD Million)
- Table 4 North America mRNA therapeutics market, by type, 2018 - 2030 (USD Million)
- Table 5 North America mRNA therapeutics market, by application, 2018 - 2030 (USD Million)
- Table 6 North America mRNA therapeutics market, by end-use, 2018 - 2030 (USD Million)
- Table 7 U.S. mRNA therapeutics market, by type, 2018 - 2030 (USD Million)
- Table 8 U.S. mRNA therapeutics market, by application, 2018 - 2030 (USD Million)
- Table 9 U.S. mRNA therapeutics market, by end-use, 2018 - 2030 (USD Million)
- Table 10 Canada mRNA therapeutics market, by type, 2018 - 2030 (USD Million)
- Table 11 Canada mRNA therapeutics market, by application, 2018 - 2030 (USD Million)
- Table 12 Canada mRNA therapeutics market, by end-use, 2018 - 2030 (USD Million)
- Table 13 Europe mRNA therapeutics market, by country, 2018 - 2030 (USD Million)
- Table 14 Europe mRNA therapeutics market, by type, 2018 - 2030 (USD Million)
- Table 15 Europe mRNA therapeutics market, by application, 2018 - 2030 (USD Million)
- Table 16 Europe mRNA therapeutics market, by end-use, 2018 - 2030 (USD Million)
- Table 17 Germany mRNA therapeutics market, by type, 2018 - 2030 (USD Million)
- Table 18 Germany mRNA therapeutics market, by application, 2018 - 2030 (USD Million)
- Table 19 Germany mRNA therapeutics market, by end-use, 2018 - 2030 (USD Million)
- Table 20 UK mRNA therapeutics market, by type, 2018 - 2030 (USD Million)
- Table 21 UK mRNA therapeutics market, by application, 2018 - 2030 (USD Million)
- Table 22 UK mRNA therapeutics market, by end-use, 2018 - 2030 (USD Million)
- Table 23 France mRNA therapeutics market, by type, 2018 - 2030 (USD Million)
- Table 24 France mRNA therapeutics market, by application, 2018 - 2030 (USD Million)
- Table 25 France mRNA therapeutics market, by end-use, 2018 - 2030 (USD Million)
- Table 26 Italy mRNA therapeutics market, by type, 2018 - 2030 (USD Million)
- Table 27 Italy mRNA therapeutics market, by application, 2018 - 2030 (USD Million)
- Table 28 Italy mRNA therapeutics market, by end-use, 2018 - 2030 (USD Million)
- Table 29 Spain mRNA therapeutics market, by type, 2018 - 2030 (USD Million)
- Table 30 Spain mRNA therapeutics market, by application, 2018 - 2030 (USD Million)
- Table 31 Spain mRNA therapeutics market, by end-use, 2018 - 2030 (USD Million)
- Table 32 Denmark mRNA therapeutics market, by type, 2018 - 2030 (USD Million)
- Table 33 Denmark mRNA therapeutics market, by application, 2018 - 2030 (USD Million)
- Table 34 Denmark mRNA therapeutics market, by end-use, 2018 - 2030 (USD Million)
- Table 35 Sweden mRNA therapeutics market, by type, 2018 - 2030 (USD Million)
- Table 36 Sweden mRNA therapeutics market, by application, 2018 - 2030 (USD Million)
- Table 37 Sweden mRNA therapeutics market, by end-use, 2018 - 2030 (USD Million)
- Table 38 Norway mRNA therapeutics market, by type, 2018 - 2030 (USD Million)
- Table 39 Norway mRNA therapeutics market, by application, 2018 - 2030 (USD Million)
- Table 40 Norway mRNA therapeutics market, by end-use, 2018 - 2030 (USD Million)
- Table 41 Asia Pacific mRNA therapeutics market, by country, 2018 - 2030 (USD Million)
- Table 42 Asia Pacific mRNA therapeutics market, by type, 2018 - 2030 (USD Million)
- Table 43 Asia Pacific mRNA therapeutics market, by application, 2018 - 2030 (USD Million)
- Table 44 Asia Pacific mRNA therapeutics market, by end-use, 2018 - 2030 (USD Million)
- Table 45 China mRNA therapeutics market, by type, 2018 - 2030 (USD Million)
- Table 46 China mRNA therapeutics market, by application, 2018 - 2030 (USD Million)
- Table 47 China mRNA therapeutics market, by end-use, 2018 - 2030 (USD Million)
- Table 48 Japan mRNA therapeutics market, by type, 2018 - 2030 (USD Million)
- Table 49 Japan mRNA therapeutics market, by application, 2018 - 2030 (USD Million)
- Table 50 Japan mRNA therapeutics market, by end-use, 2018 - 2030 (USD Million)
- Table 51 India mRNA therapeutics market, by type, 2018 - 2030 (USD Million)
- Table 52 India mRNA therapeutics market, by application, 2018 - 2030 (USD Million)
- Table 53 India mRNA therapeutics market, by end-use, 2018 - 2030 (USD Million)
- Table 54 South Korea mRNA therapeutics market, by type, 2018 - 2030 (USD Million)
- Table 55 South Korea mRNA therapeutics market, by application, 2018 - 2030 (USD Million)
- Table 56 South Korea mRNA therapeutics market, by end-use, 2018 - 2030 (USD Million)
- Table 57 Australia mRNA therapeutics market, by type, 2018 - 2030 (USD Million)
- Table 58 Australia mRNA therapeutics market, by application, 2018 - 2030 (USD Million)
- Table 59 Australia mRNA therapeutics market, by end-use, 2018 - 2030 (USD Million)
- Table 60 Thailand mRNA therapeutics market, by type, 2018 - 2030 (USD Million)
- Table 61 Thailand mRNA therapeutics market, by application, 2018 - 2030 (USD Million)
- Table 62 Thailand mRNA therapeutics market, by end-use, 2018 - 2030 (USD Million)
- Table 63 Latin America mRNA therapeutics market, by country, 2018 - 2030 (USD Million)
- Table 64 Latin America mRNA therapeutics market, by type, 2018 - 2030 (USD Million)
- Table 65 Latin America mRNA therapeutics market, by application, 2018 - 2030 (USD Million)
- Table 66 Latin America mRNA therapeutics market, by end-use, 2018 - 2030 (USD Million)
- Table 67 Brazil mRNA therapeutics market, by type, 2018 - 2030 (USD Million)
- Table 68 Brazil mRNA therapeutics market, by application, 2018 - 2030 (USD Million)
- Table 69 Brazil mRNA therapeutics market, by end-use, 2018 - 2030 (USD Million)
- Table 70 Mexico mRNA therapeutics market, by type, 2018 - 2030 (USD Million)
- Table 71 Mexico mRNA therapeutics market, by application, 2018 - 2030 (USD Million)
- Table 72 Mexico mRNA therapeutics market, by end-use, 2018 - 2030 (USD Million)
- Table 73 Argentina mRNA therapeutics market, by type, 2018 - 2030 (USD Million)
- Table 74 Argentina mRNA therapeutics market, by application, 2018 - 2030 (USD Million)
- Table 75 Argentina mRNA therapeutics market, by end-use, 2018 - 2030 (USD Million)
- Table 76 MEA mRNA therapeutics market, by country, 2018 - 2030 (USD Million)
- Table 77 MEA mRNA therapeutics market, by type, 2018 - 2030 (USD Million)
- Table 78 MEA mRNA therapeutics market, by application, 2018 - 2030 (USD Million)
- Table 79 MEA mRNA therapeutics market, by end-use, 2018 - 2030 (USD Million)
- Table 80 South Africa mRNA therapeutics market, by type, 2018 - 2030 (USD Million)
- Table 81 South Africa mRNA therapeutics market, by application, 2018 - 2030 (USD Million)
- Table 82 South Africa mRNA therapeutics market, by end-use, 2018 - 2030 (USD Million)
- Table 83 Saudi Arabia mRNA therapeutics market, by type, 2018 - 2030 (USD Million)
- Table 84 Saudi Arabia mRNA therapeutics market, by application, 2018 - 2030 (USD Million)
- Table 85 Saudi Arabia mRNA therapeutics market, by end-use, 2018 - 2030 (USD Million)
- Table 86 UAE mRNA therapeutics market, by type, 2018 - 2030 (USD Million)
- Table 87 UAE mRNA therapeutics market, by application, 2018 - 2030 (USD Million)
- Table 88 UAE mRNA therapeutics market, by end-use, 2018 - 2030 (USD Million)
- Table 89 Kuwait mRNA therapeutics market, by type, 2018 - 2030 (USD Million)
- Table 90 Kuwait mRNA therapeutics market, by application, 2018 - 2030 (USD Million)
- Table 91 Kuwait mRNA therapeutics market, by end-use, 2018 - 2030 (USD Million)
List of Figures
- Fig. 1 Market research process
- Fig. 2 Data triangulation techniques
- Fig. 3 Primary research pattern
- Fig. 4 Market research approaches
- Fig. 5 Market formulation & validation
- Fig. 6 mRNA therapeutics market: market outlook
- Fig. 7 mRNA therapeutics competitive insights
- Fig. 8 Parent market outlook
- Fig. 9 Related/ancillary market outlook
- Fig. 10 mRNA therapeutics market driver impact
- Fig. 11 mRNA therapeutics market restraint impact
- Fig. 12 mRNA therapeutics market strategic initiatives analysis
- Fig. 13 mRNA therapeutics market: type movement analysis
- Fig. 14 mRNA therapeutics market: type outlook and key takeaways
- Fig. 15 Prophylactic market estimates and forecast, 2018 - 2030 (USD Million)
- Fig. 16 Therapeutic market estimates and forecast, 2018 - 2030 (USD Million)
- Fig. 17 mRNA therapeutics market: application movement analysis
- Fig. 18 mRNA therapeutics market: application outlook and key takeaways
- Fig. 19 Infectious diseases market estimates and forecasts, 2018 - 2030 (USD Million)
- Fig. 20 Oncology market estimates and forecasts, 2018 - 2030 (USD Million)
- Fig. 21 Rare genetic diseases market estimates and forecasts,2018 - 2030 (USD Million)
- Fig. 22 Respiratory diseases market estimates and forecast, 2018 - 2030 (USD Million)
- Fig. 23 Others market estimates and forecast, 2018 - 2030 (USD Million)
- Fig. 24 mRNA therapeutics market: end-use movement analysis
- Fig. 25 mRNA therapeutics market: end-use outlook and key takeaways
- Fig. 26 Hospitals & clinics market estimates and forecasts, 2018 - 2030 (USD Million)
- Fig. 27 Research organizations market estimates and forecasts, 2018 - 2030 (USD Million)
- Fig. 28 Others market estimates and forecast, 2018 - 2030 (USD Million)
- Fig. 29 North America mRNA therapeutics market estimates and forecasts, 2018 - 2030 (USD Million)
- Fig. 30 U.S. mRNA therapeutics market estimates and forecasts, 2018 - 2030 (USD Million)
- Fig. 31 Canada mRNA therapeutics market estimates and forecasts, 2018 - 2030 (USD Million)
- Fig. 32 Europe mRNA therapeutics market estimates and forecasts, 2018 - 2030 (USD Million)
- Fig. 33 UK mRNA therapeutics market estimates and forecasts, 2018 - 2030 (USD Million)
- Fig. 34 Germany mRNA therapeutics market estimates and forecasts, 2018 - 2030 (USD Million)
- Fig. 35 France mRNA therapeutics market estimates and forecasts, 2018 - 2030 (USD Million)
- Fig. 36 Italy mRNA therapeutics market estimates and forecasts, 2018 - 2030 (USD Million)
- Fig. 37 Spain mRNA therapeutics market estimates and forecasts, 2018 - 2030 (USD Million)
- Fig. 38 Denmark mRNA therapeutics market estimates and forecasts, 2018 - 2030 (USD Million)
- Fig. 39 Sweden mRNA therapeutics market estimates and forecasts, 2018 - 2030 (USD Million)
- Fig. 40 Norway mRNA therapeutics market estimates and forecasts, 2018 - 2030 (USD Million)
- Fig. 41 Asia Pacific mRNA therapeutics market estimates and forecasts, 2018 - 2030 (USD Million)
- Fig. 42 China mRNA therapeutics market estimates and forecasts, 2018 - 2030 (USD Million)
- Fig. 43 Japan mRNA therapeutics market estimates and forecasts, 2018 - 2030 (USD Million)
- Fig. 44 India mRNA therapeutics market estimates and forecasts, 2018 - 2030 (USD Million)
- Fig. 45 Thailand mRNA therapeutics market estimates and forecasts, 2018 - 2030 (USD Million)
- Fig. 46 South Korea mRNA therapeutics market estimates and forecasts, 2018 - 2030 (USD Million)
- Fig. 47 Australia mRNA therapeutics market estimates and forecasts, 2018 - 2030 (USD Million)
- Fig. 48 Latin America mRNA therapeutics market estimates and forecasts, 2018 - 2030 (USD Million)
- Fig. 49 Brazil mRNA therapeutics market estimates and forecasts, 2018 - 2030 (USD Million)
- Fig. 50 Mexico mRNA therapeutics market estimates and forecasts, 2018 - 2030 (USD Million)
- Fig. 51 Argentina mRNA therapeutics market estimates and forecasts, 2018 - 2030 (USD Million)
- Fig. 52 Middle East and Africa mRNA therapeutics market estimates and forecasts, 2018 - 2030 (USD Million)
- Fig. 53 South Africa mRNA therapeutics market estimates and forecasts, 2018 - 2030 (USD Million)
- Fig. 54 Saudi Arabia mRNA therapeutics market estimates and forecasts, 2018 - 2030 (USD Million)
- Fig. 55 UAE mRNA therapeutics market estimates and forecasts, 2018 - 2030 (USD Million)
- Fig. 56 Kuwait mRNA therapeutics market estimates and forecasts, 2018 - 2030 (USD Million)
- Fig. 57 Market positioning of key market players- mRNA therapeutics market
mRNA Therapeutics Market Growth & Trends:
The global mRNA therapeutics market size is expected to reach USD 31.30 billion by 2030, according to a new report by Grand View Research, Inc. It is expected to expand at a CAGR of 17.05% from 2024 to 2030. One of the main factors propelling the market growth is the rising incidence of chronic and infectious diseases like diabetes, HIV, cancer, and CVDs. The growing need for therapeutic drugs and vaccinations to combat viral illnesses like Ebola, influenza, HIV, and most recently COVID-19 is expected to fuel industry growth. The COVID-19 virus has been the focus of numerous government organizations and vaccine producers, and it is anticipated that this will accelerate market expansion.
Furthermore, the availability of vaccination doses around the world is projected to increase during the forecast period as a result of multiple suppliers using novel techniques, such as combining the phase 1 and phase 2 clinical trial stages and obtaining regulatory clearances more quickly from health agencies, thus contributing to the industry growth. With the use of cutting-edge technologies, mRNA vaccines and therapeutics are generated in comparison to conventional medications. These products are less expensive to produce, more powerful against infections, and have enhanced immunogenicity. A favorable outlook for market expansion is also being created by advancements in the compositions of lipid nanoparticles for in-vivo systemic delivery of mRNA.
For instance, in March 2022, The National Institutes of Health's National Institute of Allergy and Infectious Diseases (NIAID) launched a phase 1 clinical trial to assess three potential HIV vaccines using a messenger RNA (mRNA) platform due to its active component and direct the cells to make a protein (or perhaps a protein fragment) that stimulates an immune response using artificial mRNA created in a lab, which enhances the vaccine with more specificity as well as robust stability. Thus, it will increase the demand and further boost the industry growth.
As another significant growth-inducing element, pharmaceutical firms are spending on mRNA technology since they can combine numerous molecules into a therapeutic drug. The market is expected to be driven by additional factors, such as significant biotechnology-related research and development (R&D) initiatives and advancements in medical technology. For instance, Moderna and AstraZeneca are working together on a myocardial ischemia therapy using mRNA (a form of cardiac disease that develops when there is a decrease in blood flow to the heart, depriving the heart muscle of necessary oxygen). Similarly, mRNA treatments for heart disease are also being tested by Arcturus Therapeutics. Such investments are likely to supplement the market growth in the coming years.
The COVID-19 pandemic is anticipated to positively impact the industry growth. The COVID-19 vaccine is one of the diseases for which the mRNA technology is being used. In addition to its predominant use in cancer therapy, the COVID-19 vaccine is the main factor driving the market for mRNA. The mRNA firms are working hard to create COVID-19 vaccines for the next generation due to the coronavirus mutation and the potential spread of virus variants. For instance, in June 2022, The Food and Drug Administration approved the Moderna COVID-19 Vaccine and also the Pfizer & BioNTech COVID-19 Vaccine for use in children as young as 6 months old as COVID-19 preventative measures. As a result, the usage of these technologies is projected to increase during the COVID-19 pandemic and result in industry growth.
Additionally, there has been a discernible trend toward consolidation over the past few years, with players forming strategic alliances to support current R&D projects. For instance, in February 2021, building on their current partnership, GlaxoSmithKline plc and CureVac N.V. announced a new USD152.36 million agreement to create COVID-19 next-generation mRNA vaccines with the possibility for a multi-valent strategy to address numerous developing variations in a single vaccination. As additional mRNA-based therapeutic / vaccine leads exhibit proof-of-concept, go through clinical testing, and eventually hit the market, the opportunity for stakeholders involved in this specialized industry segment is likely to experience a significant increase in the predicted future.
mRNA Therapeutics Market Report Highlights:
- Based on applications, the market is further segmented into rare genetic diseases, oncology, respiratory diseases, infectious diseases, and others.
- Based on types, the market is further categorized into prophylactic and therapeutic. The prophylactic segment completely dominated the market with a share of 100% in 2023.
- Based on end-uses, the market is further segmented into hospitals & clinics, research organizations, and others. The hospitals & clinics segment dominated the market with a share of 45.36% in 2023 and is expected to register the fastest growth rate from 2024 to 2030
- The North America mRNA therapeutics market accounted for the largest revenue share of 40.37% share in 2023
Table of Contents
Chapter 1. Methodology and Scope
- 1.1. Market Segmentation and Scope
- 1.1.1. Application Segment
- 1.1.2. Type Segment
- 1.1.3. End-use Segment
- 1.2. Regional Scope
- 1.3. Estimates and Forecast Timeline
- 1.4. Research Methodology
- 1.5. Information Procurement
- 1.5.1. Purchased Database
- 1.5.2. GVR's Internal Database
- 1.5.3. Primary Research
- 1.6. Information or Data Analysis:
- 1.6.1. Data Analysis Models
- 1.7. Market Formulation & Validation
- 1.8. Model Details
- 1.8.1. Commodity Flow Analysis
- 1.9. List of Secondary Sources
- 1.10. List of Abbreviations
- 1.11. Objective
Chapter 2. Executive Summary
- 2.1. Market Outlook
- 2.2. Segment Snapshot
- 2.3. Competitive Landscape Snapshot
Chapter 3. Market Variables, Trends, & Scope
- 3.1. Market Lineage Outlook
- 3.1.1. Parent Market Outlook
- 3.1.2. Related/Ancillary Market Outlook
- 3.2. Market Dynamics
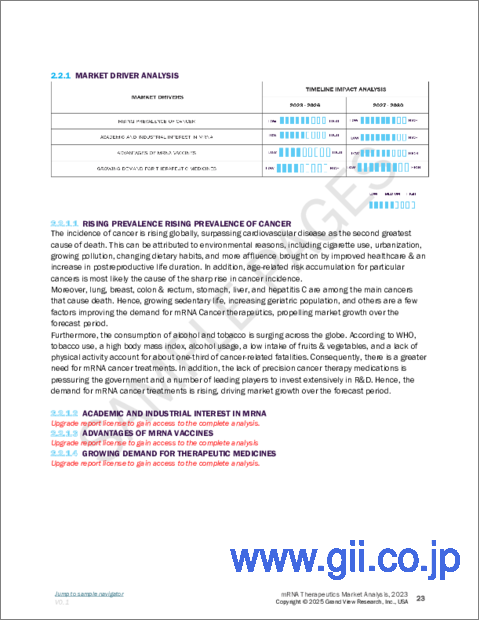
- 3.2.1. Market Driver Analysis
- 3.2.1.1. Rising prevalence of cancer
- 3.2.1.2. Academic and industrial interest in mRNA
- 3.2.1.3. Advantages of mRNA vaccines
- 3.2.1.4. Growing demand for therapeutic medicines
- 3.2.2. Market Restraint Analysis
- 3.2.2.1. Stringent government regulations for mRNA-based product approvals
- 3.2.1. Market Driver Analysis
- 3.3. Industry Analysis Tools
- 3.3.1. Porter's Five Forces Analysis
- 3.3.2. PESTEL Analysis
- 3.3.3. COVID-19 Impact Analysis
Chapter 4. Application Business Analysis
- 4.1. Application Segment Dashboard
- 4.2. mRNA Therapeutics Market Application Movement Analysis
- 4.3. mRNA Therapeutics Market Size & Trend Analysis, by Application, 2018 to 2030 (USD Million)
- 4.4. Rare Genetic Diseases
- 4.4.1. Rare genetic diseases market estimates and forecasts, 2018 - 2030 (USD Million)
- 4.5. Oncology
- 4.5.1. Oncology market estimates and forecasts, 2018 - 2030 (USD Million)
- 4.6. Respiratory Diseases
- 4.6.1. Respiratory diseases market estimates and forecasts, 2018 - 2030 (USD Million)
- 4.7. Infectious Diseases
- 4.7.1. Infectious diseases market estimates and forecasts, 2018 - 2030 (USD Million)
- 4.8. Others
- 4.8.1. Others market estimates and forecasts, 2018 - 2030 (USD Million)
Chapter 5. Type Business Analysis
- 5.1. Type Segment Dashboard
- 5.2. mRNA Therapeutics Market Type Movement Analysis
- 5.3. mRNA Therapeutics Market Size & Trend Analysis, by Type, 2018 to 2030 (USD Million)
- 5.4. Prophylactic
- 5.4.1. Prophylactic market estimates and forecasts, 2018 - 2030 (USD Million)
- 5.5. Therapeutic
- 5.5.1. Therapeutic market estimates and forecasts, 2018 - 2030 (USD Million)
Chapter 6. End-use Business Analysis
- 6.1. End-use Segment Dashboard
- 6.2. mRNA Therapeutics Market End-use Movement Analysis
- 6.3. mRNA Therapeutics Market Size & Trend Analysis, by End-use, 2018 to 2030 (USD Million)
- 6.4. Hospitals & Clinics
- 6.4.1. Hospitals & clinics market estimates and forecasts, 2018 - 2030 (USD Million)
- 6.5. Research Organizations
- 6.5.1. Research organizations market estimates and forecasts, 2018 - 2030 (USD Million)
- 6.6. Others
- 6.6.1. Others market estimates and forecasts, 2018 - 2030 (USD Million)
Chapter 7. Regional Business Analysis by Application, Type, End-use
- 7.1. Regional Dashboard
- 7.2. Market Size & Forecast and Trend Analysis, 2023 & 2030
- 7.3. North America
- 7.3.1. North America mRNA Therapeutics Market, 2018 - 2030 (USD Million)
- 7.3.2. U.S.
- 7.3.2.1. Key Country Dynamics
- 7.3.2.2. Competitive Scenario
- 7.3.2.3. Market Scenario
- 7.3.2.4. Regulatory Framework
- 7.3.2.5. Disease Prevalence
- 7.3.2.6. Reimbursement Scenario
- 7.3.2.7. U.S. mRNA Therapeutics Market, 2018 - 2030 (USD Million)
- 7.3.3. Canada
- 7.3.3.1. Key Country Dynamics
- 7.3.3.2. Competitive Scenario
- 7.3.3.3. Market Scenario
- 7.3.3.4. Regulatory Framework
- 7.3.3.5. Disease Prevalence
- 7.3.3.6. Reimbursement Scenario
- 7.3.3.7. Canada mRNA Therapeutics Market, 2018 - 2030 (USD Million)
- 7.4. Europe
- 7.4.1. Europe mRNA Therapeutics Market, 2018 - 2030 (USD Million)
- 7.4.2. UK
- 7.4.2.1. Key Country Dynamics
- 7.4.2.2. Competitive Scenario
- 7.4.2.3. Market Scenario
- 7.4.2.4. Regulatory Framework
- 7.4.2.5. Disease Prevalence
- 7.4.2.6. Reimbursement Scenario
- 7.4.2.7. UK mRNA Therapeutics Market, 2018 - 2030 (USD Million)
- 7.4.3. Germany
- 7.4.3.1. Key Country Dynamics
- 7.4.3.2. Competitive Scenario
- 7.4.3.3. Market Scenario
- 7.4.3.4. Regulatory Framework
- 7.4.3.5. Disease Prevalence
- 7.4.3.6. Reimbursement Scenario
- 7.4.3.7. Germany mRNA Therapeutics Market, 2018 - 2030 (USD Million)
- 7.4.4. France
- 7.4.4.1. Key Country Dynamics
- 7.4.4.2. Competitive Scenario
- 7.4.4.3. Market Scenario
- 7.4.4.4. Regulatory Framework
- 7.4.4.5. Disease Prevalence
- 7.4.4.6. Reimbursement Scenario
- 7.4.4.7. France mRNA Therapeutics Market, 2018 - 2030 (USD Million)
- 7.4.5. Italy
- 7.4.5.1. Key Country Dynamics
- 7.4.5.2. Competitive Scenario
- 7.4.5.3. Market Scenario
- 7.4.5.4. Regulatory Framework
- 7.4.5.5. Disease Prevalence
- 7.4.5.6. Reimbursement Scenario
- 7.4.5.7. Italy mRNA Therapeutics Market, 2018 - 2030 (USD Million)
- 7.4.6. Spain
- 7.4.6.1. Key Country Dynamics
- 7.4.6.2. Competitive Scenario
- 7.4.6.3. Market Scenario
- 7.4.6.4. Regulatory Framework
- 7.4.6.5. Disease Prevalence
- 7.4.6.6. Reimbursement Scenario
- 7.4.6.7. Spain mRNA Therapeutics Market, 2018 - 2030 (USD Million)
- 7.4.7. Denmark
- 7.4.7.1. Key Country Dynamics
- 7.4.7.2. Competitive Scenario
- 7.4.7.3. Regulatory Framework
- 7.4.7.4. Disease Prevalence
- 7.4.7.5. Reimbursement Scenario
- 7.4.7.6. Denmark mRNA Therapeutics Market, 2018 - 2030 (USD Million)
- 7.4.8. Sweden
- 7.4.8.1. Key Country Dynamics
- 7.4.8.2. Market Scenario
- 7.4.8.3. Regulatory Framework
- 7.4.8.4. Disease Prevalence
- 7.4.8.5. Reimbursement Scenario
- 7.4.8.6. Sweden mRNA Therapeutics Market, 2018 - 2030 (USD Million)
- 7.4.9. Norway
- 7.4.9.1. Key Country Dynamics
- 7.4.9.2. Competitive Scenario
- 7.4.9.3. Regulatory Framework
- 7.4.9.4. Disease Prevalence
- 7.4.9.5. Reimbursement Scenario
- 7.4.9.6. Norway mRNA Therapeutics Market, 2018 - 2030 (USD Million)
- 7.5. Asia Pacific
- 7.5.1. Asia Pacific mRNA Therapeutics Market, 2018 - 2030 (USD Million)
- 7.5.2. Japan
- 7.5.2.1. Key Country Dynamics
- 7.5.2.2. Competitive Scenario
- 7.5.2.3. Regulatory Framework
- 7.5.2.4. Reimbursement Scenario
- 7.5.2.5. Japan mRNA Therapeutics Market, 2018 - 2030 (USD Million)
- 7.5.3. China
- 7.5.3.1. Key Country Dynamics
- 7.5.3.2. Competitive Scenario
- 7.5.3.3. Regulatory Framework
- 7.5.3.4. Reimbursement Scenario
- 7.5.3.5. China mRNA Therapeutics Market, 2018 - 2030 (USD Million)
- 7.5.4. India
- 7.5.4.1. Key Country Dynamics
- 7.5.4.2. Competitive Scenario
- 7.5.4.3. Regulatory Framework
- 7.5.4.4. Reimbursement Scenario
- 7.5.4.5. India mRNA Therapeutics Market, 2018 - 2030 (USD Million)
- 7.5.5. Australia
- 7.5.5.1. Key Country Dynamics
- 7.5.5.2. Competitive Scenario
- 7.5.5.3. Regulatory Framework
- 7.5.5.4. Reimbursement Scenario
- 7.5.5.5. Australia mRNA Therapeutics Market, 2018 - 2030 (USD Million)
- 7.5.6. Thailand
- 7.5.6.1. Key Country Dynamics
- 7.5.6.2. Competitive Scenario
- 7.5.6.3. Regulatory Framework
- 7.5.6.4. Reimbursement Scenario
- 7.5.6.5. Thailand mRNA Therapeutics Market, 2018 - 2030 (USD Million)
- 7.5.7. South Korea
- 7.5.7.1. Key Country Dynamics
- 7.5.7.2. Competitive Scenario
- 7.5.7.3. Regulatory Framework
- 7.5.7.4. Reimbursement Scenario
- 7.5.7.5. South Korea mRNA Therapeutics Market, 2018 - 2030 (USD Million)
- 7.6. Latin America
- 7.6.1. Latin America mRNA Therapeutics Market, 2018 - 2030 (USD Million)
- 7.6.2. Brazil
- 7.6.2.1. Key Country Dynamics
- 7.6.2.2. Competitive Scenario
- 7.6.2.3. Regulatory Framework
- 7.6.2.4. Reimbursement Scenario
- 7.6.2.5. Brazil mRNA Therapeutics Market, 2018 - 2030 (USD Million)
- 7.6.3. Mexico
- 7.6.3.1. Key Country Dynamics
- 7.6.3.2. Competitive Scenario
- 7.6.3.3. Regulatory Framework
- 7.6.3.4. Reimbursement Scenario
- 7.6.3.5. Mexico mRNA Therapeutics Market, 2018 - 2030 (USD Million)
- 7.6.4. Argentina
- 7.6.4.1. Key Country Dynamics
- 7.6.4.2. Competitive Scenario
- 7.6.4.3. Regulatory Framework
- 7.6.4.4. Reimbursement Scenario
- 7.6.4.5. Argentina mRNA Therapeutics Market, 2018 - 2030 (USD Million)
- 7.7. MEA
- 7.7.1. MEA mRNA Therapeutics Market, 2018 - 2030 (USD Million)
- 7.7.2. South Africa
- 7.7.2.1. Key Country Dynamics
- 7.7.2.2. Competitive Scenario
- 7.7.2.3. Market Scenario
- 7.7.2.4. Regulatory Framework
- 7.7.2.5. Disease Prevalence
- 7.7.2.6. Reimbursement Scenario
- 7.7.2.7. South Africa mRNA Therapeutics Market, 2018 - 2030 (USD Million)
- 7.7.3. Saudi Arabia
- 7.7.3.1. Key Country Dynamics
- 7.7.3.2. Competitive Scenario
- 7.7.3.3. Regulatory Framework
- 7.7.3.4. Reimbursement Scenario
- 7.7.3.5. Saudi Arabia mRNA Therapeutics Market, 2018 - 2030 (USD Million)
- 7.7.4. UAE
- 7.7.4.1. Key Country Dynamics
- 7.7.4.2. Competitive Scenario
- 7.7.4.3. Regulatory Framework
- 7.7.4.4. Reimbursement Scenario
- 7.7.4.5. UAE mRNA Therapeutics Market, 2018 - 2030 (USD Million)
- 7.7.5. Kuwait
- 7.7.5.1. Key Country Dynamics
- 7.7.5.2. Competitive Scenario
- 7.7.5.3. Regulatory Framework
- 7.7.5.4. Reimbursement Scenario
- 7.7.5.5. Kuwait mRNA Therapeutics Market, 2018 - 2030 (USD Million)
Chapter 8. Competitive Landscape
- 8.1. Company Categorization
- 8.2. Strategy Mapping
- 8.3. Company Market Position Analysis, 2023
- 8.4. Company Profiles/Listing
- 8.4.1. Moderna Inc.
- 8.4.1.1. Overview
- 8.4.1.2. Financial Performance
- 8.4.1.3. Product Benchmarking
- 8.4.1.4. Strategic Initiatives
- 8.4.2. BioNTech SE
- 8.4.2.1. Overview
- 8.4.2.2. Financial Performance
- 8.4.2.3. Product Benchmarking
- 8.4.2.4. Strategic Initiatives
- 8.4.3. CureVac N.V.
- 8.4.3.1. Overview
- 8.4.3.2. Financial Performance
- 8.4.3.3. Product Benchmarking
- 8.4.3.4. Strategic Initiatives
- 8.4.4. Arcturus Therapeutics
- 8.4.4.1. Overview
- 8.4.4.2. Product Benchmarking
- 8.4.4.3. Strategic Initiatives
- 8.4.5. Sanofi
- 8.4.5.1. Overview
- 8.4.5.2. Financial Performance
- 8.4.5.3. Product Benchmarking
- 8.4.5.4. Strategic Initiatives
- 8.4.6. GSK plc.
- 8.4.6.1. Overview
- 8.4.6.2. Financial Performance
- 8.4.6.3. Product Benchmarking
- 8.4.6.4. Strategic Initiatives
- 8.4.7. Argos Therapeutics Inc.
- 8.4.7.1. Overview
- 8.4.7.2. Financial Performance
- 8.4.7.3. Product Benchmarking
- 8.4.7.4. Strategic Initiatives
- 8.4.8. Ethris
- 8.4.8.1. Overview
- 8.4.8.2. Product Benchmarking
- 8.4.8.3. Strategic Initiatives
- 8.4.9. Pfizer Inc.
- 8.4.9.1. Overview
- 8.4.9.2. Financial Performance
- 8.4.9.3. Product Benchmarking
- 8.4.9.4. Strategic Initiatives
- 8.4.10. AstraZeneca
- 8.4.10.1. Overview
- 8.4.10.2. Financial Performance
- 8.4.10.3. Product Benchmarking
- 8.4.10.4. Strategic Initiatives
- 8.4.1. Moderna Inc.
