|
|
市場調査レポート
商品コード
1726303
オルガノイド・スフェロイドの世界市場:市場規模・シェア・動向分析 (種類別・用途別・最終用途別・地域別)、セグメント別予測 (2025年~2030年)Organoids And Spheroids Market Size, Share & Trends Analysis Report By Type, By Application (Developmental Biology, Personalized Medicine, Regenerative Medicine), By End Use, By Region And Segment Forecasts, 2025 - 2030 |
||||||

|
|||||||
カスタマイズ可能
|
|||||||

| オルガノイド・スフェロイドの世界市場:市場規模・シェア・動向分析 (種類別・用途別・最終用途別・地域別)、セグメント別予測 (2025年~2030年) |
|
出版日: 2025年04月15日
発行: Grand View Research
ページ情報: 英文 120 Pages
納期: 2~10営業日
|

全表示
- 概要
- 図表
- 目次
オルガノイド・スフェロイド市場の成長と動向:
Grand View Research, Inc.の最新レポートによると、世界のオルガノイド・スフェロイドの市場規模は、2025年から2030年にかけて23.23%のCAGRを記録し、2030年までに62億7,000万米ドルに達すると予測されています。
創薬におけるオルガノイド培養の採用の増加、および世界全体での細胞療法と組織工学の需要の高まりが、市場を牽引すると予測されています。
3Dスフェロイドは、複雑な組織や臓器を生成するためのビルディングブロックとして使用できるため、組織工学や再生医療研究の重要な側面と考えられています。加えて、3D細胞培養は薬剤スクリーニングやヒト疾患の分析モデルとして使用できる可能性があり、近い将来、市場に十分な成長機会をもたらすと期待されています。
ヒト特有疾患のメカニズム評価にオルガノイド培養を採用する動きが活発化しており、市場の成長が期待されます。例えば、ヒトオルガノイドは小腸、前立腺、脳、肝臓など幅広い組織の分析に役立っています。ヒト臓器に類似した3D細胞培養の生成は、細胞療法としてのオルガノイドの使用や、全臓器移植の代替品としての可能性に大きな可能性をもたらしています。
オルガノイド・スフェロイド市場:分析概要
- 種類別では、オルガノイドのセグメントが2024年に59.65%の最大売上シェアで市場をリードしました。オルガノイド市場は主に、創薬、疾患モデリング、個別化医療における生理学的に関連性の高い3D細胞培養モデルに対する需要の増加が牽引しています。
- 用途別では、発生生物学分野が2024年に30.17%の最大収益シェアで市場をリードしました。これは、発生生物学におけるオルガノイド・スフェロイド培養システムの利用が増加しているためです。
- 最終用途別では、バイオテクノロジー・製薬産業分野が2024年に46.32%の最大収益シェアで市場をリードしました。
- 北米がオルガノイド・スフェロイド市場を独占し、2024年には34.72%の最大収益シェアを占めました。
目次
第1章 分析方法・範囲
第2章 エグゼクティブサマリー
第3章 オルガノイド・スフェロイド市場:変動要因・傾向・範囲
- 市場連関の見通し
- 親市場の見通し
- 関連/付随市場の見通し
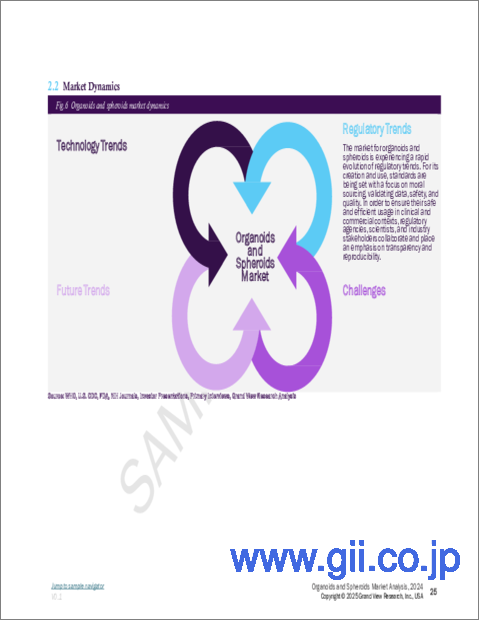
- 市場力学
- 市場促進要因の分析
- 市場抑制要因の分析
- オルガノイド・スフェロイド市場:分析ツール
- 業界分析:ポーターのファイブフォース分析
- PESTEL分析
- COVID-19の影響分析
第4章 種類別のビジネス分析
- セグメントダッシュボード
- 世界のオルガノイド・スフェロイド市場:種類別の変動分析
- 世界のオルガノイド・スフェロイド市場:市場規模と動向分析、種類別(2018~2030年)
- オルガノイド
- オルガノイド:市場の推計・予測(2018~2030年)
- オルガノイド:種類別
- オルガノイド:手法別
- オルガノイド:原料別
- 球状体
- スフェロイド:市場の推計・予測(2018~2030年)
- スフェロイド:種類別
- スフェロイド:手法別
- スフェロイド:原料別
第5章 最終用途別のビジネス分析
- セグメントダッシュボード
- 世界のオルガノイド・スフェロイド市場:最終用途別の変動分析
- 世界のオルガノイド・スフェロイド市場:市場規模と動向分析、最終用途別(2018~2030年)
- バイオテクノロジー・製薬産業
- バイオテクノロジー・製薬産業:市場の推計・予測(2018~2030年)
- 学術研究機関
- 学術研究機関:市場の推計・予測(2018~2030年)
- 病院・診断センター
- 病院・診断センター:市場の推計・予測(2018~2030年)
第6章 用途別のビジネス分析
- セグメントダッシュボード
- 世界のオルガノイド・スフェロイド市場:用途別の変動分析
- 世界のオルガノイド・スフェロイド市場:市場規模と動向分析、用途別(2018~2030年)
- 発生生物学
- 発生生物学:市場の推計・予測(2018~2030年)
- 個別化医療
- 個別化医療:市場の推計・予測(2018~2030年)
- 再生医療
- 再生医療:市場の推計・予測(2018~2030年)
- 疾患病理学研究
- 疾患病理学研究:市場の推計・予測(2018~2030年)
- 薬物毒性・有効性試験
- 薬物毒性・有効性試験:市場の推計・予測(2018~2030年)
第7章 地域別のビジネス分析(国別、種類別、用途別、最終用途別)
- セグメントダッシュボード
- 市場規模の予測と動向分析(2018~2030年)
- 北米
- 北米:市場の推計・予測(2018~2030年)
- 米国
- カナダ
- メキシコ
- 欧州
- 欧州:市場の推計・予測(2018~2030年)
- 英国
- ドイツ
- フランス
- イタリア
- スペイン
- デンマーク
- スウェーデン
- ノルウェー
- アジア太平洋
- アジア太平洋:市場の推計・予測(2018~2030年)
- 中国
- 日本
- インド
- オーストラリア
- タイ
- 韓国
- ラテンアメリカ
- ラテンアメリカ:市場の推計・予測(2018~2030年)
- ブラジル
- アルゼンチン
- 中東・アフリカ
- 中東・アフリカ:市場の推計・予測(2018~2030年)
- サウジアラビア
- 南アフリカ
- アラブ首長国連邦
- クウェート
第8章 競合情勢
- 企業分類
- 戦略マッピング
- 企業ポジション分析(2024年)
- 企業プロファイル/上場企業
- Thermo Fisher Scientific, Inc.
- Merck KGaA
- Lonza
- 3D Biomatrix
- 3D Biotek LLC
- AMS Biotechnology(Europe)Limited
- Cellesce Ltd
- Corning Incorporated
- Greiner Bio-One
- Hubrecht Organoid Technology(HUB)
- InSphero
- Prellis Biologics
- STEMCELL Technologies Inc.
List of Tables
- Table 1 List of Abbreviation
- Table 2 North America organoids and spheroids market, by type, 2018 - 2030 (USD Million)
- Table 3 North America organoids and spheroids market, by End Use, 2018 - 2030 (USD Million)
- Table 4 North America organoids and spheroids market, by application, 2018 - 2030 (USD Million)
- Table 5 North America organoids and spheroids market, by region, 2018 - 2030 (USD Million)
- Table 6 U.S. organoids and spheroids market, by type, 2018 - 2030 (USD Million)
- Table 7 U.S. organoids and spheroids market, by end use, 2018 - 2030 (USD Million)
- Table 8 U.S. organoids and spheroids market, by application, 2018 - 2030 (USD Million)
- Table 9 Canada organoids and spheroids market, by type, 2018 - 2030 (USD Million)
- Table 10 Canada organoids and spheroids market, by end use, 2018 - 2030 (USD Million)
- Table 11 Canada organoids and spheroids market, by application, 2018 - 2030 (USD Million)
- Table 12 Mexico organoids and spheroids market, by type, 2018 - 2030 (USD Million)
- Table 13 Mexico organoids and spheroids market, by end use, 2018 - 2030 (USD Million)
- Table 14 Mexico organoids and spheroids market, by application, 2018 - 2030 (USD Million)
- Table 15 Europe organoids and spheroids market, by type, 2018 - 2030 (USD Million)
- Table 16 Europe organoids and spheroids market, by end use, 2018 - 2030 (USD Million)
- Table 17 Europe organoids and spheroids market, by application, 2018 - 2030 (USD Million)
- Table 18 Europe organoids and spheroids market, by region, 2018 - 2030 (USD Million)
- Table 19 Germany organoids and spheroids market, by type, 2018 - 2030 (USD Million)
- Table 20 Germany organoids and spheroids market, by end use, 2018 - 2030 (USD Million)
- Table 21 Germany organoids and spheroids market, by application, 2018 - 2030 (USD Million)
- Table 22 UK organoids and spheroids market, by type, 2018 - 2030 (USD Million)
- Table 23 UK organoids and spheroids market, by end use, 2018 - 2030 (USD Million)
- Table 24 UK organoids and spheroids market, by application, 2018 - 2030 (USD Million)
- Table 25 France organoids and spheroids market, by type, 2018 - 2030 (USD Million)
- Table 26 France organoids and spheroids market, by end use, 2018 - 2030 (USD Million)
- Table 27 France organoids and spheroids market, by application, 2018 - 2030 (USD Million)
- Table 28 Italy organoids and spheroids market, by type, 2018 - 2030 (USD Million)
- Table 29 Italy organoids and spheroids market, by end use, 2018 - 2030 (USD Million)
- Table 30 Italy organoids and spheroids market, by application, 2018 - 2030 (USD Million)
- Table 31 Spain organoids and spheroids market, by type, 2018 - 2030 (USD Million)
- Table 32 Spain organoids and spheroids market, by end use, 2018 - 2030 (USD Million)
- Table 33 Spain organoids and spheroids market, by application, 2018 - 2030 (USD Million)
- Table 34 Sweden organoids and spheroids market, by type, 2018 - 2030 (USD Million)
- Table 35 Sweden organoids and spheroids market, by end use, 2018 - 2030 (USD Million)
- Table 36 Sweden organoids and spheroids market, by application, 2018 - 2030 (USD Million)
- Table 37 Norway organoids and spheroids market, by type, 2018 - 2030 (USD Million)
- Table 38 Norway organoids and spheroids market, by end use, 2018 - 2030 (USD Million)
- Table 39 Norway organoids and spheroids market, by application, 2018 - 2030 (USD Million)
- Table 40 Denmark organoids and spheroids market, by type, 2018 - 2030 (USD Million)
- Table 41 Denmark organoids and spheroids market, by end use, 2018 - 2030 (USD Million)
- Table 42 Denmark organoids and spheroids market, by application, 2018 - 2030 (USD Million)
- Table 43 APAC organoids and spheroids market, by type, 2018 - 2030 (USD Million)
- Table 44 APAC organoids and spheroids market, by end use, 2018 - 2030 (USD Million)
- Table 45 APAC organoids and spheroids market, by application, 2018 - 2030 (USD Million)
- Table 46 APAC organoids and spheroids market, by region, 2018 - 2030 (USD Million)
- Table 47 China organoids and spheroids market, by type, 2018 - 2030 (USD Million)
- Table 48 China organoids and spheroids market, by end use, 2018 - 2030 (USD Million)
- Table 49 China organoids and spheroids market, by application, 2018 - 2030 (USD Million)
- Table 50 Japan organoids and spheroids market, by type, 2018 - 2030 (USD Million)
- Table 51 Japan organoids and spheroids market, by end use, 2018 - 2030 (USD Million)
- Table 52 Japan organoids and spheroids market, by application, 2018 - 2030 (USD Million)
- Table 53 India organoids and spheroids market, by type, 2018 - 2030 (USD Million)
- Table 54 India organoids and spheroids market, by end use, 2018 - 2030 (USD Million)
- Table 55 India organoids and spheroids market, by application, 2018 - 2030 (USD Million)
- Table 56 Thailand organoids and spheroids market, by type, 2018 - 2030 (USD Million)
- Table 57 Thailand organoids and spheroids market, by end use, 2018 - 2030 (USD Million)
- Table 58 Thailand organoids and spheroids market, by application, 2018 - 2030 (USD Million)
- Table 59 South Korea organoids and spheroids market, by type, 2018 - 2030 (USD Million)
- Table 60 South Korea organoids and spheroids market, by end use, 2018 - 2030 (USD Million)
- Table 61 South Korea organoids and spheroids market, by application, 2018 - 2030 (USD Million)
- Table 62 Australia organoids and spheroids market, by type, 2018 - 2030 (USD Million)
- Table 63 Australia organoids and spheroids market, by end use, 2018 - 2030 (USD Million)
- Table 64 Australia organoids and spheroids market, by application, 2018 - 2030 (USD Million)
- Table 65 Latin America organoids and spheroids market, by type, 2018 - 2030 (USD Million)
- Table 66 Latin America organoids and spheroids market, by end use, 2018 - 2030 (USD Million)
- Table 67 Latin America organoids and spheroids market, by application, 2018 - 2030 (USD Million)
- Table 68 Latin America organoids and spheroids market, by region, 2018 - 2030 (USD Million)
- Table 69 Brazil organoids and spheroids market, by type, 2018 - 2030 (USD Million)
- Table 70 Brazil organoids and spheroids market, by end use, 2018 - 2030 (USD Million)
- Table 71 Brazil organoids and spheroids market, by application, 2018 - 2030 (USD Million)
- Table 72 Argentina organoids and spheroids market, by type, 2018 - 2030 (USD Million)
- Table 73 Argentina organoids and spheroids market, by end use, 2018 - 2030 (USD Million)
- Table 74 Argentina organoids and spheroids market, by application, 2018 - 2030 (USD Million)
- Table 75 Middle East and Africa organoids and spheroids market, by type, 2018 - 2030 (USD Million)
- Table 76 Middle East and Africa organoids and spheroids market, by end use, 2018 - 2030 (USD Million)
- Table 77 Middle East and Africa organoids and spheroids market, by application, 2018 - 2030 (USD Million)
- Table 78 Middle East and Africa organoids and spheroids market, by region, 2018 - 2030 (USD Million)
- Table 79 South Africa organoids and spheroids market, by type, 2018 - 2030 (USD Million)
- Table 80 South Africa organoids and spheroids market, by end use, 2018 - 2030 (USD Million)
- Table 81 South Africa organoids and spheroids market, by application, 2018 - 2030 (USD Million)
- Table 82 Saudi Arabia organoids and spheroids market, by type, 2018 - 2030 (USD Million)
- Table 83 Saudi Arabia organoids and spheroids market, by end use, 2018 - 2030 (USD Million)
- Table 84 Saudi Arabia organoids and spheroids market, by application, 2018 - 2030 (USD Million)
- Table 85 UAE organoids and spheroids market, by type, 2018 - 2030 (USD Million)
- Table 86 UAE organoids and spheroids market, by end use, 2018 - 2030 (USD Million)
- Table 87 UAE organoids and spheroids market, by application, 2018 - 2030 (USD Million)
- Table 88 Kuwait organoids and spheroids market, by type, 2018 - 2030 (USD Million)
- Table 89 Kuwait organoids and spheroids market, by end use, 2018 - 2030 (USD Million)
- Table 90 Kuwait organoids and spheroids market, by application, 2018 - 2030 (USD Million)
List of Figures
- Fig. 1 Market research process
- Fig. 2 Data triangulation techniques
- Fig. 3 Primary research pattern
- Fig. 4 Market research approaches
- Fig. 5 Value-chain-based sizing & forecasting
- Fig. 6 QFD modeling for market share assessment
- Fig. 7 Market formulation & validation
- Fig. 8 Organoids and Spheroids: Market Outlook
- Fig. 9 Organoids and Spheroids competitive insights
- Fig. 10 Parent market outlook
- Fig. 11 Related/ancillary market outlook
- Fig. 12 Organoids and Spheroids market driver impact
- Fig. 13 Organoids and Spheroids market restraint impact
- Fig. 14 Organoids and Spheroids market strategic initiatives analysis
- Fig. 15 Organoids and Spheroids market: type movement analysis
- Fig. 16 Organoids and Spheroids market: type outlook and key takeaways
- Fig. 17 Neural organoids market estimates and forecast, 2018 - 2030
- Fig. 18 Hepatic organoids market estimates and forecast, 2018 - 2030
- Fig. 19 Intestinal organoids market estimates and forecast, 2018 - 2030
- Fig. 20 Other organoids market estimates and forecast, 2018 - 2030
- Fig. 21 General submerged method for organoid culture market estimates and forecast, 2018 - 2030
- Fig. 22 Crypt organoid culture techniques market estimates and forecast, 2018 - 2030
- Fig. 23 ALI method for organoid culture market estimates and forecast, 2018 - 2030
- Fig. 24 Clonal Organoids from Lgr5+ Cells market estimates and forecast, 2018 - 2030
- Fig. 25 Brain and Retina Organoid Formation Protocol market estimates and forecast, 2018 - 2030
- Fig. 26 Others Organoid Formation Protocol market estimates and forecast, 2018 - 2030
- Fig. 27 Primary tissues market estimates and forecast, 2018 - 2030
- Fig. 28 Stem cells market estimates and forecast, 2018 - 2030
- Fig. 29 Spheroids market estimates and forecast, 2018 - 2030
- Fig. 30 MCTS market estimates and forecast, 2018 - 2030
- Fig. 31 Neurospheres market estimates and forecast, 2018 - 2030
- Fig. 32 Mammospheres market estimates and forecast, 2018 - 2030
- Fig. 33 Hepatospheres market estimates and forecast, 2018 - 2030
- Fig. 34 Embryoid bodies market estimates and forecast, 2018 - 2030
- Fig. 35 Micropatterned plates market estimates and forecast, 2018 - 2030
- Fig. 36 Low cell attachment plates market estimates and forecast, 2018 - 2030
- Fig. 37 Hanging drop method for spheroid culture market estimates and forecast, 2018 - 2030
- Fig. 38 Other methods for spheroid culture market estimates and forecast, 2018 - 2030
- Fig. 39 Cell line market estimates and forecast, 2018 - 2030
- Fig. 40 Primary cell market estimates and forecast, 2018 - 2030
- Fig. 41 iPSCs derived cells market estimates and forecast, 2018 - 2030
- Fig. 42 Organoids and spheroids market: End Use movement analysis
- Fig. 43 Organoids and spheroids market: End Use outlook and key takeaways
- Fig. 44 Biotechnology and pharmaceutical industries market estimates and forecast, 2018 - 2030
- Fig. 45 Academic & research institutes market estimates and forecast, 2018 - 2030
- Fig. 46 Hospitals and diagnostic centers market estimates and forecast, 2018 - 2030
- Fig. 47 Organoids and spheroids market: application movement analysis
- Fig. 48 Organoids and spheroids market: application outlook and key takeaways
- Fig. 49 Developmental biology market estimates and forecast, 2018 - 2030
- Fig. 50 Personalized medicine market estimates and forecast, 2018 - 2030
- Fig. 51 Regenerative medicine market estimates and forecast, 2018 - 2030
- Fig. 52 Disease pathology studies market estimates and forecast, 2018 - 2030
- Fig. 53 Drug toxicity & efficacy testing market estimates and forecast, 2018 - 2030
- Fig. 54 Global Organoids and spheroids market: regional movement analysis
- Fig. 55 Global Organoids and spheroids market: regional outlook and key takeaways
- Fig. 56 North America
- Fig. 57 North America market estimates and forecast, 2018 - 2030
- Fig. 58 US key country dynamics
- Fig. 59 US market estimates and forecast, 2018 - 2030
- Fig. 60 Canada key country dynamics
- Fig. 61 Canada market estimates and forecast, 2018 - 2030
- Fig. 62 Mexico key country dynamics
- Fig. 63 Mexico market estimates and forecast, 2018 - 2030
- Fig. 64 Europe
- Fig. 65 Europe market estimates and forecast, 2018 - 2030
- Fig. 66 UK key country dynamics
- Fig. 67 UK market estimates and forecast, 2018 - 2030
- Fig. 68 Germany key country dynamics
- Fig. 69 Germany market estimates and forecast, 2018 - 2030
- Fig. 70 France key country dynamics
- Fig. 71 France market estimates and forecast, 2018 - 2030
- Fig. 72 Italy key country dynamics
- Fig. 73 Italy market estimates and forecast, 2018 - 2030
- Fig. 74 Spain key country dynamics
- Fig. 75 Spain market estimates and forecast, 2018 - 2030
- Fig. 76 Sweden key country dynamics
- Fig. 77 Sweden market estimates and forecast, 2018 - 2030
- Fig. 78 Norway key country dynamics
- Fig. 79 Norway market estimates and forecast, 2018 - 2030
- Fig. 80 Denmark key country dynamics
- Fig. 81 Denmark market estimates and forecast, 2018 - 2030
- Fig. 82 Asia Pacific
- Fig. 83 Asia Pacific market estimates and forecast, 2018 - 2030
- Fig. 84 China key country dynamics
- Fig. 85 China market estimates and forecast, 2018 - 2030
- Fig. 86 Japan key country dynamics
- Fig. 87 Japan market estimates and forecast, 2018 - 2030
- Fig. 88 India key country dynamics
- Fig. 89 India market estimates and forecast, 2018 - 2030
- Fig. 90 Australia key country dynamics
- Fig. 91 Australia market estimates and forecast, 2018 - 2030
- Fig. 92 Thailand key country dynamics
- Fig. 93 Thailand market estimates and forecast, 2018 - 2030
- Fig. 94 South Korea key country dynamics
- Fig. 95 South Korea market estimates and forecast, 2018 - 2030
- Fig. 96 Latin America
- Fig. 97 Latin America market estimates and forecast, 2018 - 2030
- Fig. 98 Brazil key country dynamics
- Fig. 99 Brazil market estimates and forecast, 2018 - 2030
- Fig. 100 Argentina key country dynamics
- Fig. 101 Argentina market estimates and forecast, 2018 - 2030
- Fig. 102 Middle East and Africa
- Fig. 103 Middle East and Africa market estimates and forecast, 2018 - 2030
- Fig. 104 Saudi Arabia key country dynamics
- Fig. 105 Saudi Arabia market estimates and forecast, 2018 - 2030
- Fig. 106 South Africa key country dynamics
- Fig. 107 South Africa market estimates and forecast, 2018 - 2030
- Fig. 108 UAE key country dynamics
- Fig. 109 UAE market estimates and forecast, 2018 - 2030
- Fig. 110 Kuwait key country dynamics
- Fig. 111 Kuwait market estimates and forecast, 2018 - 2030
Organoids And Spheroids Market Growth & Trends:
The global organoids and spheroids market size is expected to reach USD 6.27 billion by 2030, registering a CAGR of 23.23% from 2025 to 2030, according to a new report by Grand View Research, Inc., A rise in the adoption of organoid cultures in drug discovery, and rising demand for cell therapy and tissue engineering across the globe is expected to drive the market.
3D spheroids are considered as an important aspect of tissue engineering and regenerative medicine research as they can be used as building blocks for the generation of complex tissues and organs. In addition, the potential of 3D cell cultures to be used as models for drug screening and analysis of human disorders are expected to provide ample growth opportunities to the market in the near future.
A rise in the adoption of organoid cultures for the assessment of the mechanism of human-specific disorders is expected to enhance the market growth. For instance, human organoids have helped in the analysis of a wide range of tissues including the small intestine, prostate, brain, and liver. The promise of the generation of 3D cell cultures that resemble human organs has brought an enormous potential for the use of organoids as cell therapies, and as prospective substitutes for whole-organ transplantation.
Organoids And Spheroids Market Report Highlights:
- Based on type, the organoids segment led the market with the largest revenue share of 59.65% in 2024. The organoid market is primarily driven by the increasing demand for physiologically relevant 3D cell culture models in drug discovery, disease modeling, and personalized medicine.
- Based on application, the developmental biology segment led the market with the largest revenue share of 30.17% in 2024, owing to the rising usage of organoid and spheroid culture systems for developmental biology.
- Based on end use, the biotechnology and pharmaceutical industries segment led the market with the largest revenue share of 46.32% in 2024.
- North America dominated the organoids and spheroids market with the largest revenue share of 34.72% in 2024.
Table of Contents
Chapter 1. Methodology and Scope
- 1.1. Market Segmentation & Scope
- 1.1.1. Type
- 1.1.2. Application
- 1.1.3. End Use
- 1.2. Research Methodology
- 1.3. Information Procurement
- 1.3.1. Purchased database
- 1.3.2. GVR's internal database
- 1.3.3. Secondary sources
- 1.3.4. Primary research
- 1.3.5. Details of primary research
- 1.4. Information or Data Analysis
- 1.4.1. Data analysis models
- 1.5. Market Formulation & Validation
- 1.6. Model Details
- 1.6.1. Commodity flow analysis
- 1.7. List of Secondary Sources
- 1.8. List of Primary Sources
- 1.9. Objectives
Chapter 2. Executive Summary
- 2.1. Market Outlook
- 2.2. Segment Snapshot
- 2.3. Competitive Landscape Snapshot
Chapter 3. Organoids & Spheroids Market Variables and Trends
- 3.1. Market Lineage Outlook
- 3.1.1. Parent market outlook
- 3.1.2. Related/ancillary market outlook
- 3.2. Market Dynamics
- 3.2.1. Market driver analysis
- 3.2.1.1. High adoption of organoids & spheroids in drug discovery
- 3.2.1.2. Technological advancements
- 3.2.1.3. Rising demand for tissue engineering & organ transplantation
- 3.2.2. Market restraint analysis
- 3.2.2.1. Challenges associated with 3D cell culturing
- 3.2.2.2. Ethical issues associated with organoid & spheroid cultures
- 3.2.1. Market driver analysis
- 3.3. Organoids & Spheroids Market Analysis Tools
- 3.3.1. Porter's Five Forces Analysis
- 3.3.2. PESTEL Analysis
- 3.3.3. COVID-19 Impact Analysis
Chapter 4. Type Business Analysis
- 4.1. Segment Dashboard
- 4.2. Global Organoids & Spheroids Market: Type Movement Analysis
- 4.3. Global Organoids & Spheroids Market Size & Trend Analysis, by Type, 2018 to 2030 (USD Million)
- 4.4. Organoids
- 4.4.1. Organoids market estimates and forecast, 2018 - 2030
- 4.4.2. Organoids by Type
- 4.4.2.1. Neural Organoids
- 4.4.2.1.1. Neural organoids market estimates and forecast, 2018 - 2030
- 4.4.2.2. Hepatic Organoids
- 4.4.2.2.1. Hepatic organoids market estimates and forecast, 2018 - 2030
- 4.4.2.3. Intestinal organoids
- 4.4.2.3.1. Intestinal organoids market estimates and forecast, 2018 - 2030
- 4.4.2.4. Other organoids
- 4.4.2.4.1. Other organoids market estimates and forecast, 2018 - 2030
- 4.4.2.1. Neural Organoids
- 4.4.3. Organoids by Method
- 4.4.3.1. General Submerged Method for Organoid Culture
- 4.4.3.1.1. General Submerged Method for Organoid Culture market estimates and forecast, 2018 - 2030
- 4.4.3.2. Crypt Organoid Culture Techniques
- 4.4.3.2.1. Crypt Organoid Culture Techniques market estimates and forecast, 2018 - 2030
- 4.4.3.3. Air Liquid Interface (ALI) Method for Organoid Culture
- 4.4.3.3.1. ALI Method for Organoid Culture market estimates and forecast, 2018 - 2030
- 4.4.3.4. Clonal Organoids from Lgr5+ Cells
- 4.4.3.4.1. Clonal Organoids from Lgr5+ Cells market estimates and forecast, 2018 - 2030
- 4.4.3.5. Brain and Retina Organoid Formation Protocol
- 4.4.3.5.1. Brain and Retina Organoid Formation Protocol market estimates and forecast, 2018 - 2030
- 4.4.3.6. Others
- 4.4.3.6.1. Others market estimates and forecast, 2018 - 2030
- 4.4.3.1. General Submerged Method for Organoid Culture
- 4.4.4. Organoids by Source
- 4.4.4.1. Primary Tissues
- 4.4.4.1.1. Primary tissues market estimates and forecast, 2018 - 2030
- 4.4.4.2. Stem Cells
- 4.4.4.2.1. Stem cells market estimates and forecast, 2018 - 2030
- 4.4.4.1. Primary Tissues
- 4.5. Spheroids
- 4.5.1. Spheroids market estimates and forecast, 2018 - 2030
- 4.5.2. Spheroids by Type
- 4.5.2.1. Multicellular tumor spheroids (MCTS)
- 4.5.2.1.1. MCTS market estimates and forecast, 2018 - 2030
- 4.5.2.2. Neurospheres
- 4.5.2.2.1. Neurospheres market estimates and forecast, 2018 - 2030
- 4.5.2.3. Mammospheres
- 4.5.2.3.1. Mammospheres market estimates and forecast, 2018 - 2030
- 4.5.2.4. Hepatospheres
- 4.5.2.4.1. Hepatospheres market estimates and forecast, 2018 - 2030
- 4.5.2.5. Embryoid bodies
- 4.5.2.5.1. Embryoid bodies market estimates and forecast, 2018 - 2030
- 4.5.2.1. Multicellular tumor spheroids (MCTS)
- 4.5.3. Spheroids by Method
- 4.5.3.1. Micropatterned Plates
- 4.5.3.1.1. Micropatterned Plates market estimates and forecast, 2018 - 2030
- 4.5.3.2. Low Cell Attachment Plates
- 4.5.3.2.1. Low Cell Attachment Plates market estimates and forecast, 2018 - 2030
- 4.5.3.3. Hanging Drop Method
- 4.5.3.3.1. Hanging Drop Method for spheroid Culture market estimates and forecast, 2018 - 2030
- 4.5.3.4. Others
- 4.5.3.4.1. Other methods for spheroid culture market estimates and forecast, 2018 - 2030
- 4.5.3.1. Micropatterned Plates
- 4.5.4. Spheroids by Source
- 4.5.4.1. Cell Line
- 4.5.4.1.1. Cell line market estimates and forecast, 2018 - 2030
- 4.5.4.2. Primary Cell
- 4.5.4.2.1. Primary cell market estimates and forecast, 2018 - 2030
- 4.5.4.3. iPSCs Derived Cells
- 4.5.4.3.1. iPSCs Derived Cells market estimates and forecast, 2018 - 2030
- 4.5.4.1. Cell Line
Chapter 5. End Use Business Analysis
- 5.1. Segment Dashboard
- 5.2. Global Organoids & Spheroids Market: End Use Movement Analysis
- 5.3. Global Organoids & Spheroids Market Size & Trend Analysis, by End Use, 2018 to 2030 (USD Million)
- 5.4. Biotechnology and Pharmaceutical Industries
- 5.4.1. Biotechnology and Pharmaceutical Industries market estimates and forecast 2018 to 2030 (USD million)
- 5.5. Academic & Research Institutes
- 5.5.1. Academic & Research Institutes market estimates and forecast 2018 to 2030 (USD Million)
- 5.6. Hospitals and Diagnostic Centers
- 5.6.1. Hospitals and Diagnostic Centers market estimates and forecast 2018 to 2030 (USD million)
Chapter 6. Application Business Analysis
- 6.1. Segment Dashboard
- 6.2. Global Organoids & Spheroids Market: Application Movement Analysis
- 6.3. Global Organoids & Spheroids Market Size & Trend Analysis, by Application, 2018 to 2030 (USD Million)
- 6.4. Developmental Biology
- 6.4.1. Developmental Biology market estimates and forecast 2018 to 2030 (USD million)
- 6.5. Personalized Medicine
- 6.5.1. Personalized Medicine market estimates and forecast 2018 to 2030 (USD Million)
- 6.6. Regenerative Medicine
- 6.6.1. Regenerative Medicine market estimates and forecast 2018 to 2030 (USD million)
- 6.7. Disease Pathology Studies
- 6.7.1. Disease Pathology Studies market estimates and forecast 2018 to 2030 (USD Million)
- 6.8. Drug Toxicity & Efficacy Testing
- 6.8.1. Drug Toxicity & Efficacy Testing market estimates and forecast 2018 to 2030 (USD Million)
Chapter 7. Regional Business Analysis, By Country, Type, Application, & End Use
- 7.1. Segment Dashboard
- 7.2. Market Size & Forecasts and Trend Analysis, 2018 to 2030
- 7.3. North America
- 7.3.1. North America Market estimates and forecast, 2018 - 2030 (Revenue, USD Billion)
- 7.3.2. U.S.
- 7.3.2.1. Key Country Dynamics
- 7.3.2.2. Target Disease Prevalence
- 7.3.2.3. Competitive Scenario
- 7.3.2.4. U.S. market estimates and forecast, 2018 - 2030 (Revenue, USD Billion)
- 7.3.3. Canada
- 7.3.3.1. Key Country Dynamics
- 7.3.3.2. Target Disease Prevalence
- 7.3.3.3. Competitive Scenario
- 7.3.3.4. Canada market estimates and forecast, 2018 - 2030 (Revenue, USD Billion)
- 7.3.4. Mexico
- 7.3.4.1. Key Country Dynamics
- 7.3.4.2. Target Disease Prevalence
- 7.3.4.3. Competitive Scenario
- 7.3.4.4. Mexico market estimates and forecast, 2018 - 2030 (Revenue, USD Billion)
- 7.4. Europe
- 7.4.1. Europe Market estimates and forecast, 2018 - 2030 (Revenue, USD Billion)
- 7.4.2. UK
- 7.4.2.1. Key Country Dynamics
- 7.4.2.2. Target Disease Prevalence
- 7.4.2.3. Competitive Scenario
- 7.4.2.4. UK market estimates and forecast, 2018 - 2030 (Revenue, USD Billion)
- 7.4.3. Germany
- 7.4.3.1. Key Country Dynamics
- 7.4.3.2. Target Disease Prevalence
- 7.4.3.3. Competitive Scenario
- 7.4.3.4. Germany market estimates and forecast, 2018 - 2030 (Revenue, USD Billion)
- 7.4.4. France
- 7.4.4.1. Key Country Dynamics
- 7.4.4.2. Target Disease Prevalence
- 7.4.4.3. Competitive Scenario
- 7.4.4.4. France market estimates and forecast, 2018 - 2030 (Revenue, USD Billion)
- 7.4.5. Italy
- 7.4.5.1. Key Country Dynamics
- 7.4.5.2. Target Disease Prevalence
- 7.4.5.3. Competitive Scenario
- 7.4.5.4. Italy market estimates and forecast, 2018 - 2030 (Revenue, USD Billion)
- 7.4.6. Spain
- 7.4.6.1. Key Country Dynamics
- 7.4.6.2. Target Disease Prevalence
- 7.4.6.3. Competitive Scenario
- 7.4.6.4. Spain market estimates and forecast, 2018 - 2030 (Revenue, USD Billion)
- 7.4.7. Denmark
- 7.4.7.1. Key Country Dynamics
- 7.4.7.2. Target Disease Prevalence
- 7.4.7.3. Competitive Scenario
- 7.4.7.4. Denmark market estimates and forecast, 2018 - 2030 (Revenue, USD Billion)
- 7.4.8. Sweden
- 7.4.8.1. Key Country Dynamics
- 7.4.8.2. Target Disease Prevalence
- 7.4.8.3. Competitive Scenario
- 7.4.8.4. Sweden market estimates and forecast, 2018 - 2030 (Revenue, USD Billion)
- 7.4.9. Norway
- 7.4.9.1. Key Country Dynamics
- 7.4.9.2. Target Disease Prevalence
- 7.4.9.3. Competitive Scenario
- 7.4.9.4. Norway market estimates and forecast, 2018 - 2030 (Revenue, USD Billion)
- 7.5. Asia Pacific
- 7.5.1. Asia Pacific Market estimates and forecast, 2018 - 2030 (Revenue, USD Billion)
- 7.5.2. China
- 7.5.2.1. Key Country Dynamics
- 7.5.2.2. Target Disease Prevalence
- 7.5.2.3. Competitive Scenario
- 7.5.2.4. China market estimates and forecast, 2018 - 2030 (Revenue, USD Billion)
- 7.5.3. Japan
- 7.5.3.1. Key Country Dynamics
- 7.5.3.2. Target Disease Prevalence
- 7.5.3.3. Competitive Scenario
- 7.5.3.4. Japan market estimates and forecast, 2018 - 2030 (Volume, Thousand)
- 7.5.4. India
- 7.5.4.1. Key Country Dynamics
- 7.5.4.2. Target Disease Prevalence
- 7.5.4.3. Competitive Scenario
- 7.5.4.4. India market estimates and forecast, 2018 - 2030 (Revenue, USD Billion)
- 7.5.5. Australia
- 7.5.5.1. Key Country Dynamics
- 7.5.5.2. Target Disease Prevalence
- 7.5.5.3. Competitive Scenario
- 7.5.5.4. Australia market estimates and forecast, 2018 - 2030 (Revenue, USD Billion)
- 7.5.6. Thailand
- 7.5.6.1. Key Country Dynamics
- 7.5.6.2. Target Disease Prevalence
- 7.5.6.3. Competitive Scenario
- 7.5.6.4. Thailand market estimates and forecast, 2018 - 2030 (Revenue, USD Billion)
- 7.5.7. South Korea
- 7.5.7.1. Key Country Dynamics
- 7.5.7.2. Target Disease Prevalence
- 7.5.7.3. Competitive Scenario
- 7.5.7.4. South Korea market estimates and forecast, 2018 - 2030 (Revenue, USD Billion)
- 7.6. Latin America
- 7.6.1. Latin America Market estimates and forecast, 2018 - 2030 (Revenue, USD Billion)
- 7.6.2. Brazil
- 7.6.2.1. Key Country Dynamics
- 7.6.2.2. Target Disease Prevalence
- 7.6.2.3. Competitive Scenario
- 7.6.2.4. Brazil market estimates and forecast, 2018 - 2030 (Revenue, USD Billion)
- 7.6.3. Argentina
- 7.6.3.1. Key Country Dynamics
- 7.6.3.2. Target Disease Prevalence
- 7.6.3.3. Competitive Scenario
- 7.6.3.4. Argentina market estimates and forecast, 2018 - 2030 (Revenue, USD Billion)
- 7.7. MEA
- 7.7.1. MEA Market estimates and forecast, 2018 - 2030 (Revenue, USD Billion)
- 7.7.2. Saudi Arabia
- 7.7.2.1. Key Country Dynamics
- 7.7.2.2. Target Disease Prevalence
- 7.7.2.3. Competitive Scenario
- 7.7.2.4. Saudi Arabia market estimates and forecast, 2018 - 2030 (Revenue, USD Billion)
- 7.7.3. South Africa
- 7.7.3.1. Key Country Dynamics
- 7.7.3.2. Target Disease Prevalence
- 7.7.3.3. Competitive Scenario
- 7.7.3.4. South Africa market estimates and forecast, 2018 - 2030 (Revenue, USD Billion)
- 7.7.4. UAE
- 7.7.4.1. Key Country Dynamics
- 7.7.4.2. Target Disease Prevalence
- 7.7.4.3. Competitive Scenario
- 7.7.4.4. UAE market estimates and forecast, 2018 - 2030 (Revenue, USD Billion)
- 7.7.5. Kuwait
- 7.7.5.1. Key Country Dynamics
- 7.7.5.2. Target Disease Prevalence
- 7.7.5.3. Competitive Scenario
- 7.7.5.4. Kuwait market estimates and forecast, 2018 - 2030 (Revenue, USD Billion)
Chapter 8. Competitive Landscape
- 8.1. Company Categorization
- 8.2. Strategy Mapping
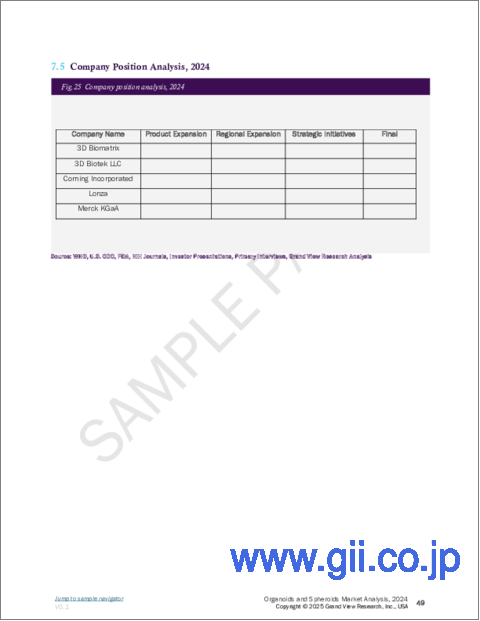
- 8.3. Company Position Analysis, 2024
- 8.4. Company Profiles/Listing
- 8.4.1. Thermo Fisher Scientific, Inc.
- 8.4.1.1. Company overview
- 8.4.1.2. Financial performance
- 8.4.1.3. Product benchmarking
- 8.4.1.4. Strategic initiatives
- 8.4.2. Merck KGaA
- 8.4.2.1. Company overview
- 8.4.2.2. Financial performance
- 8.4.2.3. Product benchmarking
- 8.4.2.4. Strategic initiatives
- 8.4.3. Lonza
- 8.4.3.1. Company overview
- 8.4.3.2. Financial performance
- 8.4.3.3. Product benchmarking
- 8.4.3.4. Strategic initiatives
- 8.4.4. 3D Biomatrix
- 8.4.4.1. Company overview
- 8.4.4.2. Financial performance
- 8.4.4.3. Product benchmarking
- 8.4.4.4. Strategic initiatives
- 8.4.5. 3D Biotek LLC
- 8.4.5.1. Company overview
- 8.4.5.2. Financial performance
- 8.4.5.3. Product benchmarking
- 8.4.5.4. Strategic initiatives
- 8.4.6. AMS Biotechnology (Europe) Limited
- 8.4.6.1. Company overview
- 8.4.6.2. Financial performance
- 8.4.6.3. Product benchmarking
- 8.4.6.4. Strategic initiatives
- 8.4.7. Cellesce Ltd
- 8.4.7.1. Company overview
- 8.4.7.2. Financial performance
- 8.4.7.3. Product benchmarking
- 8.4.7.4. Strategic initiatives
- 8.4.8. Corning Incorporated
- 8.4.8.1. Company overview
- 8.4.8.2. Financial performance
- 8.4.8.3. Product benchmarking
- 8.4.8.4. Strategic initiatives
- 8.4.9. Greiner Bio-One
- 8.4.9.1. Company overview
- 8.4.9.2. Financial performance
- 8.4.9.3. Product benchmarking
- 8.4.9.4. Strategic initiatives
- 8.4.10. Hubrecht Organoid Technology (HUB)
- 8.4.10.1. Company overview
- 8.4.10.2. Financial performance
- 8.4.10.3. Product benchmarking
- 8.4.10.4. Strategic initiatives
- 8.4.11. InSphero
- 8.4.11.1. Company overview
- 8.4.11.2. Financial performance
- 8.4.11.3. Product benchmarking
- 8.4.11.4. Strategic initiatives
- 8.4.12. Prellis Biologics
- 8.4.12.1. Company overview
- 8.4.12.2. Financial performance
- 8.4.12.3. Product benchmarking
- 8.4.12.4. Strategic initiatives
- 8.4.13. STEMCELL Technologies Inc.
- 8.4.13.1. Company overview
- 8.4.13.2. Financial performance
- 8.4.13.3. Product benchmarking
- 8.4.13.4. Strategic initiatives
- 8.4.1. Thermo Fisher Scientific, Inc.
