|
|
市場調査レポート
商品コード
1446518
米国のヘルスケアペイヤーにおけるテクノロジーソリューション市場規模、シェア、動向分析レポート:用途別、ソリューションタイプ別、支払者タイプ別、セグメント予測、2024年~2030年Technology Solutions In The U.S. Healthcare Payer Market Size, Share & Trends Analysis Report By Application, By Solution Type (Standalone, Integrated), By Payer Type (Government, Commercial), And Segment Forecasts, 2024 - 2030 |
||||||
|
|||||||
カスタマイズ可能
|
|||||||

| 米国のヘルスケアペイヤーにおけるテクノロジーソリューション市場規模、シェア、動向分析レポート:用途別、ソリューションタイプ別、支払者タイプ別、セグメント予測、2024年~2030年 |
|
出版日: 2024年02月16日
発行: Grand View Research
ページ情報: 英文 149 Pages
納期: 2~10営業日
|

全表示
- 概要
- 図表
- 目次
米国ヘルスケアペイヤーにおけるテクノロジーソリューション市場の成長と動向:
Grand View Research, Inc.の最新レポートによると、米国のヘルスケアペイヤーにおけるテクノロジーソリューション市場規模は2030年までに126億米ドルに達すると予測されています。
同市場は2024年から2030年にかけてCAGR 7.3%で顕著に拡大すると予測されます。市場成長を促進する主な要因には、登録と請求の近代化、市場リーダーによる買収の拡大、投資家やベンチャーキャピタルの関心の高まり、革新的技術を用いたヘルスケア革命などがあります。
ヘルスケア業界に焦点を当てたテクノロジー新興企業が大きな注目を集める中、ヘルスケアペイヤーセクターに対する投資家やベンチャーキャピタルの関心は高まっています。このような注目の高まりは、デジタルトランスフォーメーション、バリューベースケア、テレヘルス、データ分析、消費者中心のケアなど、いくつかの要因によってもたらされており、ヘルスケアペイヤー領域におけるイノベーションと拡大の大きな可能性を浮き彫りにしています。ヘルスケア業界は、進化する患者の期待、バリュー・ベース・ケアへのシフト、よりアクセスしやすくパーソナライズされたヘルスケア体験への需要の高まりに後押しされ、急速な変革期を迎えています。このような変化は、ヘルスケアペイヤーエコシステムの様々な側面を改善・強化する可能性を秘めた革新的なテクノロジーやソリューションを導入する新興企業にとって競合環境を生み出しています。
パンデミックの初期段階では、事業の継続性、会員とのコミュニケーション、サポートの確保に重点を置く必要があり、これらの優先事項は今後も重要であり続けました。パンデミックが遠隔地での懸念から世界の危機へと進展し、社会的距離を置くために学校や企業が広範囲に閉鎖されるようになると、ペイパーは対応策を集団で管理するために多様な利害関係者との連携が不可欠であることに気づきました。ヘルスケアペイヤーは、プロバイダーや政府の対応チームとの協力フォーラムの設置、リスクの高い患者の積極的な特定、需要と供給の不均衡への備えなど、いくつかの対応策を採用しました。
さらに、市場の主要企業は、市場での地位を強化し、顧客基盤を拡大するために、提携、協力、新製品の発売、買収、事業拡大などの戦略的イニシアティブに取り組んでいます。例えば、2023年3月、Pegasystems Inc.は、Pega Foundation for Healthcareの機能強化を発表しました。このプラットフォームには、AIを活用したインテリジェントな意思決定、パーソナライズされた迅速な給付、相互運用性の拡大が含まれ、支払者、医療提供者、顧客を支援します。さらに2023年4月、コグニザントとマイクロソフトは、ヘルスケアプロバイダーと支払者に合理化されたクレーム管理、高度なテクノロジーソリューション、相互運用性の向上へのアクセスを提供し、より良い患者と会員体験を提供し、事業運営を最適化するために、長年にわたるヘルスケア協業の拡大を発表しました。マイクロソフトとコグニザントは、コグニザントのTriZettoヘルスケアテクノロジーとMicrosoft Cloud for Healthcareの統合ロードマップを共同で開発する予定です。
米国のヘルスケアペイヤーにおけるテクノロジーソリューション市場:レポートのハイライト
- 用途別では、クレーム管理分野が2023年の市場シェアで32.2%と大半を占める。被保険者人口とヘルスケアサービスの需要が増加し続ける中、保険金請求額も増加しています。
- ソリューションタイプ別では、統合型セグメントが2023年のソリューションタイプセグメントで64.4%と大半のシェアを占めており、予測期間中のCAGRは7.5%と最も速い成長が見込まれています。バリュー・ベース・ケアと集団健康管理が重視されるようになったことが、市場成長に寄与しています。
- 支払者のタイプ別では、商業セグメントが2023年に67.1%の最大市場シェアを占め、予測期間中にCAGR 7.5%で最速の成長が見込まれています。この成長は、人口の間で健康保険の導入が増加していることに起因しています。
目次
第1章 調査手法と範囲
第2章 エグゼクティブサマリー
第3章 米国のヘルスケアペイヤーにおけるテクノロジーソリューション市場:変数、動向、範囲
- 市場系統の見通し
- 補助的な市場分析
- 米国のヘルスケアペイヤーにおけるテクノロジーソリューション市場:IT動向/ダイナミクス
- 市場促進要因分析
- 市場抑制要因分析
- 市場課題の分析
- 市場機会分析
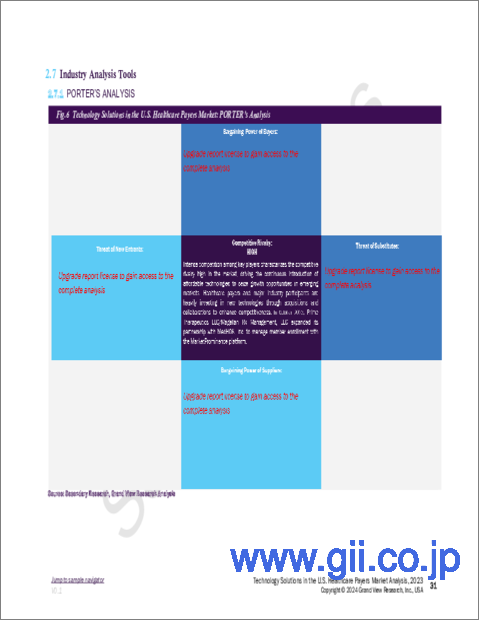
- 業界分析ツール:ポーターの分析
- 業界分析- 害虫
- 米国のヘルスケアペイヤー市場テクノロジーのタイムライン
- ヘルスケアペイヤーによるテクノロジー投資の変化に関する二次調査の洞察
- 新しい動向
- COVID-19感染症のパンデミックの影響
第4章 米国のヘルスケアペイヤー市場
第5章 米国のヘルスケアペイヤーにおけるテクノロジーソリューション市場: 用途の推定・動向分析
- セグメントダッシュボード
- 用途の変動分析、100万米ドル、2023年および2030年
第6章 米国のヘルスケアペイヤーにおけるテクノロジーソリューション市場: ソリューションタイプの推定・動向分析
- セグメントダッシュボード
- 米国のヘルスケアペイヤーにおけるテクノロジーソリューション市場:ソリューションタイプの変動分析、100万米ドル、2023年および2030年
第7章 米国のヘルスケアペイヤーにおけるテクノロジーソリューション市場:国別
- 米国
- 競合シナリオ
- 規制の枠組み
第8章 市場企業の分析
- 主要市場参入企業による最近の動向と影響分析
- Cognizant (Trizetto Business Line)
- Zeomega
- Pegasystems, Inc.
- Hyland Software, Inc.
- Medecision
- Medhok, Inc. (Mhk)
- 企業/競合の分類(主要なイノベーター、市場リーダー、新興企業)
- 推定主要企業市況分析、2023年
- ヘルスケアペイヤー者向けのトップテクノロジーソリューションプロバイダー
- 競合要因と戦略の実施
- 米国のヘルスケアペイヤーにおけるテクノロジーソリューションプロバイダー別
- 米国ヘルスケアペイヤー市場におけるその他の関連ストリーム
- ヘルスケアペイヤー者のデジタル変革への取り組み
- ヘルスケアペイヤー支払者にとっての主な注力分野
- デジタルヘルスケアペイヤーの変革のユースケース
- テクノロジーソリューションに関するヘルスケアペイヤー支払者へのアナリストの推奨事項
- 潜在的な成長領域と浸透領域
第9章 米国のヘルスケアペイヤーにおけるテクノロジーソリューション: 競合分析
- 戦略的取り組み
- Top 5 Consulting Service Lines
- Top 5 Indian Advisory Companies
第10章 米国のヘルスケアペイヤーにおけるテクノロジーソリューション: 市場企業の情勢
- 主要市場企業の情勢
- 企業プロファイル
- Major Market Player Landscape
- HEALTHEDGE
- ORACLE
- ORACLE EBS (E-BUSINESS SUITE)
- COGNIZANT
- Company Profiles
- COGNIZANT (TRIZETTO BUSINESS LINE)
- ZEOMEGA
- Oracle
- HealthEdge Software Inc.
- Pegasystems Inc.
- Hyland Software Inc.
- Zyter (Zyter| TrueCare)
- Medecision
- OSP
- Open Text Corporation
- MedHOK, Inc. (MHK)
- Major Market Player Landscape
List of Tables
- Table 1 List of Abbreviation
- Table 2 Technology solutions in the U.S. healthcare payer market, by application, 2018 - 2030 (USD Million)
- Table 3 Technology solutions in the U.S. healthcare payer market, by solution type, 2018 - 2030 (USD Million)
- Table 4 Technology solutions in the U.S. healthcare payer market, by payer type, 2018 - 2030 (USD Million)
List of Figures
- Fig. 1 Technology solutions in the U.S. healthcare payers market segmentation
- Fig. 2 Market research process
- Fig. 3 Data triangulation techniques
- Fig. 4 Primary research pattern
- Fig. 5 Market research approaches
- Fig. 6 Value-chain-based sizing & forecasting
- Fig. 7 QFD modeling for market share assessment
- Fig. 8 Market formulation & validation
- Fig. 9 Technology Solutions in the healthcare payers market - Commodity flow analysis
- Fig. 10 Market Snapshot
- Fig. 11 Segment Snapshot
- Fig. 12 Segment Snapshot
- Fig. 13 Competitive Landscape Snapshot
- Fig. 14 Technology Solutions in the U.S. Healthcare Payers Market: PORTER's Analysis
- Fig. 15 Technology Solutions in the U.S. Healthcare Payers Market: PEST Analysis
- Fig. 16 Technology Solutions in the U.S. Healthcare Payers Market: Changes in Technology Investments (Percentage of Insurance Respondents)
- Fig. 17 Technology Solutions in the U.S. Healthcare Payers Market: Secondary Survey Insights
- Fig. 18 Technology Solutions in the U.S. Healthcare Payers Market: Secondary Survey Insights
- Fig. 19 Technology Solutions in the U.S. Healthcare Payers Market: Secondary Survey Insights
- Fig. 20 Technology Solutions in the U.S. Healthcare Payers Market: Secondary Survey Insights
- Fig. 21 Technology Solutions in the U.S. Healthcare Payers Market: Post COVID-19 Impact
- Fig. 22 Technology Solutions in the U.S. Healthcare Payers Market: Post COVID-19 Impact
- Fig. 23 Technology Solutions in the U.S. Healthcare Payers Market: COVID-19 Impact
- Fig. 24 Technology solutions in the U.S. healthcare payers market, application outlook key takeaways (USD Million)
- Fig. 25 Application movement analysis (USD Million), 2023 & 2030
- Fig. 26 Enrollment and member management market estimates and forecasts, 2018 - 2030 (USD Million)
- Fig. 27 Provider management market estimates and forecasts, 2018 - 2030 (USD Million)
- Fig. 28 Claims management market estimates and forecasts, 2018 - 2030 (USD Million)
- Fig. 29 Value-based payments market estimates and forecasts, 2018 - 2030 (USD Million)
- Fig. 30 Revenue management and billing market estimates and forecasts, 2018 - 2030 (USD Million)
- Fig. 31 Analytics market estimates and forecasts, 2018 - 2030 (USD Million)
- Fig. 32 Personalize /CRM market estimates and forecasts, 2018 - 2030 (USD Million)
- Fig. 33 Clinical decision support market estimates and forecasts, 2018 - 2030 (USD Million)
- Fig. 34 Data management and authorization market estimates and forecasts, 2018 - 2030 (USD Million)
- Fig. 35 Others market estimates and forecasts, 2018 - 2030 (USD Million)
- Fig. 36 Technology solutions in the U.S. healthcare payers market, solution type outlook key takeaways (USD Million)
- Fig. 37 Technology solutions in the U.S. healthcare payers market: Solution type movement analysis (USD Million), 2023 & 2030
- Fig. 38 Standalone market estimates and forecasts, 2018 - 2030 (USD Million)
- Fig. 39 Integrated market estimates and forecasts, 2018 - 2030 (USD Million)
- Fig. 40 U.S. key country dynamics
- Fig. 41 U.S. key country dynamics
- Fig. 42 Technology solutions in the U.S. healthcare payer market estimates and forecasts, 2018 - 2030 (USD Million)
- Fig. 43 Company/competition categorization
- Fig. 44 Strategic Initiatives by Key Players (%)
- Fig. 45 Company Overview: EY
- Fig. 46 Company Overview: Deloitte
- Fig. 47 Company Overview: KPMG
- Fig. 48 Company Overview: PwC
- Fig. 49 Company Overview: NTT Data
- Fig. 50 Company Overview: Infosys
- Fig. 51 Company Overview: TCS
- Fig. 52 Company Overview: WIPRO
- Fig. 53 Company Overview: Cognizant
- Fig. 54 Company Overview: Optum
- Fig. 55 Company Overview: Exela Technologies
- Fig. 56 Company Overview: EXL
- Fig. 57 Company Overview
- Fig. 58 Company Overview: MPhasis
- Fig. 59 Company Overview: Firstsource
- Fig. 60 Company Overview: HealthEdge
- Fig. 61 Company Overview: HealthEdge (Part 2)
- Fig. 62 Company Overview: Oracle
- Fig. 63 Company Overview: Cognizant
Technology Solutions In The U.S. Healthcare Payer Market Growth & Trends:
The technology solutions in the U.S. healthcare payer market size is anticipated to reach USD 12.6 billion by 2030, according to a new report by Grand View Research, Inc. The market is expected to expand at a notable CAGR of 7.3% from 2024 to 2030. Major factors driving the market growth include enrollment and billing modernization, growing acquisition by market leaders, growing interest of investors and venture capitalists, and revolutionizing healthcare using innovative technologies.
The interest of investors and venture capitalists in the healthcare payer sector is growing as technology startups focusing on this industry draw substantial attention. This increased attention is driven by several factors, such as digital transformation, value-based care, telehealth, data analytics, and consumer-centric care, highlighting the significant potential for innovation and expansion in the healthcare payer domain. The healthcare industry is undergoing rapid transformation, driven by evolving patient expectations, the shift toward value-based care, and the increasing demand for more accessible & personalized healthcare experiences. These changes have created a competitive environment for startups to introduce innovative technologies and solutions, with the potential to improve and enhance various aspects of the healthcare payer ecosystem.
The initial phase of the pandemic required a strong emphasis on ensuring business continuity, member communication, and support, and these priorities remained important for the future. As the pandemic progressed from a remote concern to a global crisis, marked by extensive closure of schools and businesses for social distancing, payers found engaging with diverse stakeholders to manage the response measures collectively imperative. Healthcare payers adopted several response measures, such as establishing collaborative forums with providers and government response teams, proactive identification of high-risk members, and preparation for supply and demand imbalances.
Moreover, key players in the market are engaging in strategic initiatives such as partnerships, collaborations, new product launches, acquisitions, and expansions to strengthen their market position and expand their customer base. For instance, in March 2023, Pegasystems Inc. announced enhancements to the Pega Foundation for Healthcare. The platform will include intelligent AI-powered decision-making, personalized & responsive benefits, and expanded interoperability to help payers, care providers, & customers. Moreover, in April 2023, Cognizant and Microsoft announced an expansion of their long-standing healthcare collaboration to provide healthcare providers and payers with access to streamlined claims management, advanced technology solutions, and improved interoperability to provide better patient and member experiences and optimize business operations. Microsoft and Cognizant are expected to work collaboratively to develop an integration roadmap between Cognizant's TriZetto healthcare technologies and Microsoft Cloud for Healthcare.
Technology Solutions In The U.S. Healthcare Payer Market Report Highlights:
- Based on application, the claims management segment held the majority of the market share of 32.2% in the application segment in 2023. As the population of insured individuals and the demand for healthcare services continue to increase, insurance claims are also rising
- Based on solution type, the integrated segment held most of the market share of 64.4% in the solution-type segment in 2023 and is e xpected to witness the fastest growth at a CAGR of 7.5% during the forecast period. The rising emphasis on value-based care & population health management contributes to market growth
- Based on payer type, the commercial segment held the largest market share of 67.1 % in 2023 and is anticipated to witness the fastest growth at a CAGR of 7.5% over the forecast period. The growth is attributed to the increasing adoption of health insurance among the population
Table of Contents
Chapter 1 Methodology And Scope
- 1.1 Market Segmentation & Scope
- 1.1.1 Estimates & Forecast Timeline
- 1.2 Research Methodology
- 1.3 Information Procurement
- 1.3.1 Purchased Database:
- 1.3.2 GVR's Internal Database
- 1.3.3 Secondary Sources
- 1.3.4 Primary Research:
- 1.3.5 Details Of Primary Research
- 1.4 Information Or Data Analysis
- 1.4.1 Data Analysis Models
- 1.5 Market Formulation & Validation
- 1.6 Model Details
- 1.6.1 Commodity Flow Analysis
- 1.6.2 Segment Level Market Estimation
- 1.7 List Of Secondary Sources
- 1.8 Objectives
- 1.8.1 Objective 1:
- 1.8.2 Objective 2:
Chapter 2 Executive Summary
- 2.1 Market Outlook
- 2.2 Market Snapshot
- 2.3 Segmentation Snapshot
- 2.4 Segmentation Snapshot
- 2.5 Competitive Landscape Snapshot
Chapter 3 Technology Solutions In The U.S. Healthcare Payers Market Variables, Trends & Scope
- 3.1 Market Lineage Outlook
- 3.1.1 Ancillary Market Analysis
- 3.2 Healthcare It Trends/dynamics In U.S. Healthcare Payers Market
- 3.2.1 Market Driver Analysis
- 3.2.1.1 Market Leaders
- 3.2.1.1.1 Modernization Of Enrollment And Billing Processes
- 3.2.1.1.2 Growing Acquisitions By Market Leaders
- 3.2.1.2 Emerging Players/startups
- 3.2.1.2.1 Growing Interest Of Investors And Venture Capitalists
- 3.2.1.2.2 Revolutionization Of Healthcare Using Innovative Technologies
- 3.2.2 Market Restraint Analysis
- 3.2.2.1 Market Leaders
- 3.2.2.1.1 Demand-supply Gap Of Tech Experts
- 3.2.2.2 Emerging Players/startups
- 3.2.2.2.1 Growing Instances Of Data Breaches
- 3.2.3 Market Challenges Analysis
- 3.2.3.1 Market Leaders
- 3.2.3.1.1 Inflation And Rising Cost Of Care
- 3.2.3.2 Emerging Players/startups
- 3.2.3.2.1 Increased Competition
- 3.2.4 Market Opportunity Analysis
- 3.2.4.1 Market Leaders
- 3.2.4.1.1 Growing Demand For Innovative Technologies
- 3.2.4.2 Emerging Players/startups
- 3.2.4.2.1 Enhanced Communication And Engagement
- 3.2.1 Market Driver Analysis
- 3.3 Industry Analysis Tools: Porter's Analysis
- 3.4 Industry Analysis - Pest
- 3.5 U.S. Healthcare Payers Market Technology Timeline
- 3.5.1 Secondary Survey Insights Related To Changes In Technology Investments By Healthcare Payers
- 3.5.1.1 Survey No.1
- 3.5.1.2 Survey No.2
- 3.5.2 Emerging Trends
- 3.5.2.1 Digital Technology Analysis
- 3.5.2.2 Modernization
- 3.5.2.2.1 Cloud-based Solutions Analysis
- 3.5.2.3 Ai-enabled Technology Analysis
- 3.5.1 Secondary Survey Insights Related To Changes In Technology Investments By Healthcare Payers
- 3.6 Impact Of Covid-19 Pandemic
Chapter 4 U.S. Healthcare Payer Market
Chapter 5 Technology Solutions In The U.S. Healthcare Payers Market: Application Estimates & Trend Analysis
- 5.1 Segment Dashboard
- 5.2 Application Movement Analysis, USD Million, 2023 & 2030
- 5.2.1 Enrollment And Member Management
- 5.2.1.1 Enrollment And Member Management Market Estimates And Forecasts, 2018 - 2030 (USD Million)
- 5.2.2 Provider Management
- 5.2.2.1 Provider Management Market Estimates And Forecasts, 2018 - 2030 (USD Million)
- 5.2.3 Claims Management
- 5.2.3.1 Claims Management Market Estimates And Forecasts, 2018 - 2030 (USD Million)
- 5.2.4 Value-based Payments
- 5.2.4.1 Value-based Payments Market Estimates And Forecasts, 2018 - 2030 (USD Million)
- 5.2.5 Revenue Management And Billing
- 5.2.5.1 Revenue Management And Billing Market Estimates And Forecasts, 2018 - 2030 (USD Million)
- 5.2.6 Analytics
- 5.2.6.1 Analytics Market Estimates And Forecasts, 2018 - 2030 (USD Million)
- 5.2.7 Personalize /crm
- 5.2.7.1 Personalize /crm Market Estimates And Forecasts, 2018 - 2030 (USD Million)
- 5.2.8 Clinical Decision Support
- 5.2.8.1 Clinical Decision Support Market Estimates And Forecasts, 2018 - 2030 (USD Million)
- 5.2.9 Data Management And Authorization
- 5.2.9.1 Data Management And Authorization Market Estimates And Forecasts, 2018 - 2030 (USD Million)
- 5.2.10 Others
- 5.2.10.1 Others Market Estimates And Forecasts, 2018 - 2030 (USD Million)
- 5.2.1 Enrollment And Member Management
Chapter 6 Technology Solutions In The U.S. Healthcare Payers Market: Solution Type Estimates & Trend Analysis
- 6.1 Segment Dashboard
- 6.2 Technology Solutions In The U.S. Healthcare Payers Market: Solution Type Movement Analysis, USD Million, 2023 & 2030
- 6.2.1 Standalone
- 6.2.1.1 Standalone Market Estimates And Forecasts, 2018 - 2030 (USD Million)
- 6.2.2 Integrated
- 6.2.2.1 Integrated Market Estimates And Forecasts, 2018 - 2030 (USD Million)
- 6.2.1 Standalone
Chapter 7 Country Estimates, Technology Solutions In The U.S. Healthcare Payers Market, By Application And Solution Type
- 7.1 U.S.
- 7.1.1 Competitive Scenario
- 7.1.2 Regulatory Framework
- 7.1.2.1 Technology Solutions In The U.S. Healthcare Payer Market Estimates And Forecasts, 2018 - 2030 (USD Million)
Chapter 8 Market Player Analysis
- 8.1 Recent Developments & Impact Analysis By Key Market Participants
- 8.1.1 Cognizant (Trizetto Business Line)
- 8.1.2 Zeomega
- 8.1.3 Pegasystems, Inc.
- 8.1.4 Hyland Software, Inc.
- 8.1.5 Medecision
- 8.1.6 Medhok, Inc. (Mhk)
- 8.2 Company/competition Categorization (Key Innovators, Market Leaders, Emerging Players)
- 8.3 Estimated Dominant Company Market Position Analysis, 2023
- 8.4 Top Technology Solution Providers For Healthcare Payers
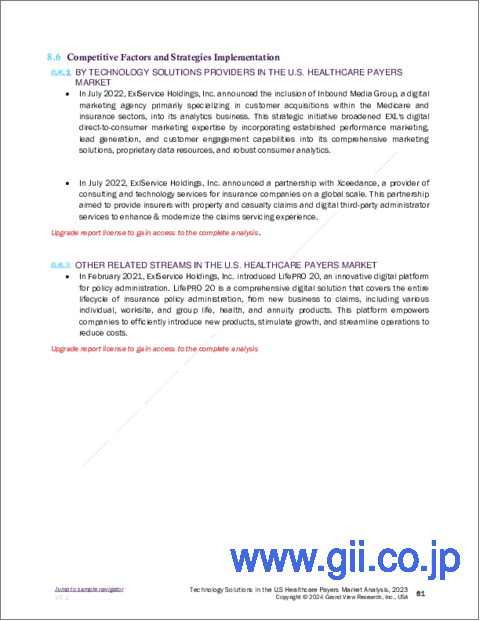
- 8.5 Competitive Factors And Strategies Implementation
- 8.5.1 By Technology Solutions Providers In The U.S. Healthcare Payers Market
- 8.5.2 Other Related Streams In The U.S. Healthcare Payers Market
- 8.6 Healthcare Payer's Digital Transformation Initiatives
- 8.6.1 Key Focus Areas For Healthcare Payers
- 8.6.1.1 Advanced Analytics
- 8.6.1.2 Member Engagement
- 8.6.1.3 Cybersecurity:
- 8.6.1.4 Telehealth:
- 8.6.1.5 Value-based Care:
- 8.6.1.6 Population Health Management:
- 8.6.2 Digital Healthcare Payer's Transformation Use Cases
- 8.6.2.1 Accelerating Claims Processing
- 8.6.2.1.1 Gleematic A.i: Cognitive Automation For Claims Processing
- 8.6.2.2 Enhancing Customer Care
- 8.6.2.2.1 Virtusa Corp.: 98% Boost In Customer Satisfaction Realized By Top Payer
- 8.6.2.3 Accelerating New Member Enrollment
- 8.6.2.3.1 Innova Solutions: Enrollment Management Solution For Leading U.S. Health Insurance Company
- 8.6.2.4 Enabling Remote Workforce
- 8.6.2.4.1 Productive Edge: Revolutionizing Primary Care: A Regional Payer's Innovative Virtual Solution For Patient Needs
- 8.6.2.5 Enhancing Interoperability
- 8.6.2.5.1 Hyland Software, Inc.: A Complex Regional Health System And Plan Provider Achieves Interoperability And Significant Roi
- 8.6.2.6 Other Applications
- 8.6.2.6.1 Hyland Software, Inc.: New York Health Plan Enhances Efficiency And Security By Automating Appeals And Grievances Processes
- 8.6.1 Key Focus Areas For Healthcare Payers
- 8.7 Analyst Recommendations For Healthcare Payers Regarding Technology Solutions
- 8.7.1 Potential Growth And Penetration Areas
Chapter 9 Technology Solutions In The U.S. Healthcare Payers Market: Competitive Analysis
- 9.1 Strategic Initiatives
- 9.2 Top 5 Consulting Service Lines
- 9.2.1 Ey
- 9.2.1.1 Strategic Alliances
- 9.2.2 Deloitte
- 9.2.2.1 Strategic Alliances
- 9.2.3 KPMG
- 9.2.3.1 Strategic Alliances
- 9.2.4 Pwc (Pricewaterhousecoopers)
- 9.2.4.1 Strategic Alliances
- 9.2.5 Ntt Data
- 9.2.5.1 Strategic Alliances
- 9.2.1 Ey
- 9.3 Top 5 Indian Advisory Companies
- 9.3.1 Infosys
- 9.3.1.1 Strategic Alliances
- 9.3.2 Tcs
- 9.3.2.1 Strategic Alliances
- 9.3.3 Wipro
- 9.3.3.1 Strategic Alliances
- 9.3.4 Cognizant
- 9.3.4.1 Strategic Alliances
- 9.3.5 Optum
- 9.3.5.1 Strategic Alliances
- 9.3.1 Infosys
Chapter 10 Technology Solutions in the U.S. Healthcare Payers Market: Market Player Landscape
- 10.1 Major Market Player Landscape
- 10.1.1 HEALTHEDGE
- 10.1.1.1 Company Overview
- 10.1.1.2 Partners:
- 10.1.1.3 Go-To-Market Strategies
- 10.1.2 ORACLE
- 10.1.2.1 Company OverVIew
- 10.1.2.2 Oracle Enterprise Service Bus (ESB)
- 10.1.2.3 Partners: Accenture, PwC, Cognizant, Deloitte, KPMG, TCS, Infosys, Wipro, EY
- 10.1.2.4 Go-To-Market Strategies
- 10.1.3 ORACLE EBS (E-BUSINESS SUITE)
- 10.1.4 COGNIZANT
- 10.1.4.1 Company OverVIew
- 10.1.4.2 Facts of Cognizant digital healthcare payer Solutions
- 10.1.4.3 Partnership
- 10.1.4.4 Go-To-Market Strategies
- 10.1.1 HEALTHEDGE
- 10.2 Company Profiles
- 10.2.1. COGNIZANT (TRIZETTO BUSINESS LINE)
- 10.2.1.1. Participant's Overview
- 10.2.1.2. Financial Performance
- 10.2.1.3. Product Benchmarking
- 10.2.1.4. Recent Developments
- 10.2.2. ZEOMEGA
- 10.2.2.1. Participant's Overview
- 10.2.2.2. Financial Performance
- 10.2.2.3. Product Benchmarking
- 10.2.2.4. Recent Developments
- 10.2.3. Oracle
- 10.2.3.1. Participant's Overview
- 10.2.3.2. Financial Performance
- 10.2.3.3. Product Benchmarking
- 10.2.3.4. Recent Developments
- 10.2.4. HealthEdge Software Inc.
- 10.2.4.1. Participant's Overview
- 10.2.4.2. Financial Performance
- 10.2.4.3. Product Benchmarking
- 10.2.4.4. Recent Developments
- 10.2.5. Pegasystems Inc.
- 10.2.5.1. Participant's Overview
- 10.2.5.2. Financial Performance
- 10.2.5.3. Product Benchmarking
- 10.2.5.4. Recent Developments
- 10.2.6. Hyland Software Inc.
- 10.2.6.1. Participant's Overview
- 10.2.6.2. Financial Performance
- 10.2.6.3. Product Benchmarking
- 10.2.6.4. Recent Developments
- 10.2.7. Zyter (Zyter| TrueCare)
- 10.2.7.1. Participant's Overview
- 10.2.7.2. Financial Performance
- 10.2.7.3. Product Benchmarking
- 10.2.7.4. Recent Developments
- 10.2.8. Medecision
- 10.2.8.1. Participant's Overview
- 10.2.8.2. Financial Performance
- 10.2.8.3. Product Benchmarking
- 10.2.8.4. Recent Developments
- 10.2.9. OSP
- 10.2.9.1. Participant's Overview
- 10.2.9.2. Financial Performance
- 10.2.9.3. Product Benchmarking
- 10.2.9.4. Recent Developments
- 10.2.10. Open Text Corporation
- 10.2.10.1. Participant's Overview
- 10.2.10.2. Financial Performance
- 10.2.10.3. Product Benchmarking
- 10.2.10.4. Recent Developments
- 10.2.11. MedHOK, Inc. (MHK)
- 10.2.11.1. Participant's Overview
- 10.2.11.2. Financial Performance
- 10.2.11.3. Product Benchmarking
- 10.2.11.4. Recent Developments
- 10.2.1. COGNIZANT (TRIZETTO BUSINESS LINE)

