|
|
市場調査レポート
商品コード
1446514
男性型脱毛症(AGA)の市場規模、シェア、動向分析レポート:性別、治療別、最終用途別、販売チャネル別、セグメント別予測、2024年~2030年Androgenetic Alopecia Market Size, Share & Trends Analysis Report By Gender (Male, Female), By Treatment (Pharmaceuticals, Devices), By End-use (Dermatology Clinics, Homecare Settings), By Sales Channel, And Segment Forecasts, 2024 - 2030 |
||||||
|
|||||||
カスタマイズ可能
|
|||||||


| 男性型脱毛症(AGA)の市場規模、シェア、動向分析レポート:性別、治療別、最終用途別、販売チャネル別、セグメント別予測、2024年~2030年 |
|
出版日: 2024年02月13日
発行: Grand View Research
ページ情報: 英文 150 Pages
納期: 2~10営業日
|

全表示
- 概要
- 図表
- 目次
男性型脱毛症(AGA)市場の成長と動向:
Grand View Research社の最新レポートによると、世界の男性型脱毛症(AGA)市場規模は2030年までに47億6,000万米ドルに達すると予測され、2024年から2030年までのCAGRは8.45%で拡大すると予測されています。
男性型脱毛症(AGA)の有病率の増加は、市場成長を促進する重要な要因の1つです。米国脱毛協会が発表したデータによると、男性の脱毛の95%以上は男性型脱毛症(AGA)が原因です。男性の脱毛の発生は、加齢に比例して増加します。国際毛髪再生外科学会(International Society of Hair Restoration Surgery)が発表した報告書によると、男性の場合、35歳までに40%、60歳で65%、80歳で70%、85歳で80%の脱毛が起こると推定されています。
さらに、市場の成長は、発毛を促進する低レベルレーザー治療の導入を含む技術の進歩に起因しています。同様に、複数のレーザーコームやヘアマッサージャーまたはブラシの導入も市場を押し上げています。例えば、Lifemax Infrared Hairbrush、Follinex Massager Comb、Hairmax Laser Combは、市場で入手可能な技術的に進んだ製品の一部です。ほとんどの臨床現場では、より良い結果を得るために、非切除レーザー治療と医薬品の局所塗布の併用療法が行われています。レーザー機器によって生じる微細な傷は、発毛を誘発する良好な創傷治癒環境を作り出します。
さらに、がんなどの慢性疾患の罹患率の増加は、市場成長に有利な機会を提供すると予想されています。例えば、Globocan社の最新レポートによると、がんの罹患率は2020年に世界で19,288,916人になると推定されています。がんの治療で患者に処方される特定の薬剤も脱毛の原因となります。例えば、化学療法剤、放射線療法、ホルモン療法、免疫療法は脱毛や薄毛を誘発しやすいです。がんの罹患率は今後20年間で約70%上昇すると予想されており、市場成長の原動力となっています。
しかし、男性型脱毛症(AGA)治療に対する償還適用は、この市場における大きな課題の一つです。AGAの治療法のほとんどは美容的処置であり、医学的に必要不可欠なものではないため、一般的に保険適用外となっています。AGA治療の自己負担額には通常、頻繁な医師の診察、処方薬の自己負担額、処置のための共同保険料が含まれます。脱毛症は生命を脅かす病気ではないため、償還の位置づけが複雑です。例えば、Aetna Inc.の脱毛症に関するポリシーでは、軽度の症状に対してカバーされる薬剤と重度の症状に対して考慮される薬剤は異なるとされています。さらに、ロゲイン(ミノキシジル)は実験的治療とみなされているため、この制度ではカバーされていません。このように、治療に対する償還政策の欠如が市場の成長を抑制しています。
男性型脱毛症(AGA)市場レポートハイライト
- 男性型脱毛症(AGA)治療の採用率が高いため、2023年には男性セグメントが市場を独占しました。
- 医薬品セグメントが2023年に最大のシェアを占めました。製品承認数の増加、製薬企業による投資の増加、男性型脱毛症(AGA)治療に医薬品を採用する社会的態度の変化が、セグメント成長に顕著な役割を果たすと考えられます。
- デバイス治療セグメントは、予測期間中最も速いCAGRで成長すると予想されます。
- 皮膚科クリニックの最終用途セグメントは、強力な製品パイプラインと相まって、処方薬やレーザー技術などの最新の治療法に関する消費者の意識の高まりにより、2023年に最大の収益シェアを占めました。
- 北米は、高い疾患有病率、消費者の意識、政府の積極的な施策、技術の進歩、医療インフラの改善により、2023年に圧倒的な売上シェアを占めました。
- 2023年11月、サンファーマ・アドバンスト・リサーチ・カンパニー(SPARC)は、ジョンズ・ホプキンスおよびチェコの研究機関IOCBと、IOCBが所有するすべての特許を含むSCD-153の独占的ライセンス契約を締結しました。
目次
第1章 調査手法と範囲
第2章 エグゼクティブサマリー
第3章 男性型脱毛症(AGA)市場:変数、動向、範囲
- 市場系統の見通し
- 親市場の見通し
- 関連/付随市場の見通し
- 市場力学
- 市場促進要因分析
- 市場抑制要因分析
- 市場機会分析
- 男性型脱毛症(AGA)市場分析ツール
- 業界分析- ポーターのファイブフォース分析
- PESTEL分析
- 男性型脱毛症(AGA)市場:地域別の有病率データ
- 北米
- 欧州
- アジア太平洋地域
- ラテンアメリカ
- 中東・アフリカ(MEA)
第4章 男性型脱毛症(AGA)市場:性別の推定・動向分析
- 性別の市場シェア、2023年と2030年
- セグメントダッシュボード
- 性別の世界の男性型脱毛症(AGA)市場の見通し
- 市場規模、予測および動向分析、2018年から2030年まで
第5章 男性型脱毛症(AGA)市場:治療の推定・動向分析
- 治療の市場シェア、2023年と2030年
- セグメントダッシュボード
- 治療別の世界の男性型脱毛症(AGA)市場の見通し
- 市場規模、予測および動向分析、2018年から2030年まで
第6章 男性型脱毛症(AGA)市場:最終用途の推定・動向分析
- 最終用途の市場シェア、2023年および2030年
- セグメントダッシュボード
- 最終用途別の世界の男性型脱毛症(AGA)市場の見通し
- 市場規模、予測および動向分析、2018年から2030年まで
第7章 男性型脱毛症(AGA)市場:販売チャネルの推定・動向分析
- 販売チャネルの市場シェア、2023年と2030年
- セグメントダッシュボード
- 販売チャネル別の世界の男性型脱毛症(AGA)市場の見通し
- 市場規模、予測および動向分析、2018年から2030年まで
第8章 男性型脱毛症(AGA)市場:地域の推定・動向分析
- 地域の市場シェア分析、2023年および2030年
- 地域の市場ダッシュボード
- 世界の地域の市場スナップショット
- 市場規模と予測動向分析、2018年から2030年まで
- 北米
- 米国
- カナダ
- 欧州
- 英国
- ドイツ
- フランス
- イタリア
- スペイン
- ノルウェー
- スウェーデン
- デンマーク
- アジア太平洋地域
- 日本
- 中国
- インド
- オーストラリア
- 韓国
- タイ
- ラテンアメリカ
- ブラジル
- メキシコ
- アルゼンチン
- 中東・アフリカ
- 南アフリカ
- サウジアラビア
- アラブ首長国連邦
- クウェート
第9章 競合情勢
- 主要市場参入企業別の最近の動向と影響分析
- 会社/競合の分類
- ベンダー情勢
- Johnson &Johnson Services, Inc.
- Cipla, Inc.
- Sun Pharmaceutical Industries Ltd.
- Merck &Co., Inc.
- Dr. Reddy's Laboratories Ltd.
- Aurobindo Pharma
- Lexington Intl., LLC
- Freedom Laser Therapy, Inc.(iRESTORE Hair Growth System)
- Curallux, LLC
- Apira Science, Inc.(iGROW Laser)
- Theradome, Inc.
List of Tables
- Table 1 List of abbreviation
- Table 2 North America androgenetic alopecia market, by country, 2018 - 2030 (USD Million) (Number of Patients Treated in Thousands)
- Table 3 North America androgenetic alopecia market, by gender, 2018 - 2030 (USD Million)
- Table 4 North America androgenetic alopecia market, by treatment, 2018 - 2030 (USD Million)
- Table 5 North America androgenetic alopecia market, by end use, 2018 - 2030 (USD Million)
- Table 6 North America androgenetic alopecia market, by sales channel, 2018 - 2030 (USD Million)
- Table 7 US androgenetic alopecia market, by gender, 2018 - 2030 (USD Million)
- Table 8 US androgenetic alopecia market, by treatment, 2018 - 2030 (USD Million)
- Table 9 US androgenetic alopecia market, by end use, 2018 - 2030 (USD Million)
- Table 10 US androgenetic alopecia market, by sales channel, 2018 - 2030 (USD Million)
- Table 11 Canada androgenetic alopecia market, by gender, 2018 - 2030 (USD Million)
- Table 12 Canada androgenetic alopecia market, by treatment, 2018 - 2030 (USD Million)
- Table 13 Canada androgenetic alopecia market, by end use, 2018 - 2030 (USD Million)
- Table 14 Canada androgenetic alopecia market, by sales channel, 2018 - 2030 (USD Million)
- Table 15 Europe androgenetic alopecia market, by country, 2018 - 2030 (USD Million) (Number of Patients Treated in Thousands)
- Table 16 Europe androgenetic alopecia market, by gender, 2018 - 2030 (USD Million)
- Table 17 Europe androgenetic alopecia market, by treatment, 2018 - 2030 (USD Million)
- Table 18 Europe androgenetic alopecia market, by end use, 2018 - 2030 (USD Million)
- Table 19 Europe androgenetic alopecia market, by sales channel, 2018 - 2030 (USD Million)
- Table 20 Germany androgenetic alopecia market, by gender, 2018 - 2030 (USD Million)
- Table 21 Germany androgenetic alopecia market, by treatment, 2018 - 2030 (USD Million)
- Table 22 Germany androgenetic alopecia market, by end use, 2018 - 2030 (USD Million)
- Table 23 Germany androgenetic alopecia market, by sales channel, 2018 - 2030 (USD Million)
- Table 24 UK androgenetic alopecia market, by gender, 2018 - 2030 (USD Million)
- Table 25 UK androgenetic alopecia market, by treatment, 2018 - 2030 (USD Million)
- Table 26 UK androgenetic alopecia market, by end use, 2018 - 2030 (USD Million)
- Table 27 UK androgenetic alopecia market, by sales channel, 2018 - 2030 (USD Million)
- Table 28 France androgenetic alopecia market, by gender, 2018 - 2030 (USD Million)
- Table 29 France androgenetic alopecia market, by treatment, 2018 - 2030 (USD Million)
- Table 30 France androgenetic alopecia market, by end use, 2018 - 2030 (USD Million)
- Table 31 France androgenetic alopecia market, by sales channel, 2018 - 2030 (USD Million)
- Table 32 Italy androgenetic alopecia market, by gender, 2018 - 2030 (USD Million)
- Table 33 Italy androgenetic alopecia market, by treatment, 2018 - 2030 (USD Million)
- Table 34 Italy androgenetic alopecia market, by end use, 2018 - 2030 (USD Million)
- Table 35 Italy androgenetic alopecia market, by sales channel, 2018 - 2030 (USD Million)
- Table 36 Spain androgenetic alopecia market, by gender, 2018 - 2030 (USD Million)
- Table 37 Spain androgenetic alopecia market, by treatment, 2018 - 2030 (USD Million)
- Table 38 Spain androgenetic alopecia market, by end use, 2018 - 2030 (USD Million)
- Table 39 Spain androgenetic alopecia market, by sales channel, 2018 - 2030 (USD Million)
- Table 40 Denmark androgenetic alopecia market, by gender, 2018 - 2030 (USD Million)
- Table 41 Denmark androgenetic alopecia market, by treatment, 2018 - 2030 (USD Million)
- Table 42 Denmark androgenetic alopecia market, by end use, 2018 - 2030 (USD Million)
- Table 43 Denmark androgenetic alopecia market, by sales channel, 2018 - 2030 (USD Million)
- Table 44 Sweden androgenetic alopecia market, by gender, 2018 - 2030 (USD Million)
- Table 45 Sweden androgenetic alopecia market, by treatment, 2018 - 2030 (USD Million)
- Table 46 Sweden androgenetic alopecia market, by end use, 2018 - 2030 (USD Million)
- Table 47 Sweden androgenetic alopecia market, by sales channel, 2018 - 2030 (USD Million)
- Table 48 Norway androgenetic alopecia market, by gender, 2018 - 2030 (USD Million)
- Table 49 Norway androgenetic alopecia market, by treatment, 2018 - 2030 (USD Million)
- Table 50 Norway androgenetic alopecia market, by end use, 2018 - 2030 (USD Million)
- Table 51 Norway androgenetic alopecia market, by sales channel, 2018 - 2030 (USD Million)
- Table 52 Asia Pacific androgenetic alopecia market, by country, 2018 - 2030 (USD Million) (Number of Patients Treated in Thousands)
- Table 53 Asia Pacific androgenetic alopecia market, by gender, 2018 - 2030 (USD Million)
- Table 54 Asia Pacific androgenetic alopecia market, by treatment, 2018 - 2030 (USD Million)
- Table 55 Asia Pacific androgenetic alopecia market, by end use, 2018 - 2030 (USD Million)
- Table 56 Asia Pacific androgenetic alopecia market, by sales channel, 2018 - 2030 (USD Million)
- Table 57 China androgenetic alopecia market, by gender, 2018 - 2030 (USD Million)
- Table 58 China androgenetic alopecia market, by treatment, 2018 - 2030 (USD Million)
- Table 59 China androgenetic alopecia market, by end use, 2018 - 2030 (USD Million)
- Table 60 China androgenetic alopecia market, by sales channel, 2018 - 2030 (USD Million)
- Table 61 Japan androgenetic alopecia market, by gender, 2018 - 2030 (USD Million)
- Table 62 Japan androgenetic alopecia market, by treatment, 2018 - 2030 (USD Million)
- Table 63 Japan androgenetic alopecia market, by end use, 2018 - 2030 (USD Million)
- Table 64 Japan androgenetic alopecia market, by sales channel, 2018 - 2030 (USD Million)
- Table 65 India androgenetic alopecia market, by gender, 2018 - 2030 (USD Million)
- Table 66 India androgenetic alopecia market, by treatment, 2018 - 2030 (USD Million)
- Table 67 India androgenetic alopecia market, by end use, 2018 - 2030 (USD Million)
- Table 68 India androgenetic alopecia market, by sales channel, 2018 - 2030 (USD Million)
- Table 69 South Korea androgenetic alopecia market, by gender, 2018 - 2030 (USD Million)
- Table 70 South Korea androgenetic alopecia market, by treatment, 2018 - 2030 (USD Million)
- Table 71 South Korea androgenetic alopecia market, by end use, 2018 - 2030 (USD Million)
- Table 72 South Korea androgenetic alopecia market, by sales channel, 2018 - 2030 (USD Million)
- Table 73 Australia androgenetic alopecia market, by gender, 2018 - 2030 (USD Million)
- Table 74 Australia androgenetic alopecia market, by treatment, 2018 - 2030 (USD Million)
- Table 75 Australia androgenetic alopecia market, by end use, 2018 - 2030 (USD Million)
- Table 76 Australia androgenetic alopecia market, by sales channel, 2018 - 2030 (USD Million)
- Table 77 Thailand androgenetic alopecia market, by gender, 2018 - 2030 (USD Million)
- Table 78 Thailand androgenetic alopecia market, by treatment, 2018 - 2030 (USD Million)
- Table 79 Thailand androgenetic alopecia market, by end use, 2018 - 2030 (USD Million)
- Table 80 Thailand androgenetic alopecia market, by sales channel, 2018 - 2030 (USD Million)
- Table 81 Latin America androgenetic alopecia market, by country, 2018 - 2030 (USD Million) (Number of Patients Treated in Thousands)
- Table 82 Latin America androgenetic alopecia market, by gender, 2018 - 2030 (USD Million)
- Table 83 Latin America androgenetic alopecia market, by treatment, 2018 - 2030 (USD Million)
- Table 84 Latin America androgenetic alopecia market, by end use, 2018 - 2030 (USD Million)
- Table 85 Latin America androgenetic alopecia market, by sales channel, 2018 - 2030 (USD Million)
- Table 86 Brazil androgenetic alopecia market, by gender, 2018 - 2030 (USD Million)
- Table 87 Brazil androgenetic alopecia market, by treatment, 2018 - 2030 (USD Million)
- Table 88 Brazil androgenetic alopecia market, by end use, 2018 - 2030 (USD Million)
- Table 89 Brazil androgenetic alopecia market, by sales channel, 2018 - 2030 (USD Million)
- Table 90 Mexico androgenetic alopecia market, by gender, 2018 - 2030 (USD Million)
- Table 91 Mexico androgenetic alopecia market, by treatment, 2018 - 2030 (USD Million)
- Table 92 Mexico androgenetic alopecia market, by end use, 2018 - 2030 (USD Million)
- Table 93 Mexico androgenetic alopecia market, by sales channel, 2018 - 2030 (USD Million)
- Table 94 Argentina androgenetic alopecia market, by gender, 2018 - 2030 (USD Million)
- Table 95 Argentina androgenetic alopecia market, by treatment, 2018 - 2030 (USD Million)
- Table 96 Argentina androgenetic alopecia market, by end use, 2018 - 2030 (USD Million)
- Table 97 Argentina androgenetic alopecia market, by sales channel, 2018 - 2030 (USD Million)
- Table 98 MEA androgenetic alopecia market, by country, 2018 - 2030 (USD Million) (Number of Patients Treated in Thousands)
- Table 99 MEA androgenetic alopecia market, by gender, 2018 - 2030 (USD Million)
- Table 100 MEA androgenetic alopecia market, by treatment, 2018 - 2030 (USD Million)
- Table 101 MEA androgenetic alopecia market, by end use, 2018 - 2030 (USD Million)
- Table 102 MEA androgenetic alopecia market, by sales channel, 2018 - 2030 (USD Million)
- Table 103 South Africa androgenetic alopecia market, by gender, 2018 - 2030 (USD Million)
- Table 104 South Africa androgenetic alopecia market, by treatment, 2018 - 2030 (USD Million)
- Table 105 South Africa androgenetic alopecia market, by end use, 2018 - 2030 (USD Million)
- Table 106 South Africa androgenetic alopecia market, by sales channel, 2018 - 2030 (USD Million)
- Table 107 Saudi Arabia androgenetic alopecia market, by gender, 2018 - 2030 (USD Million)
- Table 108 Saudi Arabia androgenetic alopecia market, by treatment, 2018 - 2030 (USD Million)
- Table 109 Saudi Arabia androgenetic alopecia market, by end use, 2018 - 2030 (USD Million)
- Table 110 Saudi Arabia androgenetic alopecia market, by sales channel, 2018 - 2030 (USD Million)
- Table 111 UAE androgenetic alopecia market, by gender, 2018 - 2030 (USD Million)
- Table 112 UAE androgenetic alopecia market, by treatment, 2018 - 2030 (USD Million)
- Table 113 UAE androgenetic alopecia market, by end use, 2018 - 2030 (USD Million)
- Table 114 UAE androgenetic alopecia market, by sales channel, 2018 - 2030 (USD Million)
- Table 115 Kuwait androgenetic alopecia market, by gender, 2018 - 2030 (USD Million)
- Table 116 Kuwait androgenetic alopecia market, by treatment, 2018 - 2030 (USD Million)
- Table 117 Kuwait androgenetic alopecia market, by end use, 2018 - 2030 (USD Million)
- Table 118 Kuwait androgenetic alopecia market, by sales channel, 2018 - 2030 (USD Million)
List of Figures
- Fig. 1 Androgenetic alopecia market segmentation
- Fig. 2 Market research process
- Fig. 3 Data triangulation techniques
- Fig. 4 Primary research pattern
- Fig. 5 Value chain based sizing & forecasting
- Fig. 6 QFD modelling for market share assessment
- Fig. 7 Market formulation & validation
- Fig. 8 Market snapshot
- Fig. 9 Treatment and end-use segment snapshot
- Fig. 10 Sales channel and gender segment snapshot
- Fig. 11 Competitive landscape snapshot
- Fig. 12 Market dynamics
- Fig. 13 Prevalence of rheumatoid arthritis in 2022, by WHO regions
- Fig. 14 Porter's five forces analysis
- Fig. 15 PESTLE analysis
- Fig. 16 Androgenetic alopecia market: Gender outlook and key takeaways
- Fig. 17 Androgenetic alopecia market: Gender movement analysis
- Fig. 18 Male market estimates and forecast, 2018 - 2030 (USD Million)
- Fig. 19 Female market estimates and forecast, 2018 - 2030 (USD Million)
- Fig. 20 Androgenetic alopecia market: Treatment outlook and key takeaways
- Fig. 21 Androgenetic alopecia market: Treatment movement analysis
- Fig. 22 Pharmaceuticals market estimates and forecast, 2018 - 2030 (USD Million)
- Fig. 23 Devices market estimates and forecast, 2018 - 2030 (USD Million)
- Fig. 24 Androgenetic alopecia market: End-use outlook and key takeaways
- Fig. 25 Androgenetic alopecia market: End-use movement analysis
- Fig. 26 Dermatology clinics market estimates and forecast, 2018 - 2030 (USD Million)
- Fig. 27 Homecare settings market estimates and forecast, 2018 - 2030 (USD Million)
- Fig. 28 Androgenetic alopecia market: Sales channels outlook and key takeaways
- Fig. 29 Androgenetic alopecia market: Sales channels movement analysis
- Fig. 30 Prescription market estimates and forecast, 2018 - 2030 (USD Million)
- Fig. 31 OTC market estimates and forecast, 2018 - 2030 (USD Million)
- Fig. 32 Androgenetic alopecia market revenue, by region, 2023 & 2030 (USD Million)
- Fig. 33 Regional marketplace: Key takeaways (1/2)
- Fig. 34 Regional marketplace: Key takeaways (2/2)
- Fig. 35 North America androgenetic alopecia market estimates and forecasts, 2018 - 2030 (USD Million) (Number of Patients Treated in Thousands)
- Fig. 36 Key country dynamics
- Fig. 37 U.S. androgenetic alopecia market estimates and forecasts, 2018 - 2030 (USD Million) (Number of Patients Treated in Thousands)
- Fig. 38 Key country dynamics
- Fig. 39 Canada androgenetic alopecia market estimates and forecasts, 2018 - 2030 (USD Million) (Number of Patients Treated in Thousands)
- Fig. 40 Europe androgenetic alopecia market estimates and forecasts, 2018 - 2030 (USD Million) (Number of Patients Treated in Thousands)
- Fig. 41 Key country dynamics
- Fig. 42 UK androgenetic alopecia market estimates and forecasts, 2018 - 2030 (USD Million) (Number of Patients Treated in Thousands)
- Fig. 43 Key country dynamics
- Fig. 44 Germany androgenetic alopecia market estimates and forecasts, 2018 - 2030 (USD Million) (Number of Patients Treated in Thousands)
- Fig. 45 Key country dynamics
- Fig. 46 France androgenetic alopecia market estimates and forecasts, 2018 - 2030 (USD Million) (Number of Patients Treated in Thousands)
- Fig. 47 Key country dynamics
- Fig. 48 Spain androgenetic alopecia market estimates and forecasts, 2018 - 2030 (USD Million) (Number of Patients Treated in Thousands)
- Fig. 49 Key country dynamics
- Fig. 50 Italy androgenetic alopecia market estimates and forecasts, 2018 - 2030 (USD Million) (Number of Patients Treated in Thousands)
- Fig. 51 Key country dynamics
- Fig. 52 Denmark androgenetic alopecia market estimates and forecasts, 2018 - 2030 (USD Million) (Number of Patients Treated in Thousands)
- Fig. 53 Key country dynamics
- Fig. 54 Sweden androgenetic alopecia market estimates and forecasts, 2018 - 2030 (USD Million) (Number of Patients Treated in Thousands)
- Fig. 55 Key country dynamics
- Fig. 56 Norway androgenetic alopecia market estimates and forecasts, 2018 - 2030 (USD Million) (Number of Patients Treated in Thousands)
- Fig. 57 Rest of Europe androgenetic alopecia market estimates and forecasts, 2018 - 2030 (USD million) (Number of Patients Treated in Thousands)
- Fig. 58 Asia Pacific androgenetic alopecia market estimates and forecasts, 2018 - 2030 (USD Million) (Number of Patients Treated in Thousands)
- Fig. 59 Key country dynamics
- Fig. 60 Reimbursement scenario
- Fig. 61 Japan androgenetic alopecia market estimates and forecasts, 2018 - 2030 (USD Million) (Number of Patients Treated in Thousands)
- Fig. 62 Key country dynamics
- Fig. 63 Regulatory framework
- Fig. 64 Reimbursement scenario
- Fig. 65 China androgenetic alopecia market estimates and forecasts, 2018 - 2030 (USD Million) (Number of Patients Treated in Thousands)
- Fig. 66 Key country dynamics
- Fig. 67 Reimbursement scenario
- Fig. 68 India androgenetic alopecia market estimates and forecasts, 2018 - 2030 (USD Million) (Number of Patients Treated in Thousands)
- Fig. 69 Key country dynamics
- Fig. 70 Australia androgenetic alopecia market estimates and forecasts, 2018 - 2030 (USD Million) (Number of Patients Treated in Thousands)
- Fig. 71 Key country dynamics
- Fig. 72 South Korea androgenetic alopecia market estimates and forecasts, 2018 - 2030 (USD Million) (Number of Patients Treated in Thousands)
- Fig. 73 Key country dynamics
- Fig. 74 Thailand androgenetic alopecia market estimates and forecasts, 2018 - 2030 (USD Million) (Number of Patients Treated in Thousands)
- Fig. 75 Key country dynamics
- Fig. 76 Malaysia androgenetic alopecia market estimates and forecasts, 2018 - 2030 (USD Million) (Number of Patients Treated in Thousands)
- Fig. 77 Key country dynamics
- Fig. 78 Vietnam androgenetic alopecia market estimates and forecasts, 2018 - 2030 (USD Million) (Number of Patients Treated in Thousands)
- Fig. 79 Key country dynamics
- Fig. 80 Philippines androgenetic alopecia market estimates and forecasts, 2018 - 2030 (USD Million) (Number of Patients Treated in Thousands)
- Fig. 81 Rest of Asia Pacific androgenetic alopecia market estimates and forecasts, 2018 - 2030 (USD million) (Number of Patients Treated in Thousands)
- Fig. 82 Latin America androgenetic alopecia market estimates and forecasts, 2018 - 2030 (USD Million) (Number of Patients Treated in Thousands)
- Fig. 83 Key country dynamics
- Fig. 84 Brazil regulation details
- Fig. 85 Reimbursement scenario
- Fig. 86 Brazil androgenetic alopecia market estimates and forecasts, 2018 - 2030 (USD Million) (Number of Patients Treated in Thousands)
- Fig. 87 Key country dynamics
- Fig. 88 Argentina pharmaceuticals registration details
- Fig. 89 Argentina androgenetic alopecia market estimates and forecasts, 2018 - 2030 (USD million) (Number of Patients Treated in Thousands)
- Fig. 90 Key country dynamics
- Fig. 91 Regulatory framework
- Fig. 92 Reimbursement scenario
- Fig. 93 Mexico androgenetic alopecia market estimates and forecasts, 2018 - 2030 (USD Million) (Number of Patients Treated in Thousands)
- Fig. 94 Rest of Latin America androgenetic alopecia market estimates and forecasts, 2018 - 2030 (USD million) (Number of Patients Treated in Thousands)
- Fig. 95 MEA androgenetic alopecia market estimates and forecasts, 2018 - 2030 (USD Million)
- Fig. 96 Key country dynamics
- Fig. 97 South Africa androgenetic alopecia market estimates and forecasts, 2018 - 2030 (USD Million) (Number of Patients Treated in Thousands)
- Fig. 98 Key country dynamics
- Fig. 99 Saudi Arabia androgenetic alopecia market estimates and forecasts, 2018 - 2030 (USD Million) (Number of Patients Treated in Thousands)
- Fig. 100 Key country dynamics
- Fig. 101 UAE androgenetic alopecia market estimates and forecasts, 2018 - 2030 (USD Million) (Number of Patients Treated in Thousands)
- Fig. 102 Key country dynamics
- Fig. 103 Kuwait androgenetic alopecia market estimates and forecasts, 2018 - 2030 (USD Million) (Number of Patients Treated in Thousands)
- Fig. 104 Key country dynamics
- Fig. 105 Turkey androgenetic alopecia market estimates and forecasts, 2018 - 2030 (USD Million) (Number of Patients Treated in Thousands)
- Fig. 106 Rest of MEA androgenetic alopecia market estimates and forecasts, 2018 - 2030 (USD Million) (Number of Patients Treated in Thousands)
- Fig. 108 Company market share analysis, 2023
- Fig. 109 Strategic framework
Androgenetic Alopecia Market Growth & Trends:
The global androgenetic alopecia market size is anticipated to reach USD 4.76 billion by 2030 and is anticipated to expand at a CAGR of 8.45% from 2024 to 2030, according to a new report by Grand View Research, Inc. The growing prevalence of androgenetic alopecia is one of the crucial factors driving the market growth. According to data published by the American Hair Loss Association, over 95% of hair loss in men is caused due to androgenetic alopecia. The occurrence of hair loss in men increases proportionately with age. On the basis of the report published by the International Society of Hair Restoration Surgery, in men, it is estimated that 40% of hair loss is encountered by the age of 35 years, 65% at 60 years, 70% at 80 years, and 80% at the age of 85 years.
Moreover, the market growth can be attributed to advancements in technology, including the introduction of a low-level laser therapy, which helps stimulate hair growth. Likewise, the introduction of several laser combs and hair massagers or brushes is also boosting the market. For instance, Lifemax Infrared Hairbrush, Follinex Massager Comb, and Hairmax Laser Comb are some of the technologically advanced products available in the market. Most clinical-based settings offer combination therapy of non-ablative laser treatment and topical application of medicinal products for better results. Microscopic injuries created by laser devices create a favorable wound-healing environment that triggers hair regrowth.
Furthermore, the increasing incidence of chronic diseases such as cancer is anticipated to offer lucrative opportunities for market growth. For instance, according to the latest report by Globocan, the incidence of cancer was estimated to be 19,288,916 in 2020 globally. Certain medications prescribed to patients for the treatment of cancer are also responsible for hair loss. For instance, chemotherapeutic agents, radiation therapy, hormone therapy, and immunotherapy are more likely to induce hair loss or hair thinning. Cancer incidence is expected to rise by about 70% over the next two decades, thus driving the market growth.
However, reimbursement coverage for androgenetic alopecia treatment is one of the major challenges in this market. Since most treatment modalities for AGA are considered cosmetic procedures and not medically essential ones, they are generally not covered under insurance. Out-of-pocket costs for AGA treatment usually include frequent doctor visits, prescription drug copays, and coinsurance for procedures. Alopecia has complex reimbursement positioning, as it is not a life-threatening disease. For instance, Aetna Inc.'s policy for alopecia states that drugs covered for mild conditions are different from those considered for more severe conditions. In addition, the scheme does not cover Rogaine (minoxidil) as it is considered an experimental therapy. Thus, lack of reimbursement policies for treatment is restraining the market growth.
Androgenetic Alopecia Market Report Highlights:
- The male segment dominated the market in 2023 due to the high adoption of androgenetic alopecia treatments
- The pharmaceuticals segment held the largest share in 2023. The increasing number of product approvals, rising investments by pharmaceutical companies, and shift in societal attitude toward adopting pharmaceutical drugs for the treatment of androgenetic alopecia are likely to play a prominent role in segment growth
- The devices treatment segment is expected to grow at the fastest CAGR over the forecast period
- The dermatology clinics end-use segment accounted for the largest revenue share in 2023 owing to increased consumer awareness regarding prescription medicines & modern treatments, such as laser technology, coupled with a strong product pipeline
- North America held a dominant revenue share in 2023 due to the high disease prevalence, consumer awareness, proactive government measures, technological advancements, and improvements in healthcare infrastructure
- In November 2023, Sun Pharma Advanced Research Company (SPARC) entered into an agreement with Johns Hopkins and the Czech research institute IOCB to exclusively license SCD-153, including all patents owned by IOCB
Table of Contents
Chapter 1. Methodology and Scope
- 1.1. Market Segmentation & Scope
- 1.2. Segment Definitions
- 1.2.1. Gender
- 1.2.2. Treatment
- 1.2.3. End Use
- 1.2.4. Sales Channel
- 1.2.5. Regional scope
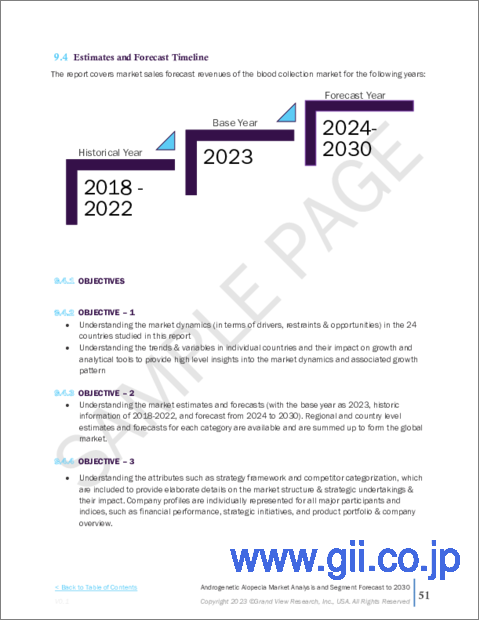
- 1.2.6. Estimates and forecasts timeline
- 1.3. Research Methodology
- 1.4. Information Procurement
- 1.4.1. Purchased database
- 1.4.2. GVR's internal database
- 1.4.3. Secondary sources
- 1.4.4. Primary research
- 1.4.5. Details of primary research
- 1.4.5.1. Data for primary interviews in Asia Pacific
- 1.5. Information or Data Analysis
- 1.5.1. Data analysis models
- 1.6. Market Formulation & Validation
- 1.7. Model Details
- 1.7.1. Commodity flow analysis (Model 1)
- 1.7.2. Approach 1: Commodity flow approach
- 1.7.3. Volume price analysis (Model 2)
- 1.7.4. Approach 2: Volume price analysis
- 1.8. List of Secondary Sources
- 1.9. List of Primary Sources
- 1.10. Objectives
Chapter 2. Executive Summary
- 2.1. Market Outlook
- 2.2. Segment Outlook
- 2.2.1. Gender outlook
- 2.2.2. Treatment outlook
- 2.2.3. End use outlook
- 2.2.4. Sales channel outlook
- 2.2.5. Regional outlook
- 2.3. Competitive Insights
Chapter 3. Androgenetic Alopecia Market Variables, Trends & Scope
- 3.1. Market Lineage Outlook
- 3.1.1. Parent market outlook
- 3.1.2. Related/ancillary market outlook
- 3.2. Market Dynamics
- 3.2.1. Market driver analysis
- 3.2.1.1. Increasing prevalence of androgenic alopecia
- 3.2.1.2. Technological advancements in androgenic alopecia
- 3.2.2. Market restraint analysis
- 3.2.2.1. Lack of reimbursement policies for androgenic alopecia
- 3.2.3. Market opportunity analysis
- 3.2.3.1. Increasing prevalence of chronic diseases
- 3.2.1. Market driver analysis
- 3.3. Androgenetic Alopecia Market Analysis Tools
- 3.3.1. Industry Analysis - Porter's
- 3.3.1.1. Supplier power
- 3.3.1.2. Buyer power
- 3.3.1.3. Substitution threat
- 3.3.1.4. Threat of new entrant
- 3.3.1.5. Competitive rivalry
- 3.3.2. PESTEL Analysis
- 3.3.2.1. Political landscape
- 3.3.2.2. Technological landscape
- 3.3.2.3. Economic landscape
- 3.3.1. Industry Analysis - Porter's
- 3.4. Androgenetic Alopecia Market: Prevalence Data, By Region
- 3.4.1. North America
- 3.4.1.1. U.S.
- 3.4.1.2. Canada
- 3.4.2. Europe
- 3.4.2.1. UK
- 3.4.2.2. Germany
- 3.4.2.3. France
- 3.4.2.4. Italy
- 3.4.2.5. Spain
- 3.4.2.6. Denmark
- 3.4.2.7. Sweden
- 3.4.2.8. Norway
- 3.4.3. Asia Pacific
- 3.4.3.1. Japan
- 3.4.3.2. China
- 3.4.3.3. India
- 3.4.3.4. South Korea
- 3.4.3.5. Australia
- 3.4.3.6. Thailand
- 3.4.4. Latin America
- 3.4.4.1. Brazil
- 3.4.4.2. Mexico
- 3.4.4.3. Argentina
- 3.4.5. Middle East and Africa (MEA)
- 3.4.5.1. South Africa
- 3.4.5.2. Saudi Arabia
- 3.4.5.3. UAE
- 3.4.5.4. Kuwait
- 3.4.1. North America
Chapter 4. Androgenetic Alopecia Market: Gender Estimates & Trend Analysis
- 4.1. Gender Market Share, 2023 & 2030
- 4.2. Segment Dashboard
- 4.3. Global Androgenetic Alopecia Market by Gender Outlook
- 4.4. Market Size & Forecasts and Trend Analyses, 2018 to 2030 for the following
- 4.4.1. Male
- 4.4.1.1. Market estimates and forecasts 2018 to 2030 (USD Million)
- 4.4.2. Female
- 4.4.2.1. Market estimates and forecasts 2018 to 2030 (USD Million)
- 4.4.1. Male
Chapter 5. Androgenetic Alopecia Market: Treatment Estimates & Trend Analysis
- 5.1. Treatment Market Share, 2023 & 2030
- 5.2. Segment Dashboard
- 5.3. Global Androgenetic Alopecia Market by Treatment Outlook
- 5.4. Market Size & Forecasts and Trend Analyses, 2018 to 2030 for the following
- 5.4.1. Pharmaceuticals
- 5.4.1.1. Market estimates and forecasts 2018 to 2030 (USD Million)
- 5.4.2. Devices
- 5.4.2.1. Market estimates and forecasts 2018 to 2030 (USD Million)
- 5.4.1. Pharmaceuticals
Chapter 6. Androgenetic Alopecia Market: End-use Estimates & Trend Analysis
- 6.1. End-use Market Share, 2023 & 2030
- 6.2. Segment Dashboard
- 6.3. Global Androgenetic Alopecia Market by End Use Outlook
- 6.4. Market Size & Forecasts and Trend Analyses, 2018 to 2030 for the following
- 6.4.1. Dermatology Clinics
- 6.4.1.1. Market estimates and forecasts 2018 to 2030 (USD million)
- 6.4.2. Homecare Settings
- 6.4.2.1. Market estimates and forecasts 2018 to 2030 (USD Million)
- 6.4.1. Dermatology Clinics
Chapter 7. Androgenetic Alopecia Market: Sales Channel Estimates & Trend Analysis
- 7.1. Sales Channel Market Share, 2023 & 2030
- 7.2. Segment Dashboard
- 7.3. Global Androgenetic Alopecia Market by Sales Channel Outlook
- 7.4. Market Size & Forecasts and Trend Analyses, 2018 to 2030 for the following
- 7.4.1. Prescription
- 7.4.1.1. Market estimates and forecasts 2018 to 2030 (USD Million)
- 7.4.2. OTC
- 7.4.2.1. Market estimates and forecasts 2018 to 2030 (USD Million)
- 7.4.1. Prescription
Chapter 8. Androgenetic Alopecia Market: Regional Estimates & Trend Analysis
- 8.1. Regional Market Share Analysis, 2023 & 2030
- 8.2. Regional Market Dashboard
- 8.3. Global Regional Market Snapshot
- 8.4. Market Size, & Forecasts Trend Analysis, 2018 to 2030:
- 8.5. North America
- 8.5.1. U.S.
- 8.5.1.1. Key country dynamics
- 8.5.1.2. Regulatory framework/ reimbursement structure
- 8.5.1.3. Competitive scenario
- 8.5.1.4. U.S. market estimates and forecasts 2018 to 2030 (USD Million) (Number of Patients Treated in Thousands)
- 8.5.2. Canada
- 8.5.2.1. Key country dynamics
- 8.5.2.2. Regulatory framework/ reimbursement structure
- 8.5.2.3. Competitive scenario
- 8.5.2.4. Canada market estimates and forecasts 2018 to 2030 (USD Million) (Number of Patients Treated in Thousands)
- 8.5.1. U.S.
- 8.6. Europe
- 8.6.1. UK
- 8.6.1.1. Key country dynamics
- 8.6.1.2. Regulatory framework/ reimbursement structure
- 8.6.1.3. Competitive scenario
- 8.6.1.4. UK market estimates and forecasts 2018 to 2030 (USD Million) (Number of Patients Treated in Thousands)
- 8.6.2. Germany
- 8.6.2.1. Key country dynamics
- 8.6.2.2. Regulatory framework/ reimbursement structure
- 8.6.2.3. Competitive scenario
- 8.6.2.4. Germany market estimates and forecasts 2018 to 2030 (USD Million) (Number of Patients Treated in Thousands)
- 8.6.3. France
- 8.6.3.1. Key country dynamics
- 8.6.3.2. Regulatory framework/ reimbursement structure
- 8.6.3.3. Competitive scenario
- 8.6.3.4. France market estimates and forecasts 2018 to 2030 (USD Million) (Number of Patients Treated in Thousands)
- 8.6.4. Italy
- 8.6.4.1. Key country dynamics
- 8.6.4.2. Regulatory framework/ reimbursement structure
- 8.6.4.3. Competitive scenario
- 8.6.4.4. Italy market estimates and forecasts 2018 to 2030 (USD Million) (Number of Patients Treated in Thousands)
- 8.6.5. Spain
- 8.6.5.1. Key country dynamics
- 8.6.5.2. Regulatory framework/ reimbursement structure
- 8.6.5.3. Competitive scenario
- 8.6.5.4. Spain market estimates and forecasts 2018 to 2030 (USD Million) (Number of Patients Treated in Thousands)
- 8.6.6. Norway
- 8.6.6.1. Key country dynamics
- 8.6.6.2. Regulatory framework/ reimbursement structure
- 8.6.6.3. Competitive scenario
- 8.6.6.4. Norway market estimates and forecasts 2018 to 2030 (USD Million) (Number of Patients Treated in Thousands)
- 8.6.7. Sweden
- 8.6.7.1. Key country dynamics
- 8.6.7.2. Regulatory framework/ reimbursement structure
- 8.6.7.3. Competitive scenario
- 8.6.7.4. Sweden market estimates and forecasts 2018 to 2030 (USD Million) (Number of Patients Treated in Thousands)
- 8.6.8. Denmark
- 8.6.8.1. Key country dynamics
- 8.6.8.2. Regulatory framework/ reimbursement structure
- 8.6.8.3. Competitive scenario
- 8.6.8.4. Denmark market estimates and forecasts 2018 to 2030 (USD Million) (Number of Patients Treated in Thousands)
- 8.6.1. UK
- 8.7. Asia Pacific
- 8.7.1. Japan
- 8.7.1.1. Key country dynamics
- 8.7.1.2. Regulatory framework/ reimbursement structure
- 8.7.1.3. Competitive scenario
- 8.7.1.4. Japan market estimates and forecasts 2018 to 2030 (USD Million) (Number of Patients Treated in Thousands)
- 8.7.2. China
- 8.7.2.1. Key country dynamics
- 8.7.2.2. Regulatory framework/ reimbursement structure
- 8.7.2.3. Competitive scenario
- 8.7.2.4. China market estimates and forecasts 2018 to 2030 (USD Million) (Number of Patients Treated in Thousands)
- 8.7.3. India
- 8.7.3.1. Key country dynamics
- 8.7.3.2. Regulatory framework/ reimbursement structure
- 8.7.3.3. Competitive scenario
- 8.7.3.4. India market estimates and forecasts 2018 to 2030 (USD Million) (Number of Patients Treated in Thousands)
- 8.7.4. Australia
- 8.7.4.1. Key country dynamics
- 8.7.4.2. Regulatory framework/ reimbursement structure
- 8.7.4.3. Competitive scenario
- 8.7.4.4. Australia market estimates and forecasts 2018 to 2030 (USD Million) (Number of Patients Treated in Thousands)
- 8.7.5. South Korea
- 8.7.5.1. Key country dynamics
- 8.7.5.2. Regulatory framework/ reimbursement structure
- 8.7.5.3. Competitive scenario
- 8.7.5.4. South Korea market estimates and forecasts 2018 to 2030 (USD Million) (Number of Patients Treated in Thousands)
- 8.7.6. Thailand
- 8.7.6.1. Key country dynamics
- 8.7.6.2. Regulatory framework/ reimbursement structure
- 8.7.6.3. Competitive scenario
- 8.7.6.4. Thailand market estimates and forecasts 2018 to 2030 (USD Million) (Number of Patients Treated in Thousands)
- 8.7.1. Japan
- 8.8. Latin America
- 8.8.1. Brazil
- 8.8.1.1. Key country dynamics
- 8.8.1.2. Regulatory framework/ reimbursement structure
- 8.8.1.3. Competitive scenario
- 8.8.1.4. Brazil market estimates and forecasts 2018 to 2030 (USD Million) (Number of Patients Treated in Thousands)
- 8.8.2. Mexico
- 8.8.2.1. Key country dynamics
- 8.8.2.2. Regulatory framework/ reimbursement structure
- 8.8.2.3. Competitive scenario
- 8.8.2.4. Mexico market estimates and forecasts 2018 to 2030 (USD Million) (Number of Patients Treated in Thousands)
- 8.8.3. Argentina
- 8.8.3.1. Key country dynamics
- 8.8.3.2. Regulatory framework/ reimbursement structure
- 8.8.3.3. Competitive scenario
- 8.8.3.4. Argentina market estimates and forecasts 2018 to 2030 (USD Million) (Number of Patients Treated in Thousands)
- 8.8.1. Brazil
- 8.9. MEA
- 8.9.1. South Africa
- 8.9.1.1. Key country dynamics
- 8.9.1.2. Regulatory framework/ reimbursement structure
- 8.9.1.3. Competitive scenario
- 8.9.1.4. South Africa market estimates and forecasts 2018 to 2030 (USD Million) (Number of Patients Treated in Thousands)
- 8.9.2. Saudi Arabia
- 8.9.2.1. Key country dynamics
- 8.9.2.2. Regulatory framework/ reimbursement structure
- 8.9.2.3. Competitive scenario
- 8.9.2.4. Saudi Arabia market estimates and forecasts 2018 to 2030 (USD Million) (Number of Patients Treated in Thousands)
- 8.9.3. UAE
- 8.9.3.1. Key country dynamics
- 8.9.3.2. Regulatory framework/ reimbursement structure
- 8.9.3.3. Competitive scenario
- 8.9.3.4. UAE market estimates and forecasts 2018 to 2030 (USD Million) (Number of Patients Treated in Thousands)
- 8.9.4. Kuwait
- 8.9.4.1. Key country dynamics
- 8.9.4.2. Regulatory framework/ reimbursement structure
- 8.9.4.3. Competitive scenario
- 8.9.4.4. Kuwait market estimates and forecasts 2018 to 2030 (USD Million) (Number of Patients Treated in Thousands)
- 8.9.1. South Africa
Chapter 9. Competitive Landscape
- 9.1. Recent Developments & Impact Analysis, By Key Market Participants
- 9.2. Company/Competition Categorization
- 9.3. Vendor Landscape
- 9.3.1. List of key distributors and channel partners
- 9.3.2. Key customers
- 9.3.3. Key company market share analysis, 2023
- 9.3.4. Johnson & Johnson Services, Inc.
- 9.3.4.1. Company overview
- 9.3.4.2. Financial performance
- 9.3.4.3. Product benchmarking
- 9.3.4.4. Strategic initiatives
- 9.3.5. Cipla, Inc.
- 9.3.5.1. Company overview
- 9.3.5.2. Financial performance
- 9.3.5.3. Product benchmarking
- 9.3.5.4. Strategic initiatives
- 9.3.6. Sun Pharmaceutical Industries Ltd.
- 9.3.6.1. Company overview
- 9.3.6.2. Financial performance
- 9.3.6.3. Product benchmarking
- 9.3.6.4. Strategic initiatives
- 9.3.7. Merck & Co., Inc.
- 9.3.7.1. Company overview
- 9.3.7.2. Financial performance
- 9.3.7.3. Product benchmarking
- 9.3.7.4. Strategic initiatives
- 9.3.8. Dr. Reddy's Laboratories Ltd.
- 9.3.8.1. Company overview
- 9.3.8.2. Financial performance
- 9.3.8.3. Product benchmarking
- 9.3.8.4. Strategic initiatives
- 9.3.9. Aurobindo Pharma
- 9.3.9.1. Company overview
- 9.3.9.2. Financial performance
- 9.3.9.3. Product benchmarking
- 9.3.9.4. Strategic initiatives
- 9.3.10. Lexington Intl., LLC
- 9.3.10.1. Company overview
- 9.3.10.2. Financial performance
- 9.3.10.3. Product benchmarking
- 9.3.10.4. Strategic initiatives
- 9.3.11. Freedom Laser Therapy, Inc. (iRESTORE Hair Growth System)
- 9.3.11.1. Company overview
- 9.3.11.2. Financial performance
- 9.3.11.3. Product benchmarking
- 9.3.11.4. Strategic initiatives
- 9.3.12. Curallux, LLC
- 9.3.12.1. Company overview
- 9.3.12.2. Financial performance
- 9.3.12.3. Product benchmarking
- 9.3.12.4. Strategic initiatives
- 9.3.13. Apira Science, Inc. (iGROW Laser)
- 9.3.13.1. Company overview
- 9.3.13.2. Financial performance
- 9.3.13.3. Product benchmarking
- 9.3.13.4. Strategic initiatives
- 9.3.14. Theradome, Inc.
- 9.3.14.1. Company overview
- 9.3.14.2. Financial performance
- 9.3.14.3. Product benchmarking
- 9.3.14.4. Strategic initiatives

