|
|
市場調査レポート
商品コード
1433539
gRNA市場規模、シェア、動向分析レポート:製品・サービス別、gRNAタイプ別、用途別、最終用途別、地域別、セグメント予測、2024年~2030年gRNA Market Size, Share & Trends Analysis Report By Product & Services (Products, Custom gRNA Synthesis Services), By gRNA Type (Research-Use), By Application, By End-use, By Region, And Segment Forecasts, 2024 - 2030 |
||||||
|
|
|||||||
カスタマイズ可能
|
|||||||


| gRNA市場規模、シェア、動向分析レポート:製品・サービス別、gRNAタイプ別、用途別、最終用途別、地域別、セグメント予測、2024年~2030年 |
|
出版日: 2024年01月03日
発行: Grand View Research
ページ情報: 英文 110 Pages
納期: 2~10営業日
|

- 全表示
- 概要
- 図表
- 目次
gRNA市場の成長と動向:
Grand View Research, Inc.の最新レポートによると、世界のgRNA市場規模は2030年までに16億2,000万米ドルに達すると予測され、2024年から2030年までのCAGRは18.6%で成長すると予測されています。
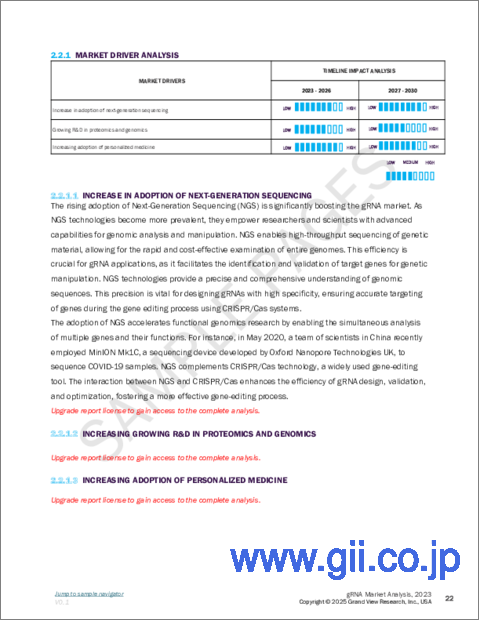
次世代シーケンシング(NGS)の採用が増加していることが市場を大きく押し上げています。NGS技術が普及するにつれ、研究者や科学者にゲノム解析や操作のための高度な能力を与えます。NGSは遺伝物質のハイスループットシーケンスを可能にし、ゲノム全体を迅速かつコスト効率よく調べることを可能にします。この効率性は、遺伝子操作の標的遺伝子の同定と検証を容易にするため、gRNA用途にとって極めて重要です。NGS技術は、ゲノム配列の正確かつ包括的な理解を提供します。この精度は、CRISPR/Casシステムを用いた遺伝子編集プロセスにおいて遺伝子の正確なターゲティングを確実にする、高い特異性を持つgRNAの設計に不可欠です。
さらに、バイオテクノロジー企業や製薬企業による研究開発活動への投資の増加は、今後数年間の市場の活性化につながると予想されます。ユーザーフレンドリーで手頃な価格のgRNA合成キットやサービスが開発されたことで、CRISPR-Cas9技術はあらゆるレベルの研究者にとってより身近なものとなりました。CRISPR-Cas9の新規用途の継続的な発見は、gRNAの需要を煽ります。
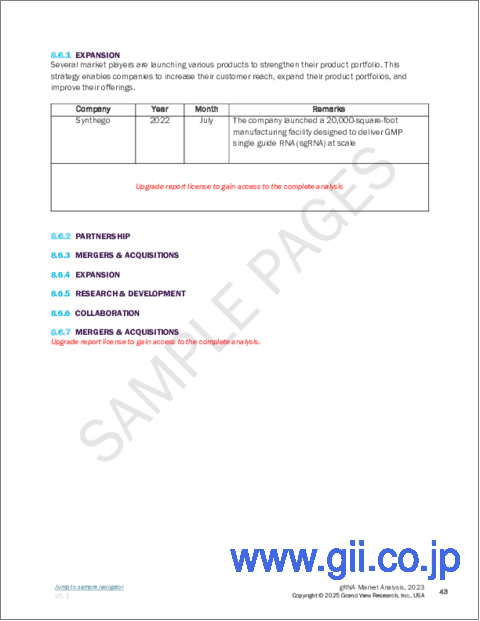
さらに、新しいgRNA最終製品の発売は、技術革新を促進し、プレーヤーの市場リーチを拡大し、遺伝子編集技術の採用を加速し、市場全体の成長と進歩に貢献することができます。例えば、2023年10月、ゲノム工学ソリューションの著名なプロバイダーであるSynthegoは、IND-enabling(INDe)gRNAを発売しました。この革新的な提供は、CRISPRベースの細胞・遺伝子治療の前臨床パイプラインにおける重要な進歩を意味します。この製品は、GLP規制の前臨床試験およびIND-enabling試験のために綿密に設計された高品質のgRNAを研究者に提供することで、設計および製造全体を通じて包括的なINDに準拠した材料と文書を組み込んでいます。従って、市場成長の原動力となります。
gRNA市場レポートハイライト
- 製品・サービス別では、製品分野が2023年に73.4%の最大収益シェアを占めました。これらの製品は遺伝子編集において高い精度、効率、特異性を提供するため、研究者の間で人気があり、市場拡大を促進する1次要因となっています。
- gRNAの種類別では、研究用セグメントが2023年の市場シェアを独占しました。さまざまな研究機関で実施されている多数の研究プログラムが研究グレードのgRNAを要求していることが、このセグメントの需要を押し上げています。
- 用途別では、ゲノム工学分野が2023年の市場シェアを独占しました。この成長は、研究および治療目的のための高度な遺伝子ツールの需要の増加に起因しています。
- 最終用途別では、製薬・バイオテクノロジー企業が2023年の市場シェアを独占しました。製薬・バイオテクノロジー企業による精密医療へのgRNAの採用は、個別化治療の開発に不可欠となるため、市場成長を促進します。
- 北米は、同地域の主要市場プレイヤーの存在により、2023年の売上高シェア52.6%で世界の業界を支配しました。
目次
第1章 調査手法と範囲
第2章 gRNA市場:エグゼクティブサマリー
- 市場の見通し
- セグメントのスナップショット
- 競合情勢のスナップショット
第3章 gRNA市場変数、動向、および範囲
- 市場セグメンテーションと範囲
- 市場系統の見通し
- 親市場の見通し
- 関連/付随市場の見通し
- 市場力学
- 市場促進要因分析
- 次世代シーケンスの採用の増加
- プロテオミクスとゲノミクスにおける研究開発の成長
- 個別化医療の採用の増加
- 市場抑制要因分析
- 規制上の課題
- オフターゲット効果と安全性への懸念
- 事業環境分析
- ポーターのファイブフォース分析
- PESTLE分析
- COVID-19の分析
第4章 製品とサービスの推定・動向分析
- gRNA市場:製品およびサービスの変動分析
- 製品
- 製品市場推計・予測、2018~2030年
- gRNA最終製品
- gRNA合成製品
- カスタムgRNA合成サービス
- カスタムgRNA合成サービス市場推計・予測、2018~2030年
第5章 gRNAタイプの推定・動向分析
- gRNA市場:gRNAタイプの変動分析
- 研究利用
- GMPグレード
第6章 用途の推定・動向分析
- gRNA市場:用途変動分析
- ゲノム工学
- ゲノムエンジニアリング市場収益推計と予測、2018年から2030年
- 疾患モデル研究
- 疾患モデル研究市場収益推計と予測、2018~2030年
- 機能的ゲノミクス
- 機能性ゲノミクス市場収益推計と予測、2018~2030年
- エピジェネティクス
- エピジェネティクス市場収益推計と予測、2018~2030年
- その他
- その他の市場収益推計と予測、2018~2030年
第7章 最終用途の推定・動向分析
- gRNA市場:最終用途の変動分析
- 製薬およびバイオテクノロジー企業
- 学術調査機関
- CMOとCRO
第8章 地域ビジネス分析
- 地域市場のスナップショット
- 北米
- 米国
- カナダ
- 欧州
- 英国
- ドイツ
- スペイン
- フランス
- イタリア
- デンマーク
- スウェーデン
- ノルウェー
- アジア太平洋地域
- 日本
- 中国
- インド
- 韓国
- タイ
- オーストラリア
- ラテンアメリカ
- ブラジル
- メキシコ
- アルゼンチン
- 中東・アフリカ
- 南アフリカ
- サウジアラビア
- アラブ首長国連邦
- クウェート
第9章 競合情勢
- 企業の分類
- 戦略マッピング
- 取得
- 製品/サービスの開始
- パートナーシップ/コラボレーション
- その他
- 市況分析、2023年
- 企業プロファイル
- Thermo Fisher Scientififc, Inc
- Agilent Technologies, Inc.
- System Biosciences, LLC.
- Jena Bioscience GmbH
- Merck KGaA
- Azenta Life Sciences(Genewiz)
- Takara Bio Inc.
- Synbio Technologies
- Revvity Inc(Horizon Discovery Ltd.)
- Synthego
List of Tables
- TABLE 1 List of Secondary Sources
- TABLE 2 List of Abbreviations
- TABLE 3 Global gRNA market, by Product & Services, 2018 - 2030 (USD Million)
- TABLE 4 Global gRNA market, by gRNA Type, 2018 - 2030 (USD Million)
- TABLE 5 Global gRNA market, by Application, 2018 - 2030 (USD Million)
- TABLE 6 Global gRNA market, by End-Use, 2018 - 2030 (USD Million)
- TABLE 7 Global gRNA market, by Region, 2018 - 2030 (USD Million)
- TABLE 8 North America gRNA market, by Country, 2018 - 2030 (USD Million)
- TABLE 9 North America gRNA market, by Product & Services, 2018 - 2030 (USD Million)
- TABLE 10 North America gRNA market, by gRNA Type, 2018 - 2030 (USD Million)
- TABLE 11 North America gRNA market, by Application, 2018 - 2030 (USD Million)
- TABLE 12 North America gRNA market, by End-Use, 2018 - 2030 (USD Million)
- TABLE 13 U.S. gRNA market, by Product & Services, 2018 - 2030 (USD Million)
- TABLE 14 U.S. gRNA market, by gRNA Type, 2018 - 2030 (USD Million)
- TABLE 15 U.S. gRNA market, by Application, 2018 - 2030 (USD Million)
- TABLE 16 U.S. gRNA market, by End-Use, 2018 - 2030 (USD Million)
- TABLE 17 Canada gRNA market, by Product & Services, 2018 - 2030 (USD Million)
- TABLE 18 Canada gRNA market, by gRNA Type, 2018 - 2030 (USD Million)
- TABLE 19 Canada gRNA market, by Application, 2018 - 2030 (USD Million)
- TABLE 20 Canada gRNA market, by End-Use, 2018 - 2030 (USD Million)
- TABLE 21 Europe gRNA market, by Country, 2018 - 2030 (USD Million)
- TABLE 22 Europe gRNA market, by Product & Services, 2018 - 2030 (USD Million)
- TABLE 23 Europe gRNA market, by gRNA Type, 2018 - 2030 (USD Million)
- TABLE 24 Europe gRNA market, by Application, 2018 - 2030 (USD Million)
- TABLE 25 Europe gRNA market, by End-Use, 2018 - 2030 (USD Million)
- TABLE 26 UK gRNA market, by Product & Services, 2018 - 2030 (USD Million)
- TABLE 27 UK gRNA market, by gRNA Type, 2018 - 2030 (USD Million)
- TABLE 28 UK gRNA market, by Application, 2018 - 2030 (USD Million)
- TABLE 29 UK gRNA market, by End-Use, 2018 - 2030 (USD Million)
- TABLE 30 Germany gRNA market, by Product & Services, 2018 - 2030 (USD Million)
- TABLE 31 Germany gRNA market, by gRNA Type, 2018 - 2030 (USD Million)
- TABLE 32 Germany gRNA market, by Application, 2018 - 2030 (USD Million)
- TABLE 33 Germany gRNA market, by End-Use, 2018 - 2030 (USD Million)
- TABLE 34 France gRNA market, by Product & Services, 2018 - 2030 (USD Million)
- TABLE 35 France gRNA market, by gRNA Type, 2018 - 2030 (USD Million)
- TABLE 36 France gRNA market, by Application, 2018 - 2030 (USD Million)
- TABLE 37 France gRNA market, by End-Use, 2018 - 2030 (USD Million)
- TABLE 38 Italy gRNA market, by Product & Services, 2018 - 2030 (USD Million)
- TABLE 39 Italy gRNA market, by gRNA Type, 2018 - 2030 (USD Million)
- TABLE 40 Italy gRNA market, by Application, 2018 - 2030 (USD Million)
- TABLE 41 Italy gRNA market, by End-Use, 2018 - 2030 (USD Million)
- TABLE 42 Spain gRNA market, by Product & Services, 2018 - 2030 (USD Million)
- TABLE 43 Spain gRNA market, by gRNA Type, 2018 - 2030 (USD Million)
- TABLE 44 Spain gRNA market, by Application, 2018 - 2030 (USD Million)
- TABLE 45 Spain gRNA market, by End-Use, 2018 - 2030 (USD Million)
- TABLE 46 Sweden gRNA market, by Product & Services, 2018 - 2030 (USD Million)
- TABLE 47 Sweden gRNA market, by gRNA Type, 2018 - 2030 (USD Million)
- TABLE 48 Sweden gRNA market, by Application, 2018 - 2030 (USD Million)
- TABLE 49 Sweden gRNA market, by End-Use, 2018 - 2030 (USD Million)
- TABLE 50 Norway gRNA market, by Product & Services, 2018 - 2030 (USD Million)
- TABLE 51 Norway gRNA market, by gRNA Type, 2018 - 2030 (USD Million)
- TABLE 52 Norway gRNA market, by Application, 2018 - 2030 (USD Million)
- TABLE 53 Norway gRNA market, by End-Use, 2018 - 2030 (USD Million)
- TABLE 54 Denmark gRNA market, by Product & Services, 2018 - 2030 (USD Million)
- TABLE 55 Denmark gRNA market, by gRNA Type, 2018 - 2030 (USD Million)
- TABLE 56 Denmark gRNA market, by Application, 2018 - 2030 (USD Million)
- TABLE 57 Denmark gRNA market, by End-Use, 2018 - 2030 (USD Million)
- TABLE 58 Asia Pacific gRNA market, by Country, 2018 - 2030 (USD Million)
- TABLE 59 Asia Pacific gRNA market, by Product & Services, 2018 - 2030 (USD Million)
- TABLE 60 Asia Pacific gRNA market, by gRNA Type, 2018 - 2030 (USD Million)
- TABLE 61 Asia Pacific gRNA market, by Application, 2018 - 2030 (USD Million)
- TABLE 62 Asia Pacific gRNA market, by End-Use, 2018 - 2030 (USD Million)
- TABLE 63 Japan gRNA market, by Product & Services, 2018 - 2030 (USD Million)
- TABLE 64 Japan gRNA market, by gRNA Type, 2018 - 2030 (USD Million)
- TABLE 65 Japan gRNA market, by Application, 2018 - 2030 (USD Million)
- TABLE 66 Japan gRNA market, by End-Use, 2018 - 2030 (USD Million)
- TABLE 67 China gRNA market, by Product & Services, 2018 - 2030 (USD Million)
- TABLE 68 China gRNA market, by gRNA Type, 2018 - 2030 (USD Million)
- TABLE 69 China gRNA market, by Application, 2018 - 2030 (USD Million)
- TABLE 70 China gRNA market, by End-Use, 2018 - 2030 (USD Million)
- TABLE 71 India gRNA market, by Product & Services, 2018 - 2030 (USD Million)
- TABLE 72 India gRNA market, by gRNA Type, 2018 - 2030 (USD Million)
- TABLE 73 India gRNA market, by Application, 2018 - 2030 (USD Million)
- TABLE 74 India gRNA market, by End-Use, 2018 - 2030 (USD Million)
- TABLE 75 Australia gRNA arket, by Product & Services, 2018 - 2030 (USD Million)
- TABLE 76 Australia gRNA market, by gRNA Type, 2018 - 2030 (USD Million)
- TABLE 77 Australia gRNA market, by Application, 2018 - 2030 (USD Million)
- TABLE 78 Australia gRNA market, by End-Use, 2018 - 2030 (USD Million)
- TABLE 79 South Korea gRNA market, by Product & Services, 2018 - 2030 (USD Million)
- TABLE 80 South Korea gRNA market, by gRNA Type, 2018 - 2030 (USD Million)
- TABLE 81 South Korea gRNA market, by Application, 2018 - 2030 (USD Million)
- TABLE 82 South Korea gRNA market, by End-Use, 2018 - 2030 (USD Million)
- TABLE 83 Thailand gRNA market, by Product & Services, 2018 - 2030 (USD Million)
- TABLE 84 Thailand gRNA market, by gRNA Type, 2018 - 2030 (USD Million)
- TABLE 85 Thailand gRNA market, by Application, 2018 - 2030 (USD Million)
- TABLE 86 Thailand gRNA market, by End-Use, 2018 - 2030 (USD Million)
- TABLE 87 Latin America gRNA market, by Country, 2018 - 2030 (USD Million)
- TABLE 88 Latin America gRNA market, by Product & Services, 2018 - 2030 (USD Million)
- TABLE 89 Latin America gRNA market, by gRNA Type, 2018 - 2030 (USD Million)
- TABLE 90 Latin America gRNA market, by Application, 2018 - 2030 (USD Million)
- TABLE 91 Latin America gRNA market, by End-Use, 2018 - 2030 (USD Million)
- TABLE 92 Brazil gRNA market, by Product & Services, 2018 - 2030 (USD Million)
- TABLE 93 Brazil gRNA market, by gRNA Type, 2018 - 2030 (USD Million)
- TABLE 94 Brazil gRNA market, by Application, 2018 - 2030 (USD Million)
- TABLE 95 Brazil gRNA market, by End-Use, 2018 - 2030 (USD Million)
- TABLE 96 Mexico gRNA market, by Product & Services, 2018 - 2030 (USD Million)
- TABLE 97 Mexico gRNA market, by gRNA Type, 2018 - 2030 (USD Million)
- TABLE 98 Mexico gRNA market, by Application, 2018 - 2030 (USD Million)
- TABLE 99 Mexico gRNA market, by End-Use, 2018 - 2030 (USD Million)
- TABLE 100 Argentina gRNA market, by Product & Services, 2018 - 2030 (USD Million)
- TABLE 101 Argentina gRNA market, by gRNA Type, 2018 - 2030 (USD Million)
- TABLE 102 Argentina gRNA market, by Application, 2018 - 2030 (USD Million)
- TABLE 103 Argentina gRNA market, by End-Use, 2018 - 2030 (USD Million)
- TABLE 104 MEA gRNA market, by Country, 2018 - 2030 (USD Million)
- TABLE 105 MEA gRNA market, by Product & Services, 2018 - 2030 (USD Million)
- TABLE 106 MEA gRNA market, by gRNA Type, 2018 - 2030 (USD Million)
- TABLE 107 MEA gRNA market, by Application, 2018 - 2030 (USD Million)
- TABLE 108 MEA gRNA market, by End-Use, 2018 - 2030 (USD Million)
- TABLE 109 South Africa gRNA market, by Product & Services, 2018 - 2030 (USD Million)
- TABLE 110 South Africa gRNA market, by gRNA Type, 2018 - 2030 (USD Million)
- TABLE 111 South Africa gRNA market, by Application, 2018 - 2030 (USD Million)
- TABLE 112 South Africa gRNA market, by End-Use, 2018 - 2030 (USD Million)
- TABLE 113 Saudi Arabia gRNA market, by Product & Services, 2018 - 2030 (USD Million)
- TABLE 114 Saudi Arabia gRNA market, by gRNA Type, 2018 - 2030 (USD Million)
- TABLE 115 Saudi Arabia gRNA market, by Application, 2018 - 2030 (USD Million)
- TABLE 116 Saudi Arabia gRNA market, by End-Use, 2018 - 2030 (USD Million)
- TABLE 117 UAE gRNA market, by Product & Services, 2018 - 2030 (USD Million)
- TABLE 118 UAE gRNA market, by gRNA Type, 2018 - 2030 (USD Million)
- TABLE 119 UAE gRNA market, by Application, 2018 - 2030 (USD Million)
- TABLE 120 UAE gRNA market, by End-Use, 2018 - 2030 (USD Million)
- TABLE 121 Kuwait gRNA market, by Product & Services, 2018 - 2030 (USD Million)
- TABLE 122 Kuwait gRNA market, by gRNA Type, 2018 - 2030 (USD Million)
- TABLE 123 Kuwait gRNA market, by Application, 2018 - 2030 (USD Million)
- TABLE 124 Kuwait gRNA market, by End-Use, 2018 - 2030 (USD Million)
List of Figures
- FIG. 1 Market Research Process
- FIG. 2 Information Procurement
- FIG. 3 Primary Research Pattern
- FIG. 4 Market Research Approaches
- FIG. 5 Value Chain-Based Sizing & Forecasting
- FIG. 6 Market Formulation & Validation
- FIG. 7 gRNA market Segmentation
- FIG. 8 Market Snapshot, 2023
- FIG. 9 Market Trends & Outlook
- FIG. 10 Market Driver Relevance Analysis (Current & Future Impact)
- FIG. 11 Market Restraint Relevance Analysis (Current & Future Impact)
- FIG. 12 SWOT Analysis, By Factor (Political & Legal, Economic, And Technological)
- FIG. 13 Porter's Five Forces Analysis
- FIG. 14 Market Penetration & Growth Prospect Mapping, 2023
- FIG. 15 Global gRNA market: Product & Services Movement Analysis
- FIG. 16 Global gRNA market, For Products, 2018 - 2030 (USD Million)
- FIG. 17 Global gRNA market, For gRNA Final Products, 2018 - 2030 (USD Million)
- FIG. 18 Global gRNA market, For gRNA Synthesis Products, 2018 - 2030 (USD Million)
- FIG. 19 Global gRNA market, For gRNA Synthesis Kits, 2018 - 2030 (USD Million)
- FIG. 20 Global gRNA market, For Plasmids, 2018 - 2030 (USD Million)
- FIG. 21 Global gRNA market, For Others, 2018 - 2030 (USD Million)
- FIG. 22 Global gRNA market, For Custom gRNA Synthesis Services, 2018 - 2030 (USD Million)
- FIG. 23 Global gRNA market: gRNA Type Movement Analysis
- FIG. 24 Global gRNA market, For Research-Use, 2018 - 2030 (USD Million)
- FIG. 25 Global gRNA market, For GMP-grade, 2018 - 2030 (USD Million)
- FIG. 26 Global gRNA market: Application Movement Analysis
- FIG. 27 Global gRNA market, For Genome Engineering, 2018 - 2030 (USD Million)
- FIG. 28 Global gRNA market, For Disease Model Studies, 2018 - 2030 (USD Million)
- FIG. 29 Global gRNA market, For Functional Genomics, 2018 - 2030 (USD Million)
- FIG. 30 Global gRNA market, For Epigenetics, 2018 - 2030 (USD Million)
- FIG. 31 Global gRNA market, For Others, 2018 - 2030 (USD Million)
- FIG. 32 Global gRNA market: End-Use Movement Analysis
- FIG. 33 Global gRNA market, For Pharmaceutical & Biotechnology Companies, 2018 - 2030 (USD Million)
- FIG. 34 Global gRNA market, For Academic Research Institutes, 2018 - 2030 (USD Million)
- FIG. 35 Global gRNA market, For CMOs & CROs, 2018 - 2030 (USD Million)
- FIG. 36 Regional Marketplace: Key Takeaways
- FIG. 37 Regional Outlook, 2023 & 2030
- FIG. 38 Global gRNA market: Region Movement Analysis
- FIG. 39 North America gRNA market, 2018 - 2030 (USD Million)
- FIG. 40 U.S. gRNA market, 2018 - 2030 (USD Million)
- FIG. 41 Canada gRNA market, 2018 - 2030 (USD Million)
- FIG. 42 Europe gRNA market, 2018 - 2030 (USD Million)
- FIG. 43 Germany gRNA market, 2018 - 2030 (USD Million)
- FIG. 44 UK gRNA market, 2018 - 2030 (USD Million)
- FIG. 45 France gRNA market, 2018 - 2030 (USD Million)
- FIG. 46 Italy gRNA market, 2018 - 2030 (USD Million)
- FIG. 47 Spain gRNA market, 2018 - 2030 (USD Million)
- FIG. 48 Denmark gRNA market, 2018 - 2030 (USD Million)
- FIG. 49 Sweden gRNA market, 2018 - 2030 (USD Million)
- FIG. 50 Norway gRNA market, 2018 - 2030 (USD Million)
- FIG. 51 Asia Pacific gRNA market, 2018 - 2030 (USD Million)
- FIG. 52 Japan gRNA market, 2018 - 2030 (USD Million)
- FIG. 53 China gRNA market, 2018 - 2030 (USD Million)
- FIG. 54 India gRNA market, 2018 - 2030 (USD Million)
- FIG. 55 Australia gRNA market, 2018 - 2030 (USD Million)
- FIG. 56 South Korea gRNA market, 2018 - 2030 (USD Million)
- FIG. 57 Thailand gRNA market, 2018 - 2030 (USD Million)
- FIG. 58 Latin America gRNA market, 2018 - 2030 (USD Million)
- FIG. 59 Brazil gRNA market, 2018 - 2030 (USD Million)
- FIG. 60 Mexico gRNA market, 2018 - 2030 (USD Million)
- FIG. 61 Argentina gRNA market, 2018 - 2030 (USD Million)
- FIG. 62 Middle East And Africa gRNA market, 2018 - 2030 (USD Million)
- FIG. 63 South Africa gRNA market, 2018 - 2030 (USD Million)
- FIG. 64 Saudi Arabia gRNA market, 2018 - 2030 (USD Million)
- FIG. 65 UAE gRNA market, 2018 - 2030 (USD Million)
- FIG. 66 Kuwait gRNA market, 2018 - 2030 (USD Million)
gRNA Market Growth & Trends:
The global gRNA market size is anticipated to reach USD 1.62 billion by 2030 and it is projected to grow at a CAGR of 18.6% from 2024 to 2030, according to a new report by Grand View Research, Inc. The rising adoption of Next-Generation Sequencing (NGS) is significantly boosting the market. As NGS technologies become more prevalent, they empower researchers and scientists with advanced capabilities for genomic analysis and manipulation. NGS enables high-throughput sequencing of genetic material, allowing for the rapid and cost-effective examination of entire genomes. This efficiency is crucial for gRNA applications, as it facilitates the identification and validation of target genes for genetic manipulation. NGS technologies provide a precise and comprehensive understanding of genomic sequences. This precision is vital for designing gRNAs with high specificity, ensuring accurate targeting of genes during the gene editing process using CRISPR/Cas systems.
Furthermore, the increasing investments by biotechnology and pharmaceutical companies for R&D activities are expected to fuel the market in the coming years. The development of user-friendly and affordable gRNA synthesis kits and services has made CRISPR-Cas9 technology more accessible to researchers of all levels. The continuous discovery of novel applications for CRISPR-Cas9 fuels the demand for gRNA.
Additionally, the launch of new gRNA final products can drive innovation, expand the market reach of players, and accelerate the adoption of gene editing technologies, contributing to the overall growth & advancement of the market. For instance, in October 2023, Synthego, a prominent provider of genome engineering solutions, launched IND-enabling (INDe) gRNAs. This transformative offering marks a significant advancement in the CRISPR-based cell and gene therapy preclinical pipeline. By providing researchers with high-quality gRNAs meticulously designed for GLP-regulated preclinical and IND-enabling studies, this product incorporates comprehensive IND-compliant materials and documentation throughout its design and production. Thus, it will drive the market growth.
gRNA Market Report Highlights:
- On the basis of product & services, the product segment accounted for the largest revenue share of 73.4% in 2023. These products offer high accuracy, efficiency, and specificity in gene editing, making them popular among researchers is one of the primary drivers driving market expansion
- On the basis of gRNA type, the research-use segment dominated the market share in 2023. A large number of research programs conducted across various research institutes demand research-grade gRNA is driving up demand for this segment
- On the basis of application, the genome engineering segment dominated the market share in 2023. This growth can be attributed to the increasing demand for advanced genetic tools for research and therapeutic purposes
- On the basis of end-use, the pharmaceutical & biotechnology companies segment dominated the market share in 2023. The adoption of gRNA in precision medicine by pharmaceutical and biotech companies fuels its market growth as it becomes integral to the development of personalized therapies
- North America dominated the global industry in 2023 with a revenue share of 52.6% owing to the presence of key market players in the region
Table of Contents
Chapter 1. Methodology and Scope
- 1.1. Market Segmentation and Scope
- 1.1.1. Segment Definitions
- 1.2. Information Analysis
- 1.3. Market Formulation & Data Visualization
- 1.4. Data Validation & Publishing
- 1.5. Information Procurement
- 1.5.1. Primary Research
- 1.6. Information or Data Analysis
- 1.7. Market Formulation & Validation
- 1.8. Market Model
- 1.9. Objectives
- 1.9.1. Objective 1
- 1.9.2. Objective 2
Chapter 2. gRNA Market: Executive Summary
- 2.1. Market Outlook
- 2.2. Segment Snapshot
- 2.3. Competitive Landscape Snapshot
Chapter 3. gRNA Market Variables, Trends, & Scope
- 3.1. Market Segmentation and Scope
- 3.2. Market Lineage Outlook
- 3.2.1. Parent Market Outlook
- 3.2.2. Related/Ancillary Market Outlook
- 3.3. Market Dynamics
- 3.4. Market Drivers Analysis
- 3.4.1. Increase in adoption of Next-Generation Sequencing
- 3.4.2. Growing R&D in proteomics and genomics
- 3.4.3. Increasing adoption of personalized medicine
- 3.5. Market Restraint Analysis
- 3.5.1. Regulatory Challenges
- 3.5.2. Off-Target Effects and Safety Concerns
- 3.6. Business Environment Analysis
- 3.6.1. Porter's Five Forces Analysis
- 3.6.2. PESTLE Analysis
- 3.7. COVID-19 Analysis
Chapter 4. Product & Services Estimates & Trend Analysis
- 4.1. gRNA market: Product & Services Movement Analysis
- 4.2. Products
- 4.2.1. Products Market Estimates and Forecasts, 2018 - 2030 (USD Million)
- 4.2.2. gRNA Final Products
- 4.2.2.1. gRNA Final Products Market Estimates and Forecasts, 2018 - 2030 (USD Million)
- 4.2.3. gRNA Synthesis Products
- 4.2.3.1. gRNA Synthesis Products Market Estimates and Forecasts, 2018 - 2030 (USD Million)
- 4.2.3.2. gRNA Synthesis Kits
- 4.2.3.2.1. gRNA Synthesis Kits Market Estimates and Forecasts, 2018 - 2030 (USD Million)
- 4.2.3.3. Plasmids
- 4.2.3.3.1. Plasmids Market Estimates and Forecasts, 2018 - 2030 (USD Million)
- 4.2.3.4. Others
- 4.2.3.4.1. Others Market Estimates and Forecasts, 2018 - 2030 (USD Million)
- 4.3. Custom gRNA Synthesis Services
- 4.3.1. Custom gRNA Synthesis Services Market Estimates and Forecasts, 2018 - 2030 (USD Million)
Chapter 5. gRNA Type Estimates & Trend Analysis
- 5.1. gRNA market: gRNA Type Movement Analysis
- 5.2. Research-Use
- 5.2.1. Research-Use Market Revenue Estimates and Forecasts, 2018 - 2030 (USD Million)
- 5.3. GMP-grade
- 5.3.1. GMP-grade Market Revenue Estimates and Forecasts, 2018 - 2030 (USD Million)
Chapter 6. Application Estimates & Trend Analysis
- 6.1. gRNA market: Application Movement Analysis
- 6.2. Genome Engineering
- 6.2.1. Genome Engineering Market Revenue Estimates and Forecasts, 2018 - 2030 (USD Million)
- 6.3. Disease Model Studies
- 6.3.1. Disease Model Studies Market Revenue Estimates and Forecasts, 2018 - 2030 (USD Million)
- 6.4. Functional Genomics
- 6.4.1. Functional Genomics Market Revenue Estimates and Forecasts, 2018 - 2030 (USD Million)
- 6.5. Epigenetics
- 6.5.1. Epigenetics Market Revenue Estimates and Forecasts, 2018 - 2030 (USD Million)
- 6.6. Others
- 6.6.1. Others Market Revenue Estimates and Forecasts, 2018 - 2030 (USD Million)
Chapter 7. End-Use Estimates & Trend Analysis
- 7.1. gRNA market: End-Use Movement Analysis
- 7.2. Pharmaceutical & Biotechnology Companies
- 7.2.1. Pharmaceutical & Biotechnology Companies Market Revenue Estimates and Forecasts, 2018 - 2030 (USD Million)
- 7.3. Academic Research Institutes
- 7.3.1. Academic Research Institutes Market Revenue Estimates and Forecasts, 2018 - 2030 (USD Million)
- 7.4. CMOs & CROs
- 7.4.1. CMOs & CROs Market Revenue Estimates and Forecasts, 2018 - 2030 (USD Million)
Chapter 8. Regional Business Analysis
- 8.1. Regional Market Snapshot
- 8.2. North America
- 8.2.1. North America gRNA Market Estimates And Forecast, 2018 - 2030 (USD Million)
- 8.2.2. U.S.
- 8.2.2.1. Key Country Dynamics
- 8.2.2.2. Competitive Scenario
- 8.2.2.3. Regulatory Framework
- 8.2.2.4. Target Disease Prevalence
- 8.2.2.5. U.S. gRNA Market, 2018 - 2030 (USD Million)
- 8.2.3. Canada
- 8.2.3.1. Key Country Dynamics
- 8.2.3.2. Competitive Scenario
- 8.2.3.3. Regulatory Framework
- 8.2.3.4. Target Disease Prevalence
- 8.2.3.5. Canada gRNA Market, 2018 - 2030 (USD Million)
- 8.3. Europe
- 8.3.1. Europe gRNA Market, 2018 - 2030 (USD Million)
- 8.3.2. UK
- 8.3.2.1. Key Country Dynamics
- 8.3.2.2. Competitive Scenario
- 8.3.2.3. Regulatory Framework
- 8.3.2.4. Target Disease Prevalence
- 8.3.2.5. UK gRNA Market, 2018 - 2030 (USD Million)
- 8.3.3. Germany
- 8.3.3.1. Key Country Dynamics
- 8.3.3.2. Competitive Scenario
- 8.3.3.3. Regulatory Framework
- 8.3.3.4. Target Disease Prevalence
- 8.3.3.5. Germany gRNA Market, 2018 - 2030 (USD Million)
- 8.3.4. Spain
- 8.3.4.1. Key Country Dynamics
- 8.3.4.2. Competitive Scenario
- 8.3.4.3. Regulatory Framework
- 8.3.4.4. Target Disease Prevalence
- 8.3.4.5. Spain gRNA Market, 2018 - 2030 (USD Million)
- 8.3.5. France
- 8.3.5.1. Key Country Dynamics
- 8.3.5.2. Competitive Scenario
- 8.3.5.3. Regulatory Framework
- 8.3.5.4. Target Disease Prevalence
- 8.3.5.5. France gRNA Market, 2018 - 2030 (USD Million)
- 8.3.6. Italy
- 8.3.6.1. Key Country Dynamics
- 8.3.6.2. Competitive Scenario
- 8.3.6.3. Regulatory Framework
- 8.3.6.4. Target Disease Prevalence
- 8.3.6.5. Italy gRNA Market, 2018 - 2030 (USD Million)
- 8.3.7. Denmark
- 8.3.7.1. Key Country Dynamics
- 8.3.7.2. Competitive Scenario
- 8.3.7.3. Regulatory Framework
- 8.3.7.4. Target Disease Prevalence
- 8.3.7.5. Denmark gRNA Market, 2018 - 2030 (USD Million)
- 8.3.8. Sweden
- 8.3.8.1. Key Country Dynamics
- 8.3.8.2. Competitive Scenario
- 8.3.8.3. Regulatory Framework
- 8.3.8.4. Target Disease Prevalence
- 8.3.8.5. Sweden gRNA Market, 2018 - 2030 (USD Million)
- 8.3.9. Norway
- 8.3.9.1. Key Country Dynamics
- 8.3.9.2. Competitive Scenario
- 8.3.9.3. Regulatory Framework
- 8.3.9.4. Target Disease Prevalence
- 8.3.9.5. Norway gRNA Market, 2018 - 2030 (USD Million)
- 8.4. Asia Pacific
- 8.4.1. Asia-Pacific gRNA Market, 2018 - 2030 (USD Million)
- 8.4.2. Japan
- 8.4.2.1. Key Country Dynamics
- 8.4.2.2. Competitive Scenario
- 8.4.2.3. Regulatory Framework
- 8.4.2.4. Target Disease Prevalence
- 8.4.2.5. Japan gRNA Market, 2018 - 2030 (USD Million)
- 8.4.3. China
- 8.4.3.1. Key Country Dynamics
- 8.4.3.2. Competitive Scenario
- 8.4.3.3. Regulatory Framework
- 8.4.3.4. Target Disease Prevalence
- 8.4.3.5. China gRNA Market, 2018 - 2030 (USD Million)
- 8.4.4. India
- 8.4.4.1. Key Country Dynamics
- 8.4.4.2. Competitive Scenario
- 8.4.4.3. Regulatory Framework
- 8.4.4.4. Target Disease Prevalence
- 8.4.4.5. India gRNA Market, 2018 - 2030 (USD Million)
- 8.4.5. South Korea
- 8.4.5.1. Key Country Dynamics
- 8.4.5.2. Competitive Scenario
- 8.4.5.3. Regulatory Framework
- 8.4.5.4. Target Disease Prevalence
- 8.4.5.5. South Korea gRNA Market, 2018 - 2030 (USD Million)
- 8.4.6. Thailand
- 8.4.6.1. Key Country Dynamics
- 8.4.6.2. Competitive Scenario
- 8.4.6.3. Regulatory Framework
- 8.4.6.4. Target Disease Prevalence
- 8.4.6.5. Thailand gRNA Market, 2018 - 2030 (USD Million)
- 8.4.7. Australia
- 8.4.7.1. Key Country Dynamics
- 8.4.7.2. Competitive Scenario
- 8.4.7.3. Regulatory Framework
- 8.4.7.4. Target Disease Prevalence
- 8.4.7.5. Australia gRNA Market, 2018 - 2030 (USD Million)
- 8.5. Latin America
- 8.5.1. Latin America gRNA Market, 2018 - 2030 (USD Million)
- 8.5.2. Brazil
- 8.5.2.1. Key Country Dynamics
- 8.5.2.2. Competitive Scenario
- 8.5.2.3. Regulatory Framework
- 8.5.2.4. Target Disease Prevalence
- 8.5.2.5. Brazil gRNA Market, 2018 - 2030 (USD Million)
- 8.5.3. Mexico
- 8.5.3.1. Key Country Dynamics
- 8.5.3.2. Competitive Scenario
- 8.5.3.3. Regulatory Framework
- 8.5.3.4. Target Disease Prevalence
- 8.5.3.5. Mexico gRNA Market, 2018 - 2030 (USD Million)
- 8.5.4. Argentina
- 8.5.4.1. Key Country Dynamics
- 8.5.4.2. Competitive Scenario
- 8.5.4.3. Regulatory Framework
- 8.5.4.4. Target Disease Prevalence
- 8.5.4.5. Argentina gRNA Market, 2018 - 2030 (USD Million)
- 8.6. MEA
- 8.6.1. MEA gRNA Market, 2018 - 2030 (USD Million)
- 8.6.2. South Africa
- 8.6.2.1. Key Country Dynamics
- 8.6.2.2. Competitive Scenario
- 8.6.2.3. Regulatory Framework
- 8.6.2.4. Target Disease Prevalence
- 8.6.2.5. South Africa gRNA Market, 2018 - 2030 (USD Million)
- 8.6.3. Saudi Arabia
- 8.6.3.1. Key Country Dynamics
- 8.6.3.2. Competitive Scenario
- 8.6.3.3. Regulatory Framework
- 8.6.3.4. Target Disease Prevalence
- 8.6.3.5. Saudi Arabia gRNA Market, 2018 - 2030 (USD Million)
- 8.6.4. UAE
- 8.6.4.1. Key Country Dynamics
- 8.6.4.2. Competitive Scenario
- 8.6.4.3. Regulatory Framework
- 8.6.4.4. Target Disease Prevalence
- 8.6.4.5. UAE gRNA Market, 2018 - 2030 (USD Million)
- 8.6.5. Kuwait
- 8.6.5.1. Key Country Dynamics
- 8.6.5.2. Competitive Scenario
- 8.6.5.3. Regulatory Framework
- 8.6.5.4. Target Disease Prevalence
- 8.6.5.5. Kuwait gRNA Market, 2018 - 2030 (USD Million)
Chapter 9. Competitive Landscape
- 9.1. Company Categorization
- 9.2. Strategy Mapping
- 9.2.1. Acquisition
- 9.2.2. Product/service launch
- 9.2.3. Partnerships/Collaborations
- 9.2.4. Others
- 9.3. Market Position Analysis, 2023
- 9.4. Company Profiles
- 9.4.1. Thermo Fisher Scientififc, Inc
- 9.4.1.1. Company Overview
- 9.4.1.2. Financial Performance (Net Revenue/Sales/EBITDA/Gross Profit)
- 9.4.1.3. Product Benchmarking
- 9.4.1.4. Strategic Initiatives
- 9.4.2. Agilent Technologies, Inc.
- 9.4.2.1. Company Overview
- 9.4.2.2. Financial Performance (Net Revenue/Sales/EBITDA/Gross Profit)
- 9.4.2.3. Product Benchmarking
- 9.4.2.4. Strategic Initiatives
- 9.4.3. System Biosciences, LLC.
- 9.4.3.1. Company Overview
- 9.4.3.2. Financial Performance (Net Revenue/Sales/EBITDA/Gross Profit)
- 9.4.3.3. Product Benchmarking
- 9.4.3.4. Strategic Initiatives
- 9.4.4. Jena Bioscience GmbH
- 9.4.4.1. Company Overview
- 9.4.4.2. Financial Performance (Net Revenue/Sales/EBITDA/Gross Profit)
- 9.4.4.3. Product Benchmarking
- 9.4.4.4. Strategic Initiatives
- 9.4.5. Merck KGaA
- 9.4.5.1. Company Overview
- 9.4.5.2. Financial Performance (Net Revenue/Sales/EBITDA/Gross Profit)
- 9.4.5.3. Product Benchmarking
- 9.4.5.4. Strategic Initiatives
- 9.4.6. Azenta Life Sciences (Genewiz)
- 9.4.6.1. Company Overview
- 9.4.6.2. Product Benchmarking
- 9.4.6.3. Strategic Initiatives
- 9.4.7. Takara Bio Inc.
- 9.4.7.1. Company Overview
- 9.4.7.2. Financial Performance (Net Revenue/Sales/EBITDA/Gross Profit)
- 9.4.7.3. Product Benchmarking
- 9.4.7.4. Strategic Initiatives
- 9.4.8. Synbio Technologies
- 9.4.8.1. Company Overview
- 9.4.8.2. Financial Performance (Net Revenue/Sales/EBITDA/Gross Profit)
- 9.4.8.3. Product Benchmarking
- 9.4.8.4. Strategic Initiatives
- 9.4.9. Revvity Inc (Horizon Discovery Ltd.)
- 9.4.9.1. Company Overview
- 9.4.9.2. Financial Performance (Net Revenue/Sales/EBITDA/Gross Profit)
- 9.4.9.3. Product Benchmarking
- 9.4.9.4. Strategic Initiatives
- 9.4.10. Synthego
- 9.4.10.1. Company Overview
- 9.4.10.2. Financial Performance (Net Revenue/Sales/EBITDA/Gross Profit)
- 9.4.10.3. Product Benchmarking
- 9.4.10.4. Strategic Initiatives
- 9.4.1. Thermo Fisher Scientififc, Inc
