|
|
市場調査レポート
商品コード
1433528
電気・電子用プラスチックの市場規模、シェア、動向分析レポート:ポリマー別、用途別、地域別、セグメント予測、2024~2030年Plastics In Electrical And Electronics Market Size, Share & Trends Analysis Report By Polymer (ABS, PP), By Application (Wires & Cables, Electrical Insulation), By Region, And Segment Forecasts, 2024 - 2030 |
||||||
|
|
|||||||
カスタマイズ可能
|
|||||||


| 電気・電子用プラスチックの市場規模、シェア、動向分析レポート:ポリマー別、用途別、地域別、セグメント予測、2024~2030年 |
|
出版日: 2024年01月02日
発行: Grand View Research
ページ情報: 英文 117 Pages
納期: 2~10営業日
|

- 全表示
- 概要
- 図表
- 目次
電気・電子用プラスチックの市場の成長と動向
グランドビューリサーチ社の最新レポートによると、世界の電気・電子用プラスチックの市場規模は2030年までに532億7,000万米ドルに達すると予測され、2024年から2030年までのCAGRは5.2%で成長すると予測されています。
世界の電気・電子市場は広大かつダイナミックです。幅広い製品とサービスを包含しています。世界中のこの市場の成長は、継続的な技術の進歩、電気部品や電子機器に対する消費者の需要の高まり、都市化の進展など、複数の要因によってもたらされています。可処分所得の急増とエネルギー効率に対する需要の増加は、世界の電気・電子機器市場の成長に寄与する要因です。
5G、IoT、AI技術の出現によるエレクトロニクス産業の拡大が、電気・電子用プラスチック需要を牽引しています。さらに、世界の建築・建設業界からの需要の増加が、電気・電子業界全体のプラスチック需要を押し上げると予想されています。
市場全体のプレーヤーは、新しいポリマーの発売、ポリメリオンの拡大、合併・買収などの様々な戦略的イニシアチブの実施により、高い市場競争を維持しています。例えば、SABICは2023年5月、高流動、カスタムカラー、高強度を実現する新しいガラス繊維強化グレードを発表し、高熱ULTEM樹脂ポートフォリオの拡大を発表しました。このポリマーは、光ファイバーや電気コネクターなどの電子部品に適しています。
同市場では、バリューチェーンが直線経済から循環経済へと転換しつつあります。市場の主要プレーヤーは、より持続可能なソリューションを手に入れ、将来の原油依存を最小限に抑えるために、循環型経済への移行を進めています。この動向により、植物油などの再生可能原料や、プラスチックを生産するためのプラスチック廃棄物の需要が近年増加しています。
世界中でデータセンターの数が増加しているため、電子機器、電気コネクター、ノートパソコン、デスクトップパソコン、印刷機器、サーバーラックなど、プラスチックから開発された機器の需要が増加しています。ポリカーボネートは、耐久性、柔軟性、軽量性に優れたツインウォール、ウォールマウントエンクロージャー、通路封じ込めパネル、冷却システムハウジングなどの開発につながるため、ITサーバー業界全体で利用されている主要なプラスチックです。
さらに、クラウド・コンピューティングの流行に起因するデータ・サーバーの需要の急増は、Facebook, Inc.、Amazon.com, Inc.、Twitter、Microsoft Corporationなどの企業にデータ・ストレージ用のサーバー・システムの導入を促しています。このため、世界のITサーバー産業で使用されるポリカーボネート(PC)やその他のプラスチックの需要が高まっています。
電気・電子用プラスチックの市場レポートハイライト
- 5G、IoT、AI技術の出現によるエレクトロニクス産業の拡大が、電気・電子分野のプラスチック需要を牽引しています。さらに、世界中の建築・建設業界からの需要の増加が、電気・電子業界全体のプラスチック需要を押し上げると予測されています。
- ポリマーをベースとするPVCは、絶縁、ケーブル被覆、電線被覆に一般的に使用されています。耐火性と優れた電気特性により、電気システムの安全性と信頼性を確保するための理想的な材料となっています。
- スマートフォン、タブレット、コンピューターは、通信、エンターテインメント、生産性機能を提供する家電製品として広く普及しています。診断、モニタリング、治療システムなどの医療機器は、正確で信頼性の高い性能を実現するために電子部品に依存しています。
- 中国、インド、シンガポールなどの国々では、医療費の増加により高品質の医療機器に対する需要が増加しており、医療機器の大半はポリマー、PCB、電気ケーシングなどを必要とするため、市場の需要が再び増加しています。
目次
第1章 調査手法と範囲
第2章 エグゼクティブサマリー
第3章 電気・電子用プラスチックの市場の変数、動向、範囲
- 市場系統の見通し
- 世界のプラスチック市場の見通し
- 世界の電気・電子市場の見通し
- 業界のバリューチェーン分析
- 原材料の動向
- 規制の枠組み
- 市場力学
- 市場促進要因分析
- 市場抑制要因分析
- 業界の課題
- 業界の機会
- 電気・電子用プラスチックの市場-事業環境分析
- 業界分析- ポーターのファイブフォース分析
- 業界分析- マクロ経済要因分析
- 東欧の業界の地政学的影響の概要
- COVID-19が電気・電子用プラスチックの市場に与える影響
第4章 電気・電子用プラスチックの市場:ポリマーの推定・動向分析
- ポリマーの変動分析と市場シェア、2023年と2030年
- ポリマー別、2018年から2030年まで
- アクリロニトリルブタジエンスチレン(ABS)
- ポリプロピレン(PP)
- ポリウレタン(PU)
- ポリ塩化ビニル(PVC)
- ポリエチレン(PE)
- ポリカーボネート(PC)
- ポリメタクリル酸メチル(PMMA)
- ポリアミド(PA)
- その他
第5章 電気・電子用プラスチックの市場:用途推定・動向分析
- 用途の変動分析と市場シェア、2023年と2030年
- 用途別、2018年から2030年まで
- ワイヤーとケーブル
- 電気塗装
- プリント基板(PCB)
- 電子デバイス
- 電気コネクタ
- その他
第6章 電気・電子用プラスチックの市場:地域推定・動向分析
- 地域変動分析と市場シェア、2023年と2030年
- 北米
- 北米化学市場の推定・予測、2018年から2030年
- 米国
- カナダ
- メキシコ
- 欧州
- 欧州の化学市場の推定・予測、2018~2030年
- ドイツ
- 英国
- イタリア
- フランス
- アジア太平洋地域
- アジア太平洋地域の化学市場の推定・予測、2018年から2030年
- 中国
- インド
- 日本
- 東南アジア
- 中南米
- 中南米の化学市場の推定・予測、2018年から2030年
- ブラジル
- アルゼンチン
- 中東とアフリカ
- 中東およびアフリカの化学市場の推定・予測、2018年から2030年
- サウジアラビア
- アラブ首長国連邦(UAE)
- 南アフリカ
第7章 電気・電子用プラスチックの市場-競合情勢
- 主要市場参入企業による最近の動向と影響分析
- 企業の分類
- 企業の市場シェア/地位分析、2023年
- 企業ヒートマップ分析
- 戦略マッピング
- 拡大
- 合併と買収
- パートナーシップとコラボレーション
- 新製品の発売
- 研究開発
- 企業プロファイル
- BASF SE
- Ensinger, Inc.
- Covestro AG
- TORAY INDUSTRIES, INC.
- Radici Partecipazioni SpA
- RTP Company
- LOTTE Chemical Corporation
- Trinseo SA
- SABIC
- Evonik Industries AG
- Mitsubishi Chemical Group Corporation
- Arkema
- LyondellBasell Industries Holdings BV
- Celanese Corporation
- Exxon Mobil Corporation
- INEOS Group
- CHIMEI
List of Tables
- Table 1 List of abbreviation
- Table 2 Plastics in Electrical and Electronics market (Kilotons) 2018 - 2030 (USD Billion)
- Table 3 Global market estimates and forecasts by region, 2018 - 2030 (Kilotons)
- Table 4 Global market estimates and forecasts by region, 2018 - 2030 (USD Million)
- Table 5 Global market estimates and forecasts by polymers, 2018 - 2030 (Kilotons)
- Table 6 Global market estimates and forecasts by polymers, 2018 - 2030 (USD Billion)
- Table 7 Global market estimates and forecasts by application, 2018 - 2030 (Kilotons)
- Table 8 Global market estimates and forecasts by application, 2018 - 2030 (USD Billion)
- Table 9 Global market estimates and forecasts by region, 2018 - 2030 (Kilotons)
- Table 10 Global market estimates and forecasts by region, 2018 - 2030 (USD Billion)
- Table 11 North America Plastics in Electrical and Electronics market by polymers, 2018 - 2030 (Kilotons)
- Table 12 North America Plastics in Electrical and Electronics market by application, 2018 - 2030 (USD Billion)
- Table 13 U.S. Plastics in Electrical and Electronics market by polymers, 2018 - 2030 (Kilotons)
- Table 14 U.S. Plastics in Electrical and Electronics market by application, 2018 - 2030 (USD Billion)
- Table 15 Canada Plastics in Electrical and Electronics market by polymers, 2018 - 2030 (Kilotons)
- Table 16 Canada Plastics in Electrical and Electronics market by application, 2018 - 2030 (USD Billion)
- Table 17 Mexico Plastics in Electrical and Electronics market by polymers, 2018 - 2030 (Kilotons)
- Table 18 Mexico Plastics in Electrical and Electronics market by application, 2018 - 2030 (USD Billion)
- Table 19 Europe Plastics in Electrical and Electronics market by polymers, 2018 - 2030 (Kilotons)
- Table 20 Europe Plastics in Electrical and Electronics market by application, 2018 - 2030 (USD Billion)
- Table 21 Germany Plastics in Electrical and Electronics market by polymers, 2018 - 2030 (Kilotons)
- Table 22 Germany Plastics in Electrical and Electronics market by application, 2018 - 2030 (USD Billion)
- Table 23 UK Plastics in Electrical and Electronics market by polymers, 2018 - 2030 (Kilotons)
- Table 24 UK Plastics in Electrical and Electronics market by application, 2018 - 2030 (USD Billion)
- Table 25 Italy Plastics in Electrical and Electronics market by polymers, 2018 - 2030 (Kilotons)
- Table 26 Italy Plastics in Electrical and Electronics market by application, 2018 - 2030 (USD Billion)
- Table 27 France Plastics in Electrical and Electronics market by polymers, 2018 - 2030 (Kilotons)
- Table 28 France Plastics in Electrical and Electronics market by application, 2018 - 2030 (USD Billion)
- Table 29 Asia Pacific Plastics in Electrical and Electronics market by polymers, 2018 - 2030 (Kilotons)
- Table 30 Asia Pacific Plastics in Electrical and Electronics market by application, 2018 - 2030 (USD Billion)
- Table 31 China Plastics in Electrical and Electronics market by polymers, 2018 - 2030 (Kilotons)
- Table 32 China Plastics in Electrical and Electronics market by application, 2018 - 2030 (USD Billion)
- Table 33 India Plastics in Electrical and Electronics market by polymers, 2018 - 2030 (Kilotons)
- Table 34 India Plastics in Electrical and Electronics market by application, 2018 - 2030 (USD Billion)
- Table 35 Japan Plastics in Electrical and Electronics market by polymers, 2018 - 2030 (Kilotons)
- Table 36 Japan Plastics in Electrical and Electronics market by application, 2018 - 2030 (USD Billion)
- Table 37 Southeast Asia Plastics in Electrical and Electronics market by polymers, 2018 - 2030 (Kilotons)
- Table 38 Southeast Asia Plastics in Electrical and Electronics market by application, 2018 - 2030 (USD Billion)
- Table 39 Central & South America Plastics in Electrical and Electronics market by polymers, 2018 - 2030 (Kilotons)
- Table 40 Central & South America Plastics in Electrical and Electronics market by application, 2018 - 2030 (USD Billion)
- Table 41 Brazil Plastics in Electrical and Electronics market by polymers, 2018 - 2030 (Kilotons)
- Table 42 Brazil Plastics in Electrical and Electronics market by application, 2018 - 2030 (USD Billion)
- Table 43 Argentina Plastics in Electrical and Electronics market by polymers, 2018 - 2030 (Kilotons)
- Table 44 Argentina Plastics in Electrical and Electronics market by application, 2018 - 2030 (USD Billion)
- Table 45 Middle East & Africa Plastics in Electrical and Electronics market by polymers, 2018 - 2030 (Kilotons)
- Table 46 Middle East & Africa Plastics in Electrical and Electronics market by application, 2018 - 2030 (USD Billion)
- Table 47 Saudi Arabia Plastics in Electrical and Electronics market by polymers, 2018 - 2030 (Kilotons)
- Table 48 Saudi Arabia Plastics in Electrical and Electronics market by application, 2018 - 2030 (USD Billion)
- Table 49 United Arab Emirates (UAE) Plastics in Electrical and Electronics market by polymers, 2018 - 2030 (Kilotons)
- Table 50 United Arab Emirates (UAE) Plastics in Electrical and Electronics market by application, 2018 - 2030 (USD Billion)
- Table 51 South Africa Plastics in Electrical and Electronics market by polymers, 2018 - 2030 (Kilotons)
- Table 52 South Africa Plastics in Electrical and Electronics market by application, 2018 - 2030 (USD Billion)
List of Figures
- Fig. 1 Market research process
- Fig. 2 Data triangulation techniques
- Fig. 3 Primary research pattern
- Fig. 4 Market research approaches
- Fig. 5 Information Procurement
- Fig. 6 Market Formulation and Validation
- Fig. 7 Data Validating & Publishing
- Fig. 8 Market Segmentation & Scope
- Fig. 9 Plastics in Electrical and Electronics Market Snapshot
- Fig. 10 Polymer Segment Snapshot, 2023 (USD Million)
- Fig. 11 Application Segment Snapshot, 2023 (USD Million)
- Fig. 12 Competitive Landscape Snapshot
- Fig. 13 Parent market outlook
- Fig. 14 Plastics in Electrical and Electronics Market Value, 2023 (USD Million)
- Fig. 15 Plastics in Electrical and Electronics Market - Value Chain Analysis
- Fig. 16 Plastics in Electrical and Electronics Market - Market Dynamics
- Fig. 17 Plastics in Electrical and Electronics Market - PORTER's Analysis
- Fig. 18 Plastics in Electrical and Electronics Market - PESTEL Analysis
- Fig. 19 Plastics in Electrical and Electronics Market Estimates & Forecasts, By Polymers: Key Takeaways
- Fig. 20 Plastics in Electrical and Electronics Market Share, By Polymers, 2022 & 2030
- Fig. 21 ABS Market Estimates & Forecasts, 2018 - 2030 (Kilotons) (USD Million)
- Fig. 22 PP Market Estimates & Forecasts, 2018 - 2030 (Kilotons) (USD Million)
- Fig. 23 PU Market Estimates & Forecasts, 2018 - 2030 (Kilotons) (USD Million)
- Fig. 24 PVC Market Estimates & Forecasts, 2018 - 2030 (Kilotons) (USD Million)
- Fig. 25 PE Market Estimates & Forecasts, 2018 - 2030 (Kilotons) (USD Million)
- Fig. 26 PC Market Estimates & Forecasts, 2018 - 2030 (Kilotons) (USD Million)
- Fig. 27 PMMA Market Estimates & Forecasts, 2018 - 2030 (Kilotons) (USD Million)
- Fig. 28 PA Market Estimates & Forecasts, 2018 - 2030 (Kilotons) (USD Million)
- Fig. 29 Others Market Estimates & Forecasts, 2018 - 2030 (Kilotons) (USD Million)
- Fig. 30 Plastics in Electrical and Electronics Market Estimates & Forecasts, By Application: Key Takeaways
- Fig. 31 Plastics in Electrical and Electronics Market Share, By Application, 2023 & 2030
- Fig. 32 Plastics in Electrical and Electronics Market Estimates & Forecasts, in wires & cables, 2018 - 2030 (Kilotons) (USD Million)
- Fig. 33 Plastics in Electrical and Electronics Market Estimates & Forecasts, in electrical insulation, 2018 - 2030 (Kilotons) (USD Million)
- Fig. 34 Plastics in Electrical and Electronics Market Estimates & Forecasts, in printed circuit boards (PCBs), 2018 - 2030 (Kilotons) (USD Million)
- Fig. 35 Plastics in Electrical and Electronics Market Estimates & Forecasts, in electronic devices, 2018 - 2030 (Kilotons) (USD Million)
- Fig. 36 Plastics in Electrical and Electronics Market Estimates & Forecasts, in electrical connectors, 2018 - 2030 (Kilotons) (USD Million)
- Fig. 37 Plastics in Electrical and Electronics Market Estimates & Forecasts, in others, 2018 - 2030 (Kilotons) (USD Million)
- Fig. 38 Plastics in Electrical and Electronics Market Revenue, By Region, 2023 & 2030 (USD Million)
- Fig. 39 North America Plastics in Electrical and Electronics Market Estimates & Forecasts, 2018 - 2030 (Kilotons) (USD Million)
- Fig. 40 U.S. Plastics in Electrical and Electronics Market Estimates & Forecasts, 2018 - 2030 (Kilotons) (USD Million)
- Fig. 41 Canada Plastics in Electrical and Electronics Market Estimates & Forecasts, 2018 - 2030 (Kilotons) (USD Million)
- Fig. 42 Mexico Plastics in Electrical and Electronics Market Estimates & Forecasts, 2018 - 2030 (Kilotons) (USD Million)
- Fig. 43 Europe Plastics in Electrical and Electronics Market Estimates & Forecasts, 2018 - 2030 (Kilotons) (USD Million)
- Fig. 44 Germany Plastics in Electrical and Electronics Market Estimates & Forecasts, 2018 - 2030 (Kilotons) (USD Million)
- Fig. 45 UK Plastics in Electrical and Electronics Market Estimates & Forecasts, 2018 - 2030 (Kilotons) (USD Million)
- Fig. 46 Italy Plastics in Electrical and Electronics Market Estimates & Forecasts, 2018 - 2030 (Kilotons) (USD Million)
- Fig. 47 France Plastics in Electrical and Electronics Market Estimates & Forecasts, 2018 - 2030 (Kilotons) (USD Million)
- Fig. 48 Asia Pacific Plastics in Electrical and Electronics Market Estimates & Forecasts, 2018 - 2030 (Kilotons) (USD Million)
- Fig. 49 China Plastics in Electrical and Electronics Market Estimates & Forecasts, 2018 - 2030 (Kilotons) (USD Million)
- Fig. 50 India Plastics in Electrical and Electronics Market Estimates & Forecasts, 2018 - 2030 (Kilotons) (USD Million)
- Fig. 51 Japan Plastics in Electrical and Electronics Market Estimates & Forecasts, 2018 - 2030 (Kilotons) (USD Million)
- Fig. 52 Southeast Asia Plastics in Electrical and Electronics Market Estimates & Forecasts, 2018 - 2030 (Kilotons) (USD Million)
- Fig. 53 Central & South America Plastics in Electrical and Electronics Market Estimates & Forecasts, 2018 - 2030 (Kilotons) (USD Million)
- Fig. 54 Brazil Plastics in Electrical and Electronics Market Estimates & Forecasts, 2018 - 2030 (Kilotons) (USD Million)
- Fig. 55 Argentina Plastics in Electrical and Electronics Market Estimates & Forecasts, 2018 - 2030 (Kilotons) (USD Million)
- Fig. 56 Middle East & Africa Plastics in Electrical and Electronics Market Estimates & Forecasts, 2018 - 2030 (Kilotons) (USD Million)
- Fig. 57 Saudi Arabia Plastics in Electrical and Electronics Market Estimates & Forecasts, 2018 - 2030 (Kilotons) (USD Million)
- Fig. 58 United Arab Emirates (UAE) Plastics in Electrical and Electronics Market Estimates & Forecasts, 2018 - 2030 (Kilotons) (USD Million)
- Fig. 59 South Africa Plastics in Electrical and Electronics Market Estimates & Forecasts, 2018 - 2030 (Kilotons) (USD Million)
- Fig. 60 Key Company Categorization
- Fig. 61 Company Market Positioning
- Fig. 62 Key Company Market Share Analysis, 2023
- Fig. 63 Strategy Mapping
Plastics In Electrical And Electronics Market Growth & Trends:
The global plastics in electrical and electronics market size is anticipated to reach USD 53.27 billion by 2030 and it is projected to grow at a CAGR of 5.2% from 2024 to 2030, according to a new report by Grand View Research, Inc.
The global electrical & electronics market is vast and dynamic. It encompasses a wide range of products and services. The growth of this market across the world is driven by multiple factors, including ongoing technological advancements, rising consumer demand for electrical components and electronic devices, and increasing urbanization. Surging disposable income and increasing demand for energy efficiency are factors contributing to the growth of electrical & electronics market worldwide.
An expansion of electronics industry, driven by the emergence of 5G, IoT, and AI technologies, has driven the demand for plastics in electrical & electronics market. Moreover, increasing demand from building & construction industry globally is anticipated to boost demand for plastics across electrical & electronics industry.
Players across the market maintain a high market competition with the implementation of various strategic initiatives such as new Polymer launch, Polymerion expansion, merger & acquisitions, among others. For instance, in may 2023, SABIC announced its expansion of high-heat ULTEM resin portfolio by introducing new glass fibre-reinforced grades that would deliver high flow, custom colour ability, and high strength. This Polymer is well suited for electronic components such as fibre optics and electrical connectors.
The market is witnessing a transformation of the value chain from a linear economy into a circular one. Major players in the market are transitioning to a circular economy to obtain more sustainable solutions and minimize their dependency on crude oil in the future. This trend has led to a rise in the demand for renewable raw materials such as vegetable oil, and plastic waste to produce plastics in recent years.
The rising number of data centers across the world has increased the demand for electronic devices, electrical connectors, laptops, desktops, printing devices, server racks, and other such equipment that are developed from plastics. Polycarbonate is a prime plastic utilized across the IT server industry as it leads to the development of highly durable, flexible, and lightweight twin walls, wall-mounted enclosures, aisle containment panels, cooling system housings, etc.
Moreover, the surging demand for data servers owing to the prevailing trend of cloud computing has led companies such as Facebook, Inc., Amazon.com, Inc., Twitter, and Microsoft Corporation to install sever systems for data storage. This has contributed to the demand for polycarbonate (PC) and other plastics for use in the global IT server industry.
Plastics In Electrical And Electronics Market Report Highlights:
- The expansion of the electronics industry, driven by the emergence of 5G, IoT, and AI technologies, has driven the demand for plastics in electrical & electronics market. Moreover, increasing demand from building & construction industry across the globe is anticipated to boost the demand for plastics across electrical & electronics industry
- Based on polymer, PVC is commonly used for insulation, cable sheathing, and wire coatings. Its fire resistance and good electrical properties make it an ideal material for ensuring safety and reliability in electrical systems
- Smartphones, tablets, and computers are ubiquitous in consumer electronics, providing communication, entertainment, and productivity functions. Medical devices such as diagnostic, monitoring, and treatment systems rely on electronic components for accurate and reliable performance
- The demand for high-quality medical devices across countries such as China, India, and Singapore, is increasing on account of the rising healthcare expenditure which again increases in demand for the market as majority of the medical devices requires polymers, PCBs, electrical casings and others
Table of Contents
Chapter 1. Methodology and Scope
- 1.1. Market Segmentation & Scope
- 1.2. Market Definition
- 1.3. Information Procurement
- 1.3.1. Purchased Database
- 1.3.2. GVR's Internal Database
- 1.3.3. Secondary Sources & Third-Party Perspectives
- 1.3.4. Primary Research
- 1.4. Information Analysis
- 1.4.1. Data Analysis Models
- 1.5. Market Formulation & Data Visualization
- 1.6. Data Validation & Publishing
Chapter 2. Executive Summary
- 2.1. Market Snapshot, 2023
- 2.2. Polymer Segment Snapshot, 2023
- 2.3. Application Segment Snapshot, 2023
- 2.4. Competitive Landscape Snapshot
Chapter 3. Plastics in Electrical and Electronics Market Variables, Trends & Scope
- 3.1. Market Lineage Outlook
- 3.1.1. Global Plastics Market Outlook
- 3.1.2. Global Electrical & Electronics Market Outlook
- 3.2. Industry Value Chain Analysis
- 3.2.1. Raw Material Trends
- 3.3. Regulatory Framework
- 3.4. Market Dynamics
- 3.4.1. Market Driver Analysis
- 3.4.2. Market Restraint Analysis
- 3.4.3. Industry Challenges
- 3.4.4. Industry Opportunities
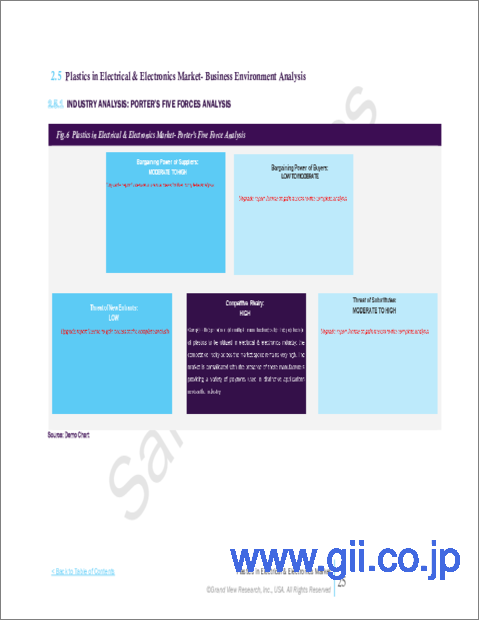
- 3.5. Plastics in Electrical and Electronics Market- Business Environment Analysis
- 3.5.1. Industry Analysis- Porter's Five Force Analysis
- 3.5.2. Industry Analysis- Macroeconomic Factors Analysis
- 3.6. East European Geopolitical Implication of the Industry Overview
- 3.7. Impact of COVID-19 on Plastics in Electrical and Electronics Market
Chapter 4. Plastics in Electrical and Electronics Market: Polymers Estimates & Trend Analysis
- 4.1. Polymers Movement Analysis & Market Share, 2023 & 2030
- 4.2. Plastics in Electrical and Electronics Market Estimates & Forecast, By Polymers, 2018 to 2030 (Kilotons) (USD Million)
- 4.3. Acrylonitrile butadiene styrene (ABS)
- 4.3.1. Plastics in Electrical and Electronics Market, Estimation and Forecast, by ABS, 2018 - 2030 (Kilotons) (USD Million)
- 4.4. Polypropylene (PP)
- 4.4.1. Plastics in Electrical and Electronics Market, Estimation and Forecast, by PP, 2018 - 2030 (Kilotons) (USD Million)
- 4.5. Polyurethane (PU)
- 4.5.1. Plastics in Electrical and Electronics Market, Estimation and Forecast, by PU, 2018 - 2030 (Kilotons) (USD Million)
- 4.6. Polyvinyl Chloride (PVC)
- 4.6.1. Plastics in Electrical and Electronics Market, Estimation and Forecast, by PVC, 2018 - 2030 (Kilotons) (USD Million)
- 4.7. Polyethylene (PE)
- 4.7.1. Plastics in Electrical and Electronics Market, Estimation and Forecast, by PE, 2018 - 2030 (Kilotons) (USD Million)
- 4.8. Polycarbonate (PC)
- 4.8.1. Plastics in Electrical and Electronics Market, Estimation and Forecast, by PC, 2018 - 2030 (Kilotons) (USD Million)
- 4.9. Polymethyl Methacrylate (PMMA)
- 4.9.1. Plastics in Electrical and Electronics Market, Estimation and Forecast, by PMMA, 2018 - 2030 (Kilotons) (USD Million)
- 4.10. Polyamide (PA)
- 4.10.1. Plastics in Electrical and Electronics Market, Estimation and Forecast, by PA, 2018 - 2030 (Kilotons) (USD Million)
- 4.11. Others
- 4.11.1. Plastics in Electrical and Electronics Market, Estimation and Forecast, by Others, 2018 - 2030 (Kilotons) (USD Million)
Chapter 5. Plastics in Electrical and Electronics Market: Application Estimates & Trend Analysis
- 5.1. Application Movement Analysis & Market Share, 2023 & 2030
- 5.2. Plastics in Electrical and Electronics Market Estimates & Forecast, By Application, 2018 to 2030 (Kilotons) (USD Million)
- 5.3. Wires & cables
- 5.3.1. Plastics in Electrical and Electronics Market, Estimation and Forecast, by Wires & cables, 2018 - 2030 (Kilotons) (USD Million)
- 5.4. Electrical coating
- 5.4.1. Plastics in Electrical and Electronics Market, Estimation and Forecast, by electrical coating, 2018 - 2030 (Kilotons) (USD Million)
- 5.5. Printed circuit board (PCB)
- 5.5.1. Plastics in Electrical and Electronics Market, Estimation and Forecast, by PCB, 2018 - 2030 (Kilotons) (USD Million)
- 5.6. Electronic devices
- 5.6.1. Plastics in Electrical and Electronics Market, Estimation and Forecast, by electronic devices, 2018 - 2030 (Kilotons) (USD Million)
- 5.7. Electrical connectors
- 5.7.1. Plastics in Electrical and Electronics Market, Estimation and Forecast, by electrical connectors, 2018 - 2030 (Kilotons) (USD Million)
- 5.8. Others
- 5.8.1. Plastics in Electrical and Electronics Market, Estimation and Forecast, by others, 2018 - 2030 (Kilotons) (USD Million)
Chapter 6. Plastics in Electrical and Electronics Market: Regional Estimates & Trend Analysis
- 6.1. Regional Movement Analysis & Market Share, 2023 & 2030
- 6.2. North America
- 6.2.1. North America Chemical Market Estimates & Forecast, 2018 - 2030 (Kilotons) (USD Million)
- 6.2.2. U.S.
- 6.2.2.1. Key country dynamics
- 6.2.2.2. U.S. Plastics in Electrical and Electronics market estimates & forecast, 2018 - 2030 (Kilotons) (USD Million)
- 6.2.3. Canada
- 6.2.3.1. Key country dynamics
- 6.2.3.2. Canada Plastics in Electrical and Electronics market estimates & forecast, 2018 - 2030 (Kilotons) (USD Million)
- 6.2.4. Mexico
- 6.2.4.1. Key country dynamics
- 6.2.4.2. Mexico Plastics in Electrical and Electronics market estimates & forecast, 2018 - 2030 (Kilotons) (USD Million)
- 6.3. Europe
- 6.3.1. Europe Chemical Market Estimates & Forecast, 2018 - 2030 (Kilotons) (USD Million)
- 6.3.2. Germany
- 6.3.2.1. Key country dynamics
- 6.3.2.2. Germany Plastics in Electrical and Electronics market estimates & forecast, 2018 - 2030 (Kilotons) (USD Million)
- 6.3.3. UK
- 6.3.3.1. Key country dynamics
- 6.3.3.2. UK Plastics in Electrical and Electronics market estimates & forecast, 2018 - 2030 (Kilotons) (USD Million)
- 6.3.4. Italy
- 6.3.4.1. Key country dynamics
- 6.3.4.2. Italy Plastics in Electrical and Electronics market estimates & forecast, 2018 - 2030 (Kilotons) (USD Million)
- 6.3.5. France
- 6.3.5.1. Key country dynamics
- 6.3.5.2. France Plastics in Electrical and Electronics market estimates & forecast, 2018 - 2030 (Kilotons) (USD Million)
- 6.4. Asia Pacific
- 6.4.1. Asia Pacific Chemical Market Estimates & Forecast, 2018 - 2030 (Kilotons) (USD Million)
- 6.4.2. China
- 6.4.2.1. Key country dynamics
- 6.4.2.2. China Plastics in Electrical and Electronics market estimates & forecast, 2018 - 2030 (Kilotons) (USD Million)
- 6.4.3. India
- 6.4.3.1. Key country dynamics
- 6.4.3.2. India Plastics in Electrical and Electronics market estimates & forecast, 2018 - 2030 (Kilotons) (USD Million)
- 6.4.4. Japan
- 6.4.4.1. Key country dynamics
- 6.4.4.2. Japan Plastics in Electrical and Electronics market estimates & forecast, 2018 - 2030 (Kilotons) (USD Million)
- 6.4.5. Southeast Asia
- 6.4.5.1. Key country dynamics
- 6.4.5.2. Southeast Asia Plastics in Electrical and Electronics market estimates & forecast, 2018 - 2030 (Kilotons) (USD Million)
- 6.5. Central & South America
- 6.5.1. Central & South America Chemical Market Estimates & Forecast, 2018 - 2030 (Kilotons) (USD Million)
- 6.5.2. Brazil
- 6.5.2.1. Key country dynamics
- 6.5.2.2. Brazil Plastics in Electrical and Electronics market estimates & forecast, 2018 - 2030 (Kilotons) (USD Million)
- 6.5.3. Argentina
- 6.5.3.1. Key country dynamics
- 6.5.3.2. Argentina Plastics in Electrical and Electronics market estimates & forecast, 2018 - 2030 (Kilotons) (USD Million)
- 6.6. Middle East & Africa
- 6.6.1. Middles East & Africa Chemical Market Estimates & Forecast, 2018 - 2030 (Kilotons) (USD Million)
- 6.6.2. Saudi Arabia
- 6.6.2.1. Key country dynamics
- 6.6.2.2. Saudi Arabia Plastics in Electrical and Electronics market estimates & forecast, 2018 - 2030 (Kilotons) (USD Million)
- 6.6.3. United Arab Emirates (UAE)
- 6.6.3.1. Key country dynamics
- 6.6.3.2. UAE Plastics in Electrical and Electronics market estimates & forecast, 2018 - 2030 (Kilotons) (USD Million)
- 6.6.4. South Africa
- 6.6.4.1. Key country dynamics
- 6.6.4.2. South Africa Plastics in Electrical and Electronics market estimates & forecast, 2018 - 2030 (Kilotons) (USD Million)
Chapter 7. Plastics in Electrical and Electronics Market - Competitive Landscape
- 7.1. Recent Developments & Impact Analysis, By Key Market Participants
- 7.2. Company Categorization
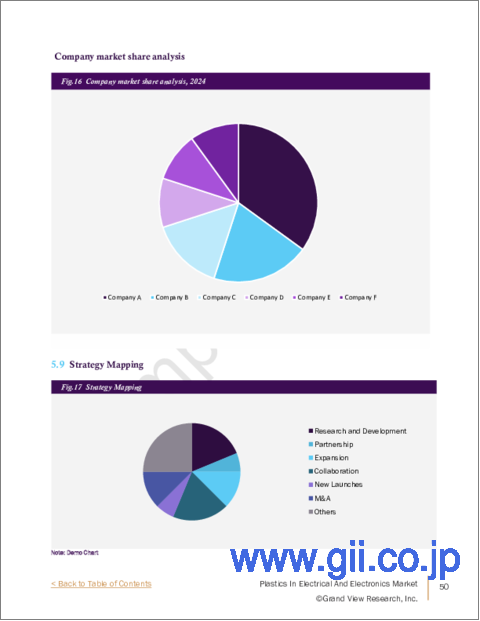
- 7.3. Company Market Share/Position Analysis, 2023
- 7.4. Company Heat Map Analysis
- 7.5. Strategy Mapping
- 7.5.1. Expansion
- 7.5.2. Mergers & Acquisition
- 7.5.3. Partnerships & Collaborations
- 7.5.4. New Product Launches
- 7.5.5. Research And Development
- 7.6. Company Profiles
- 7.6.1. BASF SE
- 7.6.1.1. Participant's overview
- 7.6.1.2. Financial performance
- 7.6.1.3. Product benchmarking
- 7.6.1.4. Recent developments
- 7.6.2. Ensinger, Inc.
- 7.6.2.1. Participant's overview
- 7.6.2.2. Financial performance
- 7.6.2.3. Product benchmarking
- 7.6.2.4. Recent developments
- 7.6.3. Covestro AG
- 7.6.3.1. Participant's overview
- 7.6.3.2. Financial performance
- 7.6.3.3. Product benchmarking
- 7.6.3.4. Recent developments
- 7.6.4. TORAY INDUSTRIES, INC.
- 7.6.4.1. Participant's overview
- 7.6.4.2. Financial performance
- 7.6.4.3. Product benchmarking
- 7.6.4.4. Recent developments
- 7.6.5. Radici Partecipazioni SpA
- 7.6.5.1. Participant's overview
- 7.6.5.2. Financial performance
- 7.6.5.3. Product benchmarking
- 7.6.5.4. Recent developments
- 7.6.6. RTP Company
- 7.6.6.1. Participant's overview
- 7.6.6.2. Financial performance
- 7.6.6.3. Product benchmarking
- 7.6.6.4. Recent developments
- 7.6.7. LOTTE Chemical Corporation
- 7.6.7.1. Participant's overview
- 7.6.7.2. Financial performance
- 7.6.7.3. Product benchmarking
- 7.6.7.4. Recent developments
- 7.6.8. Trinseo S.A.
- 7.6.8.1. Participant's overview
- 7.6.8.2. Financial performance
- 7.6.8.3. Product benchmarking
- 7.6.8.4. Recent developments
- 7.6.9. SABIC
- 7.6.9.1. Participant's overview
- 7.6.9.2. Financial performance
- 7.6.9.3. Product benchmarking
- 7.6.9.4. Recent developments
- 7.6.10. Evonik Industries AG
- 7.6.10.1. Participant's overview
- 7.6.10.2. Financial performance
- 7.6.10.3. Product benchmarking
- 7.6.10.4. Recent developments
- 7.6.11. Mitsubishi Chemical Group Corporation
- 7.6.11.1. Participant's overview
- 7.6.11.2. Financial performance
- 7.6.11.3. Product benchmarking
- 7.6.11.4. Recent developments
- 7.6.12. Arkema
- 7.6.12.1. Participant's overview
- 7.6.12.2. Financial performance
- 7.6.12.3. Product benchmarking
- 7.6.12.4. Recent developments
- 7.6.13. LyondellBasell Industries Holdings B.V.
- 7.6.13.1. Participant's overview
- 7.6.13.2. Financial performance
- 7.6.13.3. Product benchmarking
- 7.6.13.4. Recent developments
- 7.6.14. Celanese Corporation
- 7.6.14.1. Participant's overview
- 7.6.14.2. Financial performance
- 7.6.14.3. Product benchmarking
- 7.6.14.4. Recent developments
- 7.6.15. Exxon Mobil Corporation
- 7.6.15.1. Participant's overview
- 7.6.15.2. Financial performance
- 7.6.15.3. Product benchmarking
- 7.6.15.4. Recent developments
- 7.6.16. INEOS Group
- 7.6.16.1. Participant's overview
- 7.6.16.2. Financial performance
- 7.6.16.3. Product benchmarking
- 7.6.16.4. Recent developments
- 7.6.17. CHIMEI
- 7.6.17.1. Participant's overview
- 7.6.17.2. Financial performance
- 7.6.17.3. Product benchmarking
- 7.6.17.4. Recent developments
- 7.6.1. BASF SE
