|
|
市場調査レポート
商品コード
1405900
米国のアロマディフューザー市場規模、シェア、動向分析レポート:用途別、製品別、流通チャネル別、セグメント別予測、2024-2030年U.S. Aromatherapy Diffusers Market Size, Share & Trends Analysis Report By Application (Spa & Relaxation, Residential), By Product (Ultrasonic, Nebulizers, Evaporative), By Distribution Channel (Retailers, E-commerce), & Segment Forecasts, 2024-2030 |
||||||
|
|
|||||||
|
● お客様のご希望に応じて、既存データの加工や未掲載情報(例:国別セグメント)の追加などの対応が可能です。 詳細はお問い合わせください。 |
|||||||


| 米国のアロマディフューザー市場規模、シェア、動向分析レポート:用途別、製品別、流通チャネル別、セグメント別予測、2024-2030年 |
|
出版日: 2023年12月27日
発行: Grand View Research
ページ情報: 英文 134 Pages
納期: 2~10営業日
|
- 全表示
- 概要
- 図表
- 目次
米国のアロマディフューザー市場の成長と動向:
Grand View Research, Inc.の最新レポートによると、米国のアロマディフューザー市場は2024年から2030年にかけてCAGR 8.7%を記録し、2030年には7億6,240万米ドルに達すると予測されています。
国内のオフィスやホテル数の増加が、アロマディフューザーの大きな需要につながっています。スパでの製品採用の増加は、顧客の全体的なウェルネス体験を強化する幅広い動きを象徴しています。エッセンシャルオイルを空気中に拡散させるように設計されたこれらの装置は、単なる香りにとどまらないさまざまなメリットを提供するため、スパ環境に不可欠なものとなっています。こうした要因によって、予測期間中の市場成長は拡大すると予想されます。さらに、国内ではミレニアル世代を中心に、代替医療としてアロマセラピーを利用する傾向が強まっています。
こうした癒し療法の動向の変化を受けて、主要企業は新たな取り組みや新製品の開発に取り組んでいます。米国国勢調査局によると、国内のミレニアル世代の人口は2022年に7,220万人となり、同年のベビーブーマー世代の人口を上回った。このように、ミレニアル世代の人口増加は、人工的な薬よりも自然治癒力を重視するため、製品需要を促進すると予想されます。米国では、これらの製品には環境フットプリントを最小限に抑えるため、エネルギー効率の高い機能が組み込まれていることが多いです。例えば、消費電力が低く、自動停止機能を備えたディフューザーは省エネに貢献しています。エッセンシャルオイルの詰め替え用やリサイクル可能なパッケージを提供する企業もあり、それによって循環経済を促進し、廃棄物の発生を減らしています。
このアプローチは、製品の生産から廃棄まで、ライフサイクル全体を考慮した上で製品を購入する環境意識の高い消費者の共感を呼んでいます。フォレスト・エッセンシャルやターゲットなどの大手小売チェーンや百貨店は、全国に商品を卸しており、消費者は購入前に実際に商品を体験することができます。また、健康志向の施設やスパ、ホリスティック・ウェルネス・センターとのコラボレーションも、業界各社がよく用いる流通戦略です。これらのチャネルは、より幅広いウェルネス・アプローチの一環としてアロマセラピーを求める消費者に対応しています。したがって、小売チェーン店や百貨店の数が大幅に増加していることから、製品の需要は増加すると予想されます。
米国のアロマディフューザー市場レポートハイライト
- 超音波製品セグメントが市場を独占し、2023年には66.7%のシェアを占めました。これは、電子周波数を使用して水中に振動を発生させ、エッセンシャルオイルが浮遊する水面に伝達するといった製品特性によるものです。
- ハイパーマーケット/スーパーマーケット・セグメントは、2023年に43.0%の最大の売上シェアを占めました。
- eコマース分野は、主要企業による広告やマーケティングの増加により、オンラインショッピングを通じた製品販売が促進されるため、2024年から2030年にかけて最も速いCAGR 9.7%を記録すると予想されます。
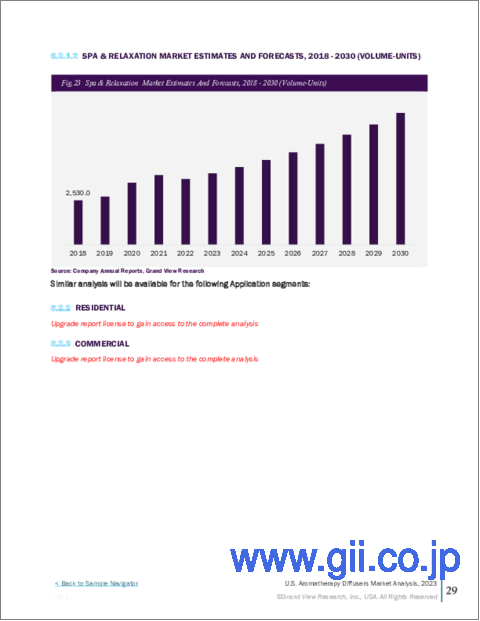
- スパ&リラクゼーション分野は、2023年に52.5%のシェアで市場を独占し、2024年から2030年にかけて最も速いCAGR 9.0%を記録すると予測されています。スパ業界では、これらの製品は顧客がリラックスできる環境を作るために使用されます。アロマディフューザーは、贅沢さを加え、スパ体験を向上させる。治療用エッセンシャルオイルの助けを借りて、これらのディフューザーは雰囲気を本当に落ち着かせることができます。
- 2023年8月、エセンツは、ボディアロマセラピーの体験をさらに高めることを目指し、天然フレグランスディフューザーとリードエッセンシャルオイルのフレッシュなラインナップを発売しました。エセンツが発表した革新的なリードディフューザーは、アロマセラピーへの独特なアプローチを顧客に提案します。
- このディフューザーは、マイクロミニストローを天然の芯として使用し、効率的に液体を上方に引き込み、周囲の空気に拡散させます。このデザインは、特に狭い場所や限られたスペースに適しており、アロマセラピーの効果を体験するためのユニークで効果的な方法を提供します。
目次
第1章 調査手法と範囲
第2章 エグゼクティブサマリー
第3章 米国のアロマディフューザー市場の変数、動向、範囲
- 市場系統の見通し
- 集中と成長の見通しマッピング
- 業界のバリューチェーン分析
- 原材料・成分の見通し
- 製造業の見通し
- 配布の見通し
- アプリケーションの見通し
- 規制の枠組み
- 規格とコンプライアンス
- 規則
- 技術フレームワーク
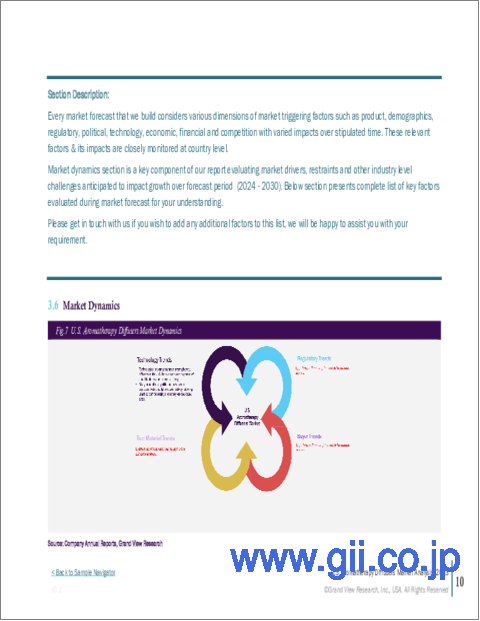
- 市場力学
- 市場促進要因分析
- 市場抑制要因分析
- 市場機会
- 市場の課題
- 業界分析ツール
- ポーターのファイブフォース分析
- マクロ経済分析
- 経済メガトレンド分析
- 新型コロナウイルス感染症(COVID-19)の影響
- ロシア・ウクライナ戦争
- アロマディフューザーの価格動向分析、製品別、2023年
- 流通チャネル分析
- ベンダーマトリックス
- 主要な原材料/コンポーネントプロバイダーのリスト
- 主要メーカー一覧
- 主要ディストリビューターのリスト
第4章 米国のアロマディフューザー市場:製品の推定・動向分析
- 流通チャネルの変動分析と市場シェア、2023年と2030年
- 製品別、2018年から2030年まで
- 超音波
- ネブライザー
- 蒸発性
- 熱
第5章 米国のアロマディフューザー市場:流通チャネルの推定・動向分析
- 流通チャネルの変動分析と市場シェア、2023年と2030年
- 流通チャネル別、2018年から2030年まで
- 小売業者
- ハイパーマーケット/スーパーマーケット
- eコマース
- その他
第6章 米国のアロマディフューザー市場:用途の推定・動向分析
- 用途の変動分析と市場シェア、2023年と2030年
- 用途別、2018年から2030年まで
- 住宅
- 商業
- スパ&リラクゼーション
第7章 米国のアロマディフューザー市場-競合情勢
- 主要市場参入企業による最近の動向と影響分析
- 会社/競合の分類
- 参入企業の概要
- 財務実績
- 製品のベンチマーク
- 企業の市場での位置付け
- 企業ヒートマップ分析
- 競合ダッシュボード分析
- 戦略マッピング
- 製品の発売
- 合併と買収
- 企業プロファイル
- Young Living Essential Oils, LC.
- doTERRA
- Ryohin Keikaku Co., Ltd(Muji)
- Greenair
- ESCENTS
- Organic Aromas
- Puzhen
- Ellia
- Pilgrim
- Edens Garden
- NOW Foods
- Rocky Mountain Oils, LLC
- Helias LLC
- Stadler
List of Tables
- Table 1 Advantages of Aromatherapy Diffusers
- Table 2 U.S. Aromatherapy Diffusers Market Estimates and Forecasts By Product, 2018 - 2030 (Thousand Units)
- Table 3 U.S. Aromatherapy Diffusers Market Estimates and Forecasts By Product, 2018 - 2030 (USD Million)
- Table 4 U.S. Aromatherapy Diffusers Market Estimates and Forecasts By Distribution Channel, 2018 - 2030 (Thousand Units)
- Table 5 U.S. Aromatherapy Diffusers Market Estimates and Forecasts By Distribution Channel, 2018 - 2030 (USD Million)
- Table 6 U.S. Aromatherapy Diffusers Market Estimates and Forecasts By Application, 2018 - 2030 (Thousand Units)
- Table 7 U.S. Aromatherapy Diffusers Market Estimates and Forecasts By Application, 2018 - 2030 (USD Million)
- Table 8 Recent Developments & Impact Analysis, By Key Market Participants
- Table 9 Company Heat Map Analysis, 2023
- Table 10 Key Companies: Product Launches
- Table 11 Key Companies: Mergers & Acquisitions
List of Figures
- Fig. 1 Market Segmentation & Scope
- Fig. 2 Information Procurement
- Fig. 3 Data Analysis Models
- Fig. 4 Market Formulation And Validation
- Fig. 5 Data Validating & Publishing
- Fig. 6 Market Snapshot
- Fig. 7 Product & Application Segment Snapshot
- Fig. 8 Distribution Channel Segment Snapshot
- Fig. 9 Competitive Landscape Snapshot
- Fig. 10 U.S. Aromatherapy Diffusers Market Value, 2023 (USD Million)
- Fig. 11 Concentration & Growth Prospect Mapping
- Fig. 12 U.S. Aromatherapy Diffusers Market - Value Chain Analysis
- Fig. 13 Market Dynamics
- Fig. 14 Market Driver Analysis
- Fig. 15 Market Restraint Analysis
- Fig. 16 U.S. Aromatherapy Diffusers Market - PORTER's Analysis
- Fig. 17 U.S. Aromatherapy Diffusers Market - PESTEL Analysis
- Fig. 18 Pricing Trend Analysis of Aromatherapy Diffusers, Average USD/Unit, 2023
- Fig. 19 U.S. Aromatherapy Diffusers Market Estimates & Forecasts, By Product: Key Takeaways
- Fig. 20 U.S. Aromatherapy Diffusers Market Share, By Product, 2022 & 2030
- Fig. 21 Ultrasonic Market Estimates & Forecasts, 2018 - 2030 (Thousand Units)
- Fig. 22 Ultrasonic Market Estimates & Forecasts, 2018 - 2030 (USD Million)
- Fig. 23 Nebulizers Market Estimates & Forecasts, 2018 - 2030 (Thousand Units)
- Fig. 24 Nebulizers Market Estimates & Forecasts, 2018 - 2030 (USD Million)
- Fig. 25 Evaporative Market Estimates & Forecasts, 2018 - 2030 (Thousand Units)
- Fig. 26 Evaporative Market Estimates & Forecasts, 2018 - 2030 (USD Million)
- Fig. 27 Heat Market Estimates & Forecasts, 2018 - 2030 (Thousand Units)
- Fig. 28 Heat Market Estimates & Forecasts, 2018 - 2030 (USD Million)
- Fig. 29 U.S. Aromatherapy Diffusers Market Estimates & Forecasts, By Distribution Channel: Key Takeaways
- Fig. 30 U.S. Aromatherapy Diffusers Market Share, By Distribution Channel, 2023 & 2030
- Fig. 31 Retailers Market Estimates & Forecasts, 2018 - 2030 (Thousand Units
- Fig. 32 Retailers Market Estimates & Forecasts, 2018 - 2030 (USD Million)
- Fig. 33 Hypermarkets/Supermarkets Market Estimates & Forecasts, 2018 - 2030 (Thousand Units)
- Fig. 34 Hypermarkets/Supermarkets Market Estimates & Forecasts, 2018 - 2030 (USD Million)
- Fig. 35 E-commerce Market Estimates & Forecasts, 2018 - 2030 (Thousand Units)
- Fig. 36 E-commerce Market Estimates & Forecasts, 2018 - 2030 (USD Million)
- Fig. 37 Others Market Estimates & Forecasts, 2018 - 2030 (Thousand Units)
- Fig. 38 Others Market Estimates & Forecasts, 2018 - 2030 (USD Million)
- Fig. 39 U.S. Aromatherapy Diffusers Market Estimates & Forecasts, By Application: Key Takeaways
- Fig. 40 U.S. Aromatherapy Diffusers Market Share, By Application, 2023 & 2030
- Fig. 41 Residential Market Estimates & Forecasts, 2018 - 2030 (Thousand Units)
- Fig. 42 Residential Market Estimates & Forecasts, 2018 - 2030 USD Million)
- Fig. 43 Commercial Market Estimates & Forecasts, 2018 - 2030 (Thousand Units)
- Fig. 44 Commercial Market Estimates & Forecasts, 2018 - 2030 (USD Million)
- Fig. 45 Spa & Relaxation Market Estimates & Forecasts, 2018 - 2030 (Thousand Units)
- Fig. 46 Spa & Relaxation Market Estimates & Forecasts, 2018 - 2030 (USD Million)
- Fig. 47 Key Company Categorization
- Fig. 48 Company Market Positioning
- Fig. 49 Strategic Framework
U.S. Aromatherapy Diffusers Market Growth & Trends:
The U.S. aromatherapy diffusers market is anticipated to reach USD 762.4 million by 2030, registering a CAGR of 8.7% from 2024 to 2030, according to a new report by Grand View Research, Inc. A rise in the number of offices and hotels in the country has led to a significant demand for aromatherapy diffusers. Rising product adoption in spas is emblematic of a broad movement toward enhancing the overall wellness experience of customers. These devices, designed to disperse essential oils into the air, have become integral to spa environments as they offer a range of benefits that extend beyond mere fragrance. These factors are anticipated to augment market growth over the forecast period. Moreover, the trend of using aromatherapy as an alternative medicinal therapy is growing among millennials in the country.
Due to these changes in healing therapy trends, key companies are undertaking new initiatives and developing new products. According to the U.S. Census Bureau, the millennial population in the country was 72.2 million in 2022, surpassing the baby boomer population in the same year. Thus, increased population of millennials is expected to fuel product demand, as they focus more on natural healing than manmade drugs. In the U.S., these products are often incorporated with energy-efficient features to minimize their environmental footprint. For instance, diffusers with low energy consumption and automatic shut-off functions contribute to energy conservation. Some companies are offering refillable or recyclable packaging for their essential oils, thereby promoting a circular economy, and reducing waste generation.
This approach resonates with environment-conscious consumers who purchase products after considering their entire lifecycle, right from their production to their disposal. Major retail chains and department stores, such as Forest Essential and Target, distribute products across the country, allowing consumers to physically experience the product before purchasing. Also, collaborations with health-focused establishments, spas, or holistic wellness centers are a common distribution strategy used by industry players. These channels cater to consumers seeking aromatherapy as part of a broader wellness approach. Hence with a significant rise in the number of retail chains and departmental stores, the product demand is expected to increase.
U.S. Aromatherapy Diffusers Market Report Highlights:
- The ultrasonic products segment dominated the market and accounted for a share of 66.7% in 2023 owing to product characteristics, such as use of electronic frequencies to create vibrations in the water that are transmitted to the surface where the essential oil floats
- The hypermarkets/supermarkets segment accounted for the largest revenue share of 43.0% in 2023 asthey have a larger availability of goods and offer products at a lower prices than other retail formats
- The e-commerce segment is expected to register the fastest CAGR of 9.7% from 2024 to 2030 as increased advertising and marketing by key players encourage product sales through online shopping
- The spa & relaxation segment dominated the market in 2023 with a share of 52.5% and is anticipated to register the fastest CAGR of 9.0% from 2024 to 2030. In the spa industry, these products are used to create a relaxing environment for clients. Aromatherapy diffusers add luxury and enhance the spa experience. With the help of therapeutic essential oils, these diffusers can make the atmosphere really soothing
- In August 2023, Escents launched a fresh line of natural fragrance diffusers and reed essential oils, aiming to elevate the experience of body aromatherapy. The innovative Reed Diffusers introduced by Escents present customers with a distinctive approach to aromatherapy
- These diffusers incorporate micro-mini straws serving as natural wicks, efficiently drawing the liquid upward and dispersing it into the surrounding air. This design proves especially well-suited for smaller and confined spaces, offering a unique and effective method for experiencing the benefits of aromatherapy
Table of Contents
Chapter 1. Methodology and Scope
- 1.1. Market Segmentation & Scope
- 1.2. Market Definition
- 1.3. Research Methodology
- 1.4. Information Procurement
- 1.4.1. Purchased Database
- 1.4.2. GVR's Internal Database
- 1.4.3. Secondary Sources
- 1.4.4. Third-Party Perspectives
- 1.5. Information Analysis
- 1.5.1. Data Analysis Models
- 1.5.2. Market Formulation & Data Visualization
- 1.5.3. Data Validation & Publishing
- 1.6. Research Scope and Assumptions
- 1.6.1. List to Data Sources
Chapter 2. Executive Summary
- 2.1. Market Snapshot
- 2.2. Product & Application Snapshot
- 2.3. Distribution Channel Segment Snapshot
- 2.4. Competitive Landscape Snapshot
Chapter 3. U.S. Aromatherapy Diffusers Market Variables, Trends & Scope
- 3.1. Market Lineage Outlook
- 3.2. Concentration & Growth Prospect Mapping
- 3.3. Industry Value Chain Analysis
- 3.3.1. Raw material/ component outlook
- 3.3.2. Manufacturing outlook
- 3.3.3. Distribution Outlook
- 3.3.4. Application Outlook
- 3.4. Regulatory Framework
- 3.4.1. Standard and compliance
- 3.4.2. Regulations
- 3.5. Technology framework
- 3.6. Market Dynamics
- 3.6.1. Market Driver Analysis
- 3.6.2. Market Restraint Analysis
- 3.6.3. Market Opportunities
- 3.6.4. Market Challenges
- 3.7. Industry Analysis Tools
- 3.7.1. Porter's Five Forces Analysis
- 3.7.2. Macroeconomic Analysis
- 3.8. Economic Mega-Trend Analysis
- 3.8.1. COVID-19 Impact
- 3.8.2. Russia-Ukraine War
- 3.9. Pricing Trend Analysis of Aromatherapy Diffusers, By Product, 2023
- 3.10. Distribution Channel Analysis
- 3.11. Vendor Matrix
- 3.11.1. List of Key Raw Material/Component Providers
- 3.11.2. List of Key Manufacturers
- 3.11.3. List of Key Distributors
Chapter 4. U.S. Aromatherapy Diffusers Market: Product Estimates & Trend Analysis
- 4.1. Distribution Channel Movement Analysis & Market Share, 2023 & 2030
- 4.2. U.S. Aromatherapy Diffusers Market Estimates & Forecast, By Product, 2018 to 2030 (Thousand Units) (USD Million)
- 4.3. Ultrasonic
- 4.3.1. Ultrasonic Market Revenue Estimates and Forecasts, 2018 - 2030 (Thousand Units) (USD Million)
- 4.4. Nebulizers
- 4.4.1. Nebulizers Market Revenue Estimates and Forecasts, 2018 - 2030 (Thousand Units) (USD Million)
- 4.5. Evaporative
- 4.5.1. Evaporative Market Revenue Estimates and Forecasts, 2018 - 2030 (Thousand Units) (USD Million)
- 4.6. Heat
- 4.6.1. Heat Market Revenue Estimates and Forecasts, 2018 - 2030 (Thousand Units) (USD Million)
Chapter 5. U.S. Aromatherapy Diffusers Market: Distribution Channel Estimates & Trend Analysis
- 5.1. Distribution Channel Movement Analysis & Market Share, 2023 & 2030
- 5.1.1. U.S. Aromatherapy Diffusers Market Estimates & Forecast, By Distribution Channel, 2018 to 2030 (Thousand Units) (USD Million)
- 5.2. Retailers
- 5.2.1. Retailers Market Revenue Estimates and Forecasts, 2018 - 2030 (Thousand Units) (USD Million)
- 5.3. Hypermarkets/Supermarkets
- 5.3.1. Hypermarkets/Supermarkets Market Revenue Estimates and Forecasts, 2018 - 2030 (Thousand Units) (USD Million)
- 5.4. E-commerce
- 5.4.1. E-commerce Market Revenue Estimates and Forecasts, 2018 - 2030 (Thousand Units) (USD Million)
- 5.5. Others
- 5.5.1. Others Market Revenue Estimates and Forecasts, 2018 - 2030 (Thousand Units) (USD Million)
Chapter 6. U.S. Aromatherapy Diffusers Market: Application Estimates & Trend Analysis
- 6.1. Application Movement Analysis & Market Share, 2023 & 2030
- 6.1.1. U.S. Aromatherapy Diffusers Market Estimates & Forecast, By Application, 2018 to 2030 (Thousand Units) (USD Million)
- 6.2. Residential
- 6.2.1. Residential Market Revenue Estimates and Forecasts, 2018 - 2030 (Thousand Units) (USD Million)
- 6.3. Commercial
- 6.3.1. Commercial Market Revenue Estimates and Forecasts, 2018 - 2030 (Thousand Units) (USD Million)
- 6.4. Spa & Relaxation
- 6.4.1. Spa & Relaxation Market Revenue Estimates and Forecasts, 2018 - 2030 (Thousand Units) (USD Million)
Chapter 7. U.S. Aromatherapy Diffusers Market - Competitive Landscape
- 7.1. Recent Developments & Impact Analysis, By Key Market Participants
- 7.2. Company/Competition Categorization
- 7.3. Participant's Overview
- 7.4. Financial Performance
- 7.5. Product Benchmarking
- 7.6. Company Market Positioning
- 7.7. Company Heat Map Analysis
- 7.8. Competitive Dashboard Analysis
- 7.9. Strategy Mapping
- 7.9.1. Product Launches
- 7.9.2. Mergers & Acquisition
- 7.10. Company Profiles
- 7.10.1. Young Living Essential Oils, LC.
- 7.10.1.1. Participant's overview
- 7.10.1.2. Financial performance
- 7.10.1.3. Product benchmarking
- 7.10.1.4. Recent developments
- 7.10.2. doTERRA
- 7.10.2.1. Participant's overview
- 7.10.2.2. Financial performance
- 7.10.2.3. Product benchmarking
- 7.10.2.4. Recent developments
- 7.10.3. Ryohin Keikaku Co., Ltd (Muji)
- 7.10.3.1. Participant's overview
- 7.10.3.2. Financial performance
- 7.10.3.3. Product benchmarking
- 7.10.3.4. Recent developments
- 7.10.4. Greenair
- 7.10.4.1. Participant's overview
- 7.10.4.2. Financial performance
- 7.10.4.3. Product benchmarking
- 7.10.4.4. Recent developments
- 7.10.5. ESCENTS
- 7.10.5.1. Participant's overview
- 7.10.5.2. Financial performance
- 7.10.5.3. Product benchmarking
- 7.10.5.4. Recent developments
- 7.10.6. Organic Aromas
- 7.10.6.1. Participant's overview
- 7.10.6.2. Financial performance
- 7.10.6.3. Product benchmarking
- 7.10.6.4. Recent developments
- 7.10.7. Puzhen
- 7.10.7.1. Participant's overview
- 7.10.7.2. Financial performance
- 7.10.7.3. Product benchmarking
- 7.10.7.4. Recent developments
- 7.10.8. Ellia
- 7.10.8.1. Participant's overview
- 7.10.8.2. Financial performance
- 7.10.8.3. Product benchmarking
- 7.10.8.4. Recent developments
- 7.10.9. Pilgrim
- 7.10.9.1. Participant's overview
- 7.10.9.2. Financial performance
- 7.10.9.3. Product benchmarking
- 7.10.9.4. Recent developments
- 7.10.10. Edens Garden
- 7.10.10.1. Participant's overview
- 7.10.10.2. Financial performance
- 7.10.10.3. Product benchmarking
- 7.10.10.4. Recent developments
- 7.10.11. NOW Foods
- 7.10.11.1. Participant's overview
- 7.10.11.2. Financial performance
- 7.10.11.3. Product benchmarking
- 7.10.11.4. Recent developments
- 7.10.12. Rocky Mountain Oils, LLC
- 7.10.12.1. Participant's overview
- 7.10.12.2. Financial performance
- 7.10.12.3. Product benchmarking
- 7.10.12.4. Recent developments
- 7.10.13. Helias LLC
- 7.10.13.1. Participant's overview
- 7.10.13.2. Financial performance
- 7.10.13.3. Product benchmarking
- 7.10.13.4. Recent developments
- 7.10.14. Stadler
- 7.10.14.1. Participant's overview
- 7.10.14.2. Financial performance
- 7.10.14.3. Product benchmarking
- 7.10.14.4. Recent developments
- 7.10.1. Young Living Essential Oils, LC.