|
|
市場調査レポート
商品コード
1405894
胆管ステントの市場規模、シェア、動向分析レポート:タイプ別、用途別、最終用途別、セグメント予測、2024年~2030年Biliary Stents Market Size, Share & Trends Analysis Report By Type (Metal, Plastic), By Application (Bilio-pancreatic Leakages, Pancreatic Cancer), By End-use, And Segment Forecasts, 2024 - 2030 |
||||||
|
|
|||||||
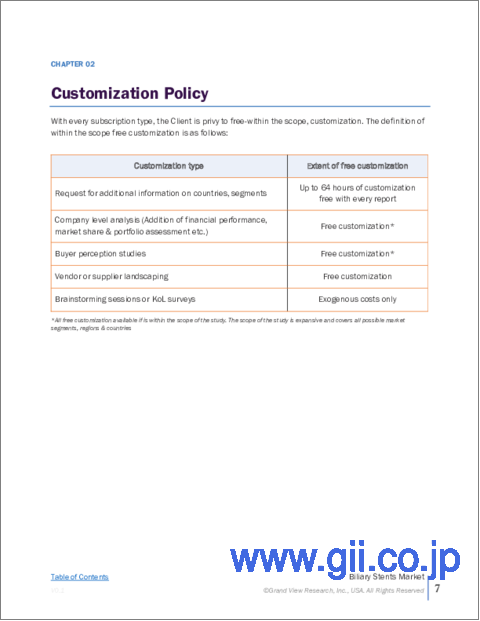
カスタマイズ可能
|
|||||||


| 胆管ステントの市場規模、シェア、動向分析レポート:タイプ別、用途別、最終用途別、セグメント予測、2024年~2030年 |
|
出版日: 2023年12月22日
発行: Grand View Research
ページ情報: 英文 110 Pages
納期: 2~10営業日
|

全表示
- 概要
- 図表
- 目次
胆管ステント市場の成長と動向:
Grand View Research社の最新レポートによると、世界の胆管ステント市場規模は2030年までに1億9,796万米ドルに達すると推定されます。
市場は2024年から2030年にかけてCAGR 5.0%で成長すると予測されています。同市場は、胆道疾患や慢性肝疾患の罹患率の上昇に牽引され、力強い成長を遂げています。CDCの報告書によると、米国では毎年、肝臓がんが男性約25,000人、女性約11,000人に罹患し、かなりの死亡率をもたらしています。この上昇傾向は、ステントの種類の進歩、高齢者人口の増加、ヘルスケアに対する意識の高まり、低侵襲治療への嗜好の高まりによってさらに推進されています。
2023年4月に発表されたNCBIの論文によると、市場拡大に寄与する極めて重要な要因は、内視鏡的内腔ステント留置術(ELS)の普及です。ELSは、消化管の悪性閉塞、特に胆道閉塞を管理するための低侵襲で非常に効果的なソリューションとして登場しました。放射線治療や外科手術のような従来の治療法よりも優れているため、緩和療法やネオアジュバント療法における第一選択薬として位置づけられています。
ステントの種類がダイナミックに進化し、高い有効性、安全性、最先端技術への適応性が求められるようになったことが、市場の継続的な成長と関連性の触媒となっています。こうした前向きな動向にもかかわらず、COVID-19パンデミックにおけるがん検診の減少の影響は課題をもたらし、新たにがんと診断された症例の顕著な減少につながっています。
胆管ステント市場のレポートハイライト
- 2023年、北米が43.69%で最大の売上シェアを占めました。同地域の先進ヘルスケアインフラ、消化管の健康に対する意識の高まり、高齢化人口の増加が市場の優位性に寄与しています。
- タイプ別では、金属セグメントが2023年に66.99%の収益シェアで胆管ステント業界を支配しました。金属の成長は、完全被覆自己拡張型金属ステント(FCSEMS)の出現によって推進されています。
- 用途別では、胆石セグメントが2023年に41.28%の収益シェアで市場を独占しました。この拡大の大きな原動力は、胆石関連疾患の有病率の増加であり、効果的で低侵襲な介入に対する需要の高まりを促しています。
- 最終用途別では、病院部門が74.23%の収益シェアで市場を独占しました。病院は主に、包括的な医療を提供する主要なセンターとして市場の成長に貢献しています。
目次
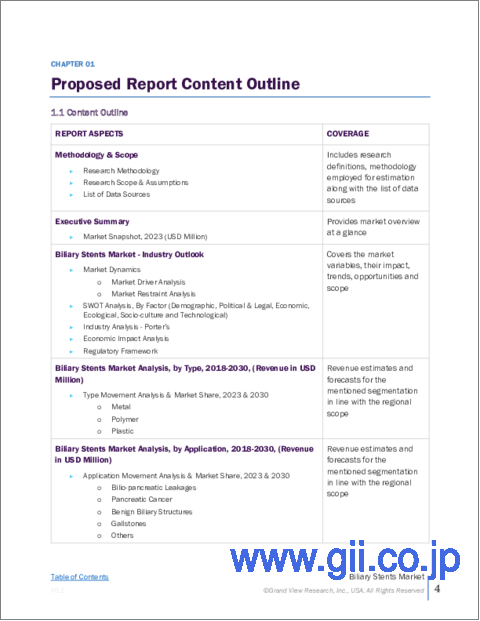
第1章 調査手法と範囲
第2章 エグゼクティブサマリー
第3章 胆管ステント市場の変数、動向、範囲
- 市場系統の見通し
- 親市場の見通し
- 関連/付随市場の見通し
- 市場力学
- 市場促進要因分析
- 市場抑制要因分析
- 胆管ステント市場分析ツール
- 業界分析- ポーターのファイブフォース分析
- PESTEL分析
第4章 胆管ステント市場:タイプの推定・動向分析
- 定義と範囲
- タイプ市場シェア、2023年および2030年
- セグメントダッシュボード
- タイプ別の世界の胆管ステント市場の見通し
- 以下の市場規模、予測および動向分析、2018年から2030年まで
- 金属
- ポリマー
- プラスチック
第5章 胆管ステント市場:用途の推定・動向分析
- 定義と範囲
- 用途市場シェア、2023年と2030年
- セグメントダッシュボード
- 用途別の世界の胆管ステント市場の見通し
- 以下の市場規模、予測および動向分析、2018年から2030年まで
- 胆膵漏出
- 膵臓がん
- 良性胆管構造
- 胆石
- その他
第6章 胆管ステント市場:最終用途の推定・動向分析
- 定義と範囲
- 最終用途市場シェア、2023年および2030年
- セグメントダッシュボード
- 最終用途別の世界の胆管ステント市場の見通し
- 以下の市場規模、予測および動向分析、2018年から2030年まで
- 病院
- 外来手術センター
- その他
第7章 胆管ステント市場:地域推定・動向分析
- 地域市場シェア分析、2023年および2030年
- 地域市場ダッシュボード
- 世界の地域市場のスナップショット
- 市場規模と予測トレンド分析、2018年から2030年:
- 北米
- 米国
- カナダ
- 欧州
- 英国
- ドイツ
- フランス
- イタリア
- スペイン
- ノルウェー
- スウェーデン
- デンマーク
- アジア太平洋地域
- 日本
- 中国
- インド
- オーストラリア
- 韓国
- タイ
- ラテンアメリカ
- ブラジル
- メキシコ
- アルゼンチン
- 中東・アフリカ
- 南アフリカ
- サウジアラビア
- アラブ首長国連邦
- クウェート
第8章 競合情勢
- 主要市場参入企業による最近の動向と影響分析
- 会社/競合の分類
- イノベーター
- ベンダー情勢
- 主要ディストリビューターとチャネルパートナーのリスト
- 主要顧客
- 主要企業シェア分析、2023年
- Boston Scientific
- Boston Scientific
- Cook Group
- ENDO-FLEX GmbH
- Olympus Corporation
- B Braun Melsungen
- CONMED Corporation
- MI Tech
- CRBard(Becton, Dickinson &Company)
- Medtronic plc
- Cardinal Health
- Merit Medical System
List of Tables
- Table 1 List of Abbreviation
- Table 2 North America Biliary Stents market, by region, 2018 - 2030 (USD Million)
- Table 3 North America Biliary Stents market, by type, 2018 - 2030 (USD Million)
- Table 4 North America Biliary Stents market, by application, 2018 - 2030 (USD Million)
- Table 5 North America Biliary Stents market, by end-use, 2018 - 2030 (USD Million)
- Table 6 North America Biliary Stents market, by end-use, 2018 - 2030 (USD Million)
- Table 7 U.S. Biliary Stents market, by type, 2018 - 2030 (USD Million)
- Table 8 U.S. Biliary Stents market, by application, 2018 - 2030 (USD Million)
- Table 9 U.S. Biliary Stents market, by end-use, 2018 - 2030 (USD Million)
- Table 10 Canada Biliary Stents market, by type, 2018 - 2030 (USD Million)
- Table 11 Canada Biliary Stents market, by application, 2018 - 2030 (USD Million)
- Table 12 Canada Biliary Stents market, by end-use, 2018 - 2030 (USD Million)
- Table 13 Europe Biliary Stents market, by region, 2018 - 2030 (USD Million)
- Table 14 Europe Biliary Stents market, by type, 2018 - 2030 (USD Million)
- Table 15 Europe Biliary Stents market, by application, 2018 - 2030 (USD Million)
- Table 16 Europe Biliary Stents market, by end-use, 2018 - 2030 (USD Million)
- Table 17 Germany Biliary Stents market, by type, 2018 - 2030 (USD Million)
- Table 18 Germany Biliary Stents market, by application, 2018 - 2030 (USD Million)
- Table 19 Germany Biliary Stents market, by end-use, 2018 - 2030 (USD Million)
- Table 20 UK Biliary Stents market, by type, 2018 - 2030 (USD Million)
- Table 21 UK Biliary Stents market, by application, 2018 - 2030 (USD Million)
- Table 22 UK Biliary Stents market, by end-use, 2018 - 2030 (USD Million)
- Table 23 France Biliary Stents market, by type, 2018 - 2030 (USD Million)
- Table 24 France Biliary Stents market, by application, 2018 - 2030 (USD Million)
- Table 25 France Biliary Stents market, by end-use, 2018 - 2030 (USD Million)
- Table 26 Italy Biliary Stents market, by type, 2018 - 2030 (USD Million)
- Table 27 Italy Biliary Stents market, by application, 2018 - 2030 (USD Million)
- Table 28 Italy Biliary Stents market, by end-use, 2018 - 2030 (USD Million)
- Table 29 Spain Biliary Stents market, by type, 2018 - 2030 (USD Million)
- Table 30 Spain Biliary Stents market, by application, 2018 - 2030 (USD Million)
- Table 31 Spain Biliary Stents market, by end-use, 2018 - 2030 (USD Million)
- Table 32 Denmark Biliary Stents market, by type, 2018 - 2030 (USD Million)
- Table 33 Denmark Biliary Stents market, by application, 2018 - 2030 (USD Million)
- Table 34 Denmark Biliary Stents market, by end-use, 2018 - 2030 (USD Million)
- Table 35 Sweden Biliary Stents market, by type, 2018 - 2030 (USD Million)
- Table 36 Sweden Biliary Stents market, by application, 2018 - 2030 (USD Million)
- Table 37 Sweden Biliary Stents market, by end-use, 2018 - 2030 (USD Million)
- Table 38 Norway Biliary Stents market, by type, 2018 - 2030 (USD Million)
- Table 39 Norway Biliary Stents market, by application, 2018 - 2030 (USD Million)
- Table 40 Norway Biliary Stents market, by end-use, 2018 - 2030 (USD Million)
- Table 41 Asia Pacific Biliary Stents market, by region, 2018 - 2030 (USD Million)
- Table 42 Asia Pacific Biliary Stents market, by type, 2018 - 2030 (USD Million)
- Table 43 Asia Pacific Biliary Stents market, by application, 2018 - 2030 (USD Million)
- Table 44 Asia Pacific Biliary Stents market, by end-use, 2018 - 2030 (USD Million)
- Table 45 China Biliary Stents market, by type, 2018 - 2030 (USD Million)
- Table 46 China Biliary Stents market, by application, 2018 - 2030 (USD Million)
- Table 47 China Biliary Stents market, by end-use, 2018 - 2030 (USD Million)
- Table 48 Japan Biliary Stents market, by type, 2018 - 2030 (USD Million)
- Table 49 Japan Biliary Stents market, by application, 2018 - 2030 (USD Million)
- Table 50 Japan Biliary Stents market, by end-use, 2018 - 2030 (USD Million)
- Table 51 India Biliary Stents market, by type, 2018 - 2030 (USD Million)
- Table 52 India Biliary Stents market, by application, 2018 - 2030 (USD Million)
- Table 53 India Biliary Stents market, by end-use, 2018 - 2030 (USD Million)
- Table 54 South Korea Biliary Stents market, by type, 2018 - 2030 (USD Million)
- Table 55 South Korea Biliary Stents market, by application, 2018 - 2030 (USD Million)
- Table 56 South Korea Biliary Stents market, by end-use, 2018 - 2030 (USD Million)
- Table 57 Australia Biliary Stents market, by type, 2018 - 2030 (USD Million)
- Table 58 Australia Biliary Stents market, by application, 2018 - 2030 (USD Million)
- Table 59 Australia Biliary Stents market, by end-use, 2018 - 2030 (USD Million)
- Table 60 Thailand Biliary Stents market, by type, 2018 - 2030 (USD Million)
- Table 61 Thailand Biliary Stents market, by application, 2018 - 2030 (USD Million)
- Table 62 Thailand Biliary Stents market, by end-use, 2018 - 2030 (USD Million)
- Table 63 Latin America Biliary Stents market, by type, 2018 - 2030 (USD Million)
- Table 64 Latin America Biliary Stents market, by application, 2018 - 2030 (USD Million)
- Table 65 Latin America Biliary Stents market, by end-use, 2018 - 2030 (USD Million)
- Table 66 Brazil Biliary Stents market, by Type, 2018 - 2030 (USD Million)
- Table 67 Brazil Biliary Stents market, by application, 2018 - 2030 (USD Million)
- Table 68 Brazil Biliary Stents market, by end-use, 2018 - 2030 (USD Million)
- Table 69 Mexico Biliary Stents market, by Type, 2018 - 2030 (USD Million)
- Table 70 Mexico Biliary Stents market, by Application, 2018 - 2030 (USD Million)
- Table 71 Mexico Biliary Stents market, by end-use, 2018 - 2030 (USD Million)
- Table 72 Argentina Biliary Stents market, by type, 2018 - 2030 (USD Million)
- Table 73 Argentina Biliary Stents market, by application, 2018 - 2030 (USD Million)
- Table 74 Argentina Biliary Stents market, by end-use, 2018 - 2030 (USD Million)
- Table 75 MEA Biliary Stents market, by region, 2018 - 2030 (USD Million)
- Table 76 MEA Biliary Stents market, by type, 2018 - 2030 (USD Million)
- Table 77 MEA Biliary Stents market, by application, 2018 - 2030 (USD Million)
- Table 78 MEA Biliary Stents market, by end-use, 2018 - 2030 (USD Million)
- Table 79 South Africa Biliary Stents market, by type, 2018 - 2030 (USD Million)
- Table 80 South Africa Biliary Stents market, by application, 2018 - 2030 (USD Million)
- Table 81 South Africa Biliary Stents market, by end-use, 2018 - 2030 (USD Million)
- Table 82 Saudi Arabia Biliary Stents market, by type, 2018 - 2030 (USD Million)
- Table 83 Saudi Arabia Biliary Stents market, by application, 2018 - 2030 (USD Million)
- Table 84 Saudi Arabia Biliary Stents market, by end-use, 2018 - 2030 (USD Million)
- Table 85 UAE Biliary Stents market, by type, 2018 - 2030 (USD Million)
- Table 86 UAE Biliary Stents market, by application, 2018 - 2030 (USD Million)
- Table 87 UAE Biliary Stents market, by end-use, 2018 - 2030 (USD Million)
- Table 88 Kuwait Biliary Stents market, by type, 2018 - 2030 (USD Million)
- Table 89 Kuwait Biliary Stents market, by application, 2018 - 2030 (USD Million)
- Table 90 Kuwait Biliary Stents market, by end-use, 2018 - 2030 (USD Million)
List of Figures
- Fig. 1 Market research process
- Fig. 2 Data triangulation techniques
- Fig. 3 Primary research pattern
- Fig. 4 Primary interviews in North America
- Fig. 5 Primary interviews in Europe
- Fig. 6 Primary interviews in APAC
- Fig. 7 Primary interviews in Latin America
- Fig. 8 Primary interviews in MEA
- Fig. 9 Market research approaches
- Fig. 10 Value-chain-based sizing & forecasting
- Fig. 11 QFD modeling for market share assessment
- Fig. 12 Market formulation & validation
- Fig. 13 Biliary Stents market: market outlook
- Fig. 14 Biliary Stents competitive insights
- Fig. 15 Parent market outlook
- Fig. 16 Related/ancillary market outlook
- Fig. 17 Penetration and growth prospect mapping
- Fig. 18 Industry value chain analysis
- Fig. 19 Biliary Stents market driver impact
- Fig. 20 Biliary Stents market restraint impact
- Fig. 21 Biliary Stents market strategic initiatives analysis
- Fig. 22 Biliary Stents market: Type movement analysis
- Fig. 23 Biliary Stents market: Type outlook and key takeaways
- Fig. 24 Metal market estimates and forecasts, 2018 - 2030
- Fig. 25 Polymer market estimates and forecasts, 2018 - 2030
- Fig. 26 Plastic market estimates and forecasts, 2018 - 2030
- Fig. 27 Biliary Stents Market: Application Movement Analysis
- Fig. 28 Biliary Stents market: Application outlook and key takeaways
- Fig. 29 Bilio-pancreatic Leakages market estimates and forecasts, 2018 - 2030
- Fig. 30 Pancreatic Cancer market estimates and forecasts, 2018 - 2030
- Fig. 31 Benign Biliary Structures market estimates and forecasts, 2018 - 2030
- Fig. 32 Gallstones market estimates and forecasts, 2018 - 2030
- Fig. 33 Others market estimates and forecasts, 2018 - 2030
- Fig. 34 Biliary Stents market: End-use movement analysis
- Fig. 35 Biliary Stents market: End-use outlook and key takeaways
- Fig. 36 Hospitals market estimates and forecasts, 2018 - 2030
- Fig. 37 Ambulatory Surgical Centers market estimates and forecasts, 2018 - 2030
- Fig. 38 Others market estimates and forecasts, 2018 - 2030
- Fig. 39 Global Biliary Stents market: Regional movement analysis
- Fig. 40 Global Biliary Stents market: Regional outlook and key takeaways
- Fig. 41 Global Biliary Stents market share and leading players
- Fig. 42 North America market share and leading players
- Fig. 43 Europe market share and leading players
- Fig. 44 Asia Pacific market share and leading players
- Fig. 45 Latin America market share and leading players
- Fig. 46 Middle East & Africa market share and leading players
- Fig. 47 North America: SWOT
- Fig. 48 Europe SWOT
- Fig. 49 Asia Pacific SWOT
- Fig. 50 Latin America SWOT
- Fig. 51 MEA SWOT
- Fig. 52 North America, by country
- Fig. 53 North America
- Fig. 54 North America market estimates and forecasts, 2018 - 2030
- Fig. 55 U.S.
- Fig. 56 U.S. market estimates and forecasts, 2018 - 2030
- Fig. 57 Canada
- Fig. 58 Canada market estimates and forecasts, 2018 - 2030
- Fig. 59 Europe
- Fig. 60 Europe market estimates and forecasts, 2018 - 2030
- Fig. 61 UK
- Fig. 62 UK market estimates and forecasts, 2018 - 2030
- Fig. 63 Germany
- Fig. 64 Germany market estimates and forecasts, 2018 - 2030
- Fig. 65 France
- Fig. 66 France market estimates and forecasts, 2018 - 2030
- Fig. 67 Italy
- Fig. 68 Italy market estimates and forecasts, 2018 - 2030
- Fig. 69 Spain
- Fig. 70 Spain market estimates and forecasts, 2018 - 2030
- Fig. 71 Denmark
- Fig. 72 Denmark market estimates and forecasts, 2018 - 2030
- Fig. 73 Sweden
- Fig. 74 Sweden market estimates and forecasts, 2018 - 2030
- Fig. 75 Norway
- Fig. 76 Norway market estimates and forecasts, 2018 - 2030
- Fig. 77 Asia Pacific
- Fig. 78 Asia Pacific market estimates and forecasts, 2018 - 2030
- Fig. 79 China
- Fig. 80 China market estimates and forecasts, 2018 - 2030
- Fig. 81 Japan
- Fig. 82 Japan market estimates and forecasts, 2018 - 2030
- Fig. 83 India
- Fig. 84 India market estimates and forecasts, 2018 - 2030
- Fig. 85 Thailand
- Fig. 86 Thailand market estimates and forecasts, 2018 - 2030
- Fig. 87 South Korea
- Fig. 88 South Korea market estimates and forecasts, 2018 - 2030
- Fig. 89 Australia
- Fig. 90 Australia market estimates and forecasts, 2018 - 2030
- Fig. 91 Latin America
- Fig. 92 Latin America market estimates and forecasts, 2018 - 2030
- Fig. 93 Brazil
- Fig. 94 Brazil market estimates and forecasts, 2018 - 2030
- Fig. 95 Mexico
- Fig. 96 Mexico market estimates and forecasts, 2018 - 2030
- Fig. 97 Argentina
- Fig. 98 Argentina market estimates and forecasts, 2018 - 2030
- Fig. 99 Middle East and Africa
- Fig. 100 Middle East and Africa market estimates and forecasts, 2018 - 2030
- Fig. 101 South Africa
- Fig. 102 South Africa market estimates and forecasts, 2018 - 2030
- Fig. 103 Saudi Arabia
- Fig. 104 Saudi Arabia market estimates and forecasts, 2018 - 2030
- Fig. 105 UAE
- Fig. 106 UAE market estimates and forecasts, 2018 - 2030
- Fig. 107 Kuwait
- Fig. 108 Kuwait market estimates and forecasts, 2018 - 2030
- Fig. 109 Market share of key market players - Biliary Stents market
Biliary Stents Market Growth & Trends:
The global biliary stents market size is estimated to reach USD 197.96 million by 2030, based on a new report by Grand View Research, Inc. The market is projected to grow at a CAGR of 5.0% from 2024 to 2030. The market is experiencing robust growth, driven by the escalating incidence of biliary disorders and chronic liver diseases. In the U.S., liver cancer annually affects around 25,000 men and 11,000 women, resulting in a substantial mortality rate, according to the CDC report. This upward trajectory is further propelled by advancements in stent types, a growing geriatric population, heightened healthcare awareness, and a rising preference for minimally invasive procedures.
According to the NCBI article published in April 2023, a pivotal factor contributing to market expansion is the widespread adoption of endoscopic luminal stenting (ELS). ELS has emerged as a minimally invasive and highly effective solution for managing malignant obstructions in the gastrointestinal tract, particularly biliary obstructions. Its superiority over traditional modalities like radiotherapy and surgery positions it as a preferred first-line application in palliative and neoadjuvant settings.
The dynamic evolution of stent types, addressing the demand for heightened efficacy, safety, and adaptability to cutting-edge technologies, serves as a catalyst for the continued growth and relevance of the market. Despite these positive trends, the impact of reduced cancer screening initiatives during the COVID-19 pandemic has introduced challenges, leading to a notable decline in newly diagnosed cancer cases.
Biliary Stents Market Report Highlights:
- In 2023, North America held the market's largest revenue share of 43.69%. The region's advanced healthcare infrastructure, increasing awareness about gastrointestinal health, and a growing aging population contribute to the market's dominance
- Based on type, the metal segment dominated the biliary stents industry with a revenue share of 66.99% in 2023. The growth of metal is propelled by the advent of fully covered self-expandable metal stents (FCSEMS)
- Based on application, the gallstones segment dominated the market with a revenue share of 41.28% in 2023. A significant driving force in this expansion is the increasing prevalence of gallstone-related conditions, prompting a growing demand for effective and minimally invasive interventions
- In terms of end-use, the hospitals segment dominated the market with a revenue share of 74.23%. Hospitals primarily contribute to the market growth serving as prime centers for comprehensive medical care
Table of Contents
Chapter 1. Methodology and Scope
- 1.1. Market Segmentation & Scope
- 1.1.1. Type
- 1.1.2. Application
- 1.1.3. End-use
- 1.1.4. Regional scope
- 1.1.5. Estimates and forecast timeline
- 1.2. Research Methodology
- 1.3. Information Procurement
- 1.3.1. Purchased database
- 1.3.2. GVR's internal database
- 1.3.3. Secondary sources
- 1.3.4. Primary research
- 1.3.5. Details of primary research
- 1.3.5.1. Data for primary interviews in North America
- 1.3.5.2. Data for primary interviews in Europe
- 1.3.5.3. Data for primary interviews in Asia Pacific
- 1.3.5.4. Data for primary interviews in Latin America
- 1.3.5.5. Data for Primary interviews in MEA
- 1.4. Information or Data Analysis
- 1.4.1. Data analysis models
- 1.5. Market Formulation & Validation
- 1.6. Model Details
- 1.6.1. Commodity flow analysis (Model 1)
- 1.6.2. Approach 1: Commodity flow approach
- 1.6.3. Volume price analysis (Model 2)
- 1.6.4. Approach 2: Volume price analysis
- 1.7. List of Secondary Sources
- 1.8. List of Primary Sources
- 1.9. Objectives
Chapter 2. Executive Summary
- 2.1. Market Outlook
- 2.2. Segment Outlook
- 2.2.1. Type outlook
- 2.2.2. Application outlook
- 2.2.3. End-use outlook
- 2.2.4. Regional outlook
- 2.3. Competitive Insights
Chapter 3. Biliary Stents Market Variables, Trends & Scope
- 3.1. Market Lineage Outlook
- 3.1.1. Parent market outlook
- 3.1.2. Related/ancillary market outlook
- 3.2. Market Dynamics
- 3.2.1. Market driver analysis
- 3.2.1.1. Rising incidence of biliary disorders and chronic liver diseases
- 3.2.1.2. Advancements for stent type
- 3.2.1.3. Growing geriatric population and healthcare awareness
- 3.2.1.4. Increasing minimally invasive procedures
- 3.2.2. Market restraint analysis
- 3.2.2.1. High cost of the plastic bile duct stents
- 3.2.2.2. Complications and risk related to bile duct stents
- 3.2.1. Market driver analysis
- 3.3. Biliary Stents Market Analysis Tools
- 3.3.1. Industry Analysis - Porter's
- 3.3.1.1. Supplier power
- 3.3.1.2. Buyer power
- 3.3.1.3. Substitution threat
- 3.3.1.4. Threat of new entrant
- 3.3.1.5. Competitive rivalry
- 3.3.2. PESTEL Analysis
- 3.3.2.1. Political landscape
- 3.3.2.2. Technological landscape
- 3.3.2.3. Economic landscape
- 3.3.1. Industry Analysis - Porter's
Chapter 4. Biliary Stents Market: Type Estimates & Trend Analysis
- 4.1. Definitions and Scope
- 4.1.1. Metal
- 4.1.2. Polymer
- 4.1.3. Plastic
- 4.2. Type Market Share, 2023 & 2030
- 4.3. Segment Dashboard
- 4.4. Global Biliary Stents Market by Type Outlook
- 4.5. Market Size & Forecasts and Trend Analyses, 2018 to 2030 for the following
- 4.5.1. Metal
- 4.5.1.1. Market estimates and forecasts 2018 to 2030 (USD Million)
- 4.5.2. Polymer
- 4.5.2.1. Market estimates and forecasts 2018 to 2030 (USD Million)
- 4.5.3. Plastic
- 4.5.3.1. Market estimates and forecasts 2018 to 2030 (USD Million)
- 4.5.1. Metal
Chapter 5. Biliary Stents Market: Application Estimates & Trend Analysis
- 5.1. Definitions and Scope
- 5.1.1. Bilio-pancreatic Leakages
- 5.1.2. Pancreatic Cancer
- 5.1.3. Benign Biliary Structures
- 5.1.4. Gallstones
- 5.1.5. Others
- 5.2. Application Market Share, 2023 & 2030
- 5.3. Segment Dashboard
- 5.4. Global Biliary Stents Market by Application Outlook
- 5.5. Market Size & Forecasts and Trend Analyses, 2018 to 2030 for the following
- 5.5.1. Bilio-pancreatic Leakages
- 5.5.1.1. Market estimates and forecasts 2018 to 2030 (USD Million)
- 5.5.2. Pancreatic Cancer
- 5.5.2.1. Market estimates and forecasts 2018 to 2030 (USD Million)
- 5.5.3. Benign Biliary Structures
- 5.5.3.1. Market estimates and forecasts 2018 to 2030 (USD Million)
- 5.5.4. Gallstones
- 5.5.4.1. Market estimates and forecasts 2018 to 2030 (USD Million)
- 5.5.5. Others
- 5.5.5.1. Market estimates and forecasts 2018 to 2030 (USD Million)
- 5.5.1. Bilio-pancreatic Leakages
Chapter 6. Biliary Stents Market: End-use Estimates & Trend Analysis
- 6.1. Definitions and Scope
- 6.1.1. Hospitals
- 6.1.2. Ambulatory Surgical Centers
- 6.1.3. Others
- 6.2. End-use Market Share, 2023 & 2030
- 6.3. Segment Dashboard
- 6.4. Global Biliary Stents Market by End-use Outlook
- 6.5. Market Size & Forecasts and Trend Analyses, 2018 to 2030 for the following
- 6.5.1. Hospitals
- 6.5.1.1. Market estimates and forecasts 2018 to 2030 (USD Million)
- 6.5.2. Ambulatory Surgical Centers
- 6.5.2.1. Market estimates and forecasts 2018 to 2030 (USD Million)
- 6.5.3. Others
- 6.5.3.1. Market estimates and forecasts 2018 to 2030 (USD Million)
- 6.5.1. Hospitals
Chapter 7. Biliary Stents Market: Regional Estimates & Trend Analysis
- 7.1. Regional Market Share Analysis, 2023 & 2030
- 7.2. Regional Market Dashboard
- 7.3. Global Regional Market Snapshot
- 7.4. Market Size, & Forecasts Trend Analysis, 2018 to 2030:
- 7.5. North America
- 7.5.1. U.S.
- 7.5.1.1. U.S. market estimates and forecasts, 2018 - 2030 (USD Million)
- 7.5.2. Canada
- 7.5.2.1. Canada market estimates and forecasts, 2018 - 2030 (USD Million)
- 7.5.1. U.S.
- 7.6. Europe
- 7.6.1. UK
- 7.6.1.1. UK market estimates and forecasts, 2018 - 2030 (USD Million)
- 7.6.2. Germany
- 7.6.2.1. Germany market estimates and forecasts, 2018 - 2030 (USD Million)
- 7.6.3. France
- 7.6.3.1. France market estimates and forecasts, 2018 - 2030 (USD Million)
- 7.6.4. Italy
- 7.6.4.1. Italy market estimates and forecasts, 2018 - 2030 (USD Million)
- 7.6.5. Spain
- 7.6.5.1. Spain market estimates and forecasts, 2018 - 2030 (USD Million)
- 7.6.6. Norway
- 7.6.6.1. Norway market estimates and forecasts, 2018 - 2030 (USD Million)
- 7.6.7. Sweden
- 7.6.7.1. Sweden market estimates and forecasts, 2018 - 2030 (USD Million)
- 7.6.8. Denmark
- 7.6.8.1. Denmark market estimates and forecasts, 2018 - 2030 (USD Million)
- 7.6.1. UK
- 7.7. Asia Pacific
- 7.7.1. Japan
- 7.7.1.1. Japan market estimates and forecasts, 2018 - 2030 (USD Million)
- 7.7.2. China
- 7.7.2.1. China market estimates and forecasts, 2018 - 2030 (USD Million)
- 7.7.3. India
- 7.7.3.1. India market estimates and forecasts, 2018 - 2030 (USD Million)
- 7.7.4. Australia
- 7.7.4.1. Australia market estimates and forecasts, 2018 - 2030 (USD Million)
- 7.7.5. South Korea
- 7.7.5.1. South Korea market estimates and forecasts, 2018 - 2030 (USD Million)
- 7.7.6. Thailand
- 7.7.6.1. Thailand market estimates and forecasts, 2018 - 2030 (USD Million)
- 7.7.1. Japan
- 7.8. Latin America
- 7.8.1. Brazil
- 7.8.1.1. Brazil market estimates and forecasts, 2018 - 2030 (USD Million)
- 7.8.2. Mexico
- 7.8.2.1. Mexico market estimates and forecasts, 2018 - 2030 (USD Million)
- 7.8.3. Argentina
- 7.8.3.1. Argentina market estimates and forecasts, 2018 - 2030 (USD Million)
- 7.8.1. Brazil
- 7.9. MEA
- 7.9.1. South Africa
- 7.9.1.1. South Africa market estimates and forecasts, 2018 - 2030 (USD Million)
- 7.9.2. Saudi Arabia
- 7.9.2.1. Saudi Arabia market estimates and forecasts, 2018 - 2030 (USD Million)
- 7.9.3. UAE
- 7.9.3.1. UAE market estimates and forecasts, 2018 - 2030 (USD Million)
- 7.9.4. Kuwait
- 7.9.4.1. Kuwait market estimates and forecasts, 2018 - 2030 (USD Million)
- 7.9.1. South Africa
Chapter 8. Competitive Landscape
- 8.1. Recent Developments & Impact Analysis, By Key Market Participants
- 8.2. Company/Competition Categorization
- 8.2.1. Innovators
- 8.3. Vendor Landscape
- 8.3.1. List of key distributors and channel partners
- 8.3.2. Key customers
- 8.3.3. Key company market share analysis, 2023
- 8.3.4. Boston Scientific
- 8.3.4.1. Company overview
- 8.3.4.2. Financial performance
- 8.3.4.3. Product benchmarking
- 8.3.4.4. Strategic initiatives
- 8.3.5. Cook Group
- 8.3.5.1. Company overview
- 8.3.5.2. Financial performance
- 8.3.5.3. Product benchmarking
- 8.3.5.4. Strategic initiatives
- 8.3.6. ENDO-FLEX GmbH
- 8.3.6.1. Company overview
- 8.3.6.2. Financial performance
- 8.3.6.3. Product benchmarking
- 8.3.6.4. Strategic initiatives
- 8.3.7. Olympus Corporation
- 8.3.7.1. Company overview
- 8.3.7.2. Financial performance
- 8.3.7.3. Product benchmarking
- 8.3.7.4. Strategic initiatives
- 8.3.8. B Braun Melsungen
- 8.3.8.1. Company overview
- 8.3.8.2. Financial performance
- 8.3.8.3. Product benchmarking
- 8.3.8.4. Strategic initiatives
- 8.3.9. CONMED Corporation
- 8.3.9.1. Company overview
- 8.3.9.2. Financial performance
- 8.3.9.3. Product benchmarking
- 8.3.9.4. Strategic initiatives
- 8.3.10. M.I Tech
- 8.3.10.1. Company overview
- 8.3.10.2. Financial performance
- 8.3.10.3. Product benchmarking
- 8.3.10.4. Strategic initiatives
- 8.3.11. C.R.Bard (Becton, Dickinson & Company)
- 8.3.11.1. Company overview
- 8.3.11.2. Financial performance
- 8.3.11.3. Product benchmarking
- 8.3.11.4. Strategic initiatives
- 8.3.12. Medtronic plc
- 8.3.12.1. Company overview
- 8.3.12.2. Financial performance
- 8.3.12.3. Product benchmarking
- 8.3.12.4. Strategic initiatives
- 8.3.13. Cardinal Health
- 8.3.13.1. Company overview
- 8.3.13.2. Financial performance
- 8.3.13.3. Product benchmarking
- 8.3.13.4. Strategic initiatives
- 8.3.14. Merit Medical System
- 8.3.14.1. Company overview
- 8.3.14.2. Financial performance
- 8.3.14.3. Product benchmarking
- 8.3.14.4. Strategic initiatives

