|
|
市場調査レポート
商品コード
1587466
ステントの市場規模、シェア、動向分析レポート:製品別、材料別、最終用途別、地域別、セグメント予測、2025年~2030年Stents Market Size, Share & Trends Analysis Report By Product (Vascular, Non-vascular), By Material (Metallic, Non-metallic), By End-use (Hospitals, Ambulatory Care Centers, Specialty Clinics), By Region, And Segment Forecasts, 2025 - 2030 |
||||||
|
|||||||
カスタマイズ可能
|
|||||||

| ステントの市場規模、シェア、動向分析レポート:製品別、材料別、最終用途別、地域別、セグメント予測、2025年~2030年 |
|
出版日: 2024年10月29日
発行: Grand View Research
ページ情報: 英文 150 Pages
納期: 2~10営業日
|

全表示
- 概要
- 図表
- 目次
ステント市場の成長と動向:
Grand View Research, Inc.の最新レポートによると、世界のステント市場は2030年までに184億6,000万米ドルに達し、2025年から2030年までのCAGRは3.7%で成長すると予測されています。
同市場は、医療機器の継続的な技術進歩の影響を大きく受けています。薬剤溶出ステント(DES)などの技術革新は、心血管疾患の治療状況を一変させました。これらのステントは時間の経過とともに薬剤を放出するように設計されており、血管形成術後の再狭窄や血管の再狭窄を防ぐのに役立っています。さらに、材料科学の進歩により、時間の経過とともに溶解する生体吸収性ステントが開発され、永久的なインプラントに伴う長期的な合併症が減少しています。高度な画像診断技術と低侵襲手術法の統合もステント留置術の有効性と安全性を高め、市場の成長を促進しています。
心血管疾患(CVD)の世界の罹患率の上昇がステント市場の拡大に寄与しています。座りがちなライフスタイル、不健康な食生活、肥満や糖尿病の増加といった要因が、冠動脈疾患(CAD)などの有病率の上昇につながっています。CVDは依然として世界の罹患率と死亡率の主要原因の1つであるため、ステント留置術を含む効果的な治療オプションに対する需要が高まっています。この動向は、心臓関連の病気にかかりやすくなる高齢化によってさらに後押しされ、インターベンショナル・カーディオロジー・ソリューションの必要性を高めています。
ヘルスケアシステムによる好意的な償還政策は、病院やクリニックがより新しいステント留置技術を採用することを奨励しています。このような財政的支援は、これらの介入をより利用しやすくし、メーカーが次世代ステント製品の研究開発に投資する動機付けとなります。2024年6月、医療技術のリーダーであるロイヤル・フィリップスは、デュオ静脈ステントシステムの最初の埋め込みを発表しました。慢性静脈不全(CVI)患者の症候性静脈流出閉塞の治療用として承認されたこのデバイスは、米国FDAから市販前承認を受けた。
ステント市場レポートハイライト
- 製品別では、ステント留置などの介入を必要とする心血管疾患の有病率の高さから、血管分野が2024年に87.3%の最大売上シェアを占めました。再狭窄率を低下させる薬剤溶出ステントなど、ステント技術の進歩が血管セグメントの地位をさらに強固なものにしています。
- 非血管分野は、泌尿器科や消化器科など、心臓血管以外のさまざまな病状に適用されるため、予測期間中に最も速いCAGRで成長すると予想されます。
- 材料別では、金属製ステントが、その強度、柔軟性、高圧環境でも開存性を維持する能力により、2024年の市場シェア61.2%でこのセグメントを支配しています。金属ステントは、長期的な成功のために構造的完全性が重要な血管用途で特に有効です。
- 非金属ステント分野は、予測期間中に最も速いCAGRで成長する見込みです。生分解性ステントやポリマーベースステントを含む非金属ステントセグメントは、血栓症や炎症のリスクを低減できるなどの利点があるため、支持を集めています。
- エンドユーズ別では、総合的なインフラと高度な医療技術により、病院セグメントが2024年に最大の収益シェアを占めました。病院には、冠動脈形成術のようなステント留置を必要とする複雑な手技を実施できる専門施設と熟練した医療専門家が備わっています。
- 外来医療センター(ACS)分野は、従来の病院と比較して低コストで外来患者サービスを提供できることから、予測期間中に最も速いCAGRで成長すると予想されています。ASCは利便性と効率性を提供し、患者は長期入院の必要なくステント処置を受けることができます。
- 心血管系疾患(CVD)の罹患率の上昇により、2024年の市場は北米が支配的でした。ステント技術の絶え間ない革新により、その有効性と安全性が向上し、ヘルスケアプロバイダーと患者双方にとってより魅力的なものとなっています。アジア太平洋地域は予測期間中最も速いCAGRで成長すると予想されます。
- 2024年9月、レナータ・メディカル社は、8月のFDA承認に続き、ロサンゼルス小児病院の2歳児患者にMinima Growthステントを留置することに成功したと発表しました。これは、小児の先天性心疾患治療における大きな進歩であり、患者とともに成長するステントを提供し、従来のステントの限界に対処するものです。
目次
第1章 調査手法と範囲
第2章 エグゼクティブサマリー
第3章 市場の変数、動向、範囲
- 市場系統の見通し
- 親市場の見通し
- 関連/補助市場見通し
- 市場動向と展望
- 市場力学
- 市場抑制要因分析
- ビジネス環境分析
- SWOT分析;要因別(政治・法律、経済・技術)
- ポーターのファイブフォース分析
第4章 製品ビジネス分析
- ステント市場、製品別:主なポイント
- ステント市場:製品の動向と市場シェア分析、2024年と2030年
- 血管ステント
- 世界の血管ステント市場推計・予測、2018年-2030年
- 冠動脈ステント
- 末梢ステント
- 神経血管ステント
- 非血管ステント
- 世界の非血管ステント市場推計・予測、2018年-2030年
- 消化管ステント
- 肺(気道)ステント
- 泌尿器科用ステント
- その他
第5章 マテリアルビジネス分析
- ステント市場、材質別:主なポイント
- ステント市場:材料の動きと市場シェア分析、2024年と2030年
- 金属ステント
- 世界の金属ステント市場推計・予測、2018年-2030年
- 非金属ステント
- 世界の非金属ステント市場推計・予測、2018年-2030年
第6章 最終用途ビジネス分析
- ステント市場、最終用途別:主なポイント
- ステント市場:最終用途動向と市場シェア分析、2024年と2030年
- 病院
- 世界の病院市場推計・予測、2018年-2030年
- 外来ケアセンター(ACS)
- 世界の外来ケアセンター(ACS)市場推計・予測、2018年-2030年
- 専門クリニック
- 世界の専門クリニック市場推計・予測、2018年-2030年
第7章 地域ビジネス分析
- 地域市場のスナップショット
- 国別市場シェア分析、2024年
- 北米
- 欧州
- アジア太平洋
- ラテンアメリカ
- 中東・アフリカ
- 北米
- 北米のステント市場、2018年-2030年
- 米国
- カナダ
- メキシコ
- 欧州
- 欧州のステント市場、2018年-2030年
- ドイツ
- 英国
- フランス
- イタリア
- スペイン
- デンマーク
- スウェーデン
- ノルウェー
- アジア太平洋
- アジア太平洋地域のステント市場、2018年-2030年
- 日本
- 中国
- インド
- 韓国
- オーストラリア
- タイ
- ラテンアメリカ
- ラテンアメリカのステント市場、2018年-2030年
- ブラジル
- アルゼンチン
- 中東・アフリカ
- 中東・アフリカステント市場、2018-2030年
- 南アフリカ
- サウジアラビア
- アラブ首長国連邦
- クウェート
第8章 競合情勢
- 企業分類
- 戦略マッピング
- 企業プロファイル/上場企業
- Abbott Laboratories
- B. Braun Melsungen AG
- Biotronik SE &Co. KG
- Biosensors International Group, Ltd.
- Boston Scientific Corporation
- Elixir Medical Corporation
- Medtronic Plc
- Meril Life Science
- MicroPort Scientific Corporation
- Stryker
- Terumo Corporation
- BD
- WL Gore &Associates
List of Tables
- Table 1 List of Abbreviations
- Table 2 Global Stents Market, by product, 2018 - 2030 (USD Million)
- Table 3 Global Stents Market, by material, 2018 - 2030 (USD Million)
- Table 4 Global Stents Market, by end-use, 2018 - 2030 (USD Million)
- Table 5 Global Stents Market, by region, 2018 - 2030 (USD Million)
- Table 6 North America Stents Market, by country, 2018 - 2030 (USD Million)
- Table 7 North America Stents Market, by product, 2018 - 2030 (USD Million)
- Table 8 North America Stents Market, by material, 2018 - 2030 (USD Million)
- Table 9 North America Stents Market, by end-use, 2018 - 2030 (USD Million)
- Table 10 U.S. Stents Market, by product, 2018 - 2030 (USD Million)
- Table 11 U.S. Stents Market, by material, 2018 - 2030 (USD Million)
- Table 12 U.S. Stents Market, by end-use, 2018 - 2030 (USD Million)
- Table 13 Canada Stents Market, by product, 2018 - 2030 (USD Million)
- Table 14 Canada Stents Market, by material, 2018 - 2030 (USD Million)
- Table 15 Canada Stents Market, by end-use, 2018 - 2030 (USD Million)
- Table 16 Mexico Stents Market, by product, 2018 - 2030 (USD Million)
- Table 17 Mexico Stents Market, by material, 2018 - 2030 (USD Million)
- Table 18 Mexico Stents Market, by end-use, 2018 - 2030 (USD Million)
- Table 19 Europe Stents Market, by country, 2018 - 2030 (USD Million)
- Table 20 Europe Stents Market, by product, 2018 - 2030 (USD Million)
- Table 21 Europe Stents Market, by material, 2018 - 2030 (USD Million)
- Table 22 Europe Stents Market, by end-use, 2018 - 2030 (USD Million)
- Table 23 Germany Stents Market, by product, 2018 - 2030 (USD Million)
- Table 24 Germany Stents Market, by material, 2018 - 2030 (USD Million)
- Table 25 Germany Stents Market, by end-use, 2018 - 2030 (USD Million)
- Table 26 UK Stents Market, by product, 2018 - 2030 (USD Million)
- Table 27 UK Stents Market, by material, 2018 - 2030 (USD Million)
- Table 28 UK Stents Market, by end-use, 2018 - 2030 (USD Million)
- Table 29 France Stents Market, by product, 2018 - 2030 (USD Million)
- Table 30 France Stents Market, by material, 2018 - 2030 (USD Million)
- Table 31 France Stents Market, by end-use, 2018 - 2030 (USD Million)
- Table 32 Italy Stents Market, by product, 2018 - 2030 (USD Million)
- Table 33 Italy Stents Market, by material, 2018 - 2030 (USD Million)
- Table 34 Italy Stents Market, by end-use, 2018 - 2030 (USD Million)
- Table 35 Spain Stents Market, by product, 2018 - 2030 (USD Million)
- Table 36 Spain Stents Market, by material, 2018 - 2030 (USD Million)
- Table 37 Spain Stents Market, by end-use, 2018 - 2030 (USD Million)
- Table 38 Denmark Stents Market, by product, 2018 - 2030 (USD Million)
- Table 39 Denmark Stents Market, by material, 2018 - 2030 (USD Million)
- Table 40 Denmark Stents Market, by end-use, 2018 - 2030 (USD Million)
- Table 41 Sweden Stents Market, by product, 2018 - 2030 (USD Million)
- Table 42 Sweden Stents Market, by material, 2018 - 2030 (USD Million)
- Table 43 Sweden Stents Market, by end-use, 2018 - 2030 (USD Million)
- Table 44 Norway Stents Market, by product, 2018 - 2030 (USD Million)
- Table 45 Norway Stents Market, by material, 2018 - 2030 (USD Million)
- Table 46 Norway Stents Market, by end-use, 2018 - 2030 (USD Million)
- Table 47 Asia Pacific Stents Market, by country, 2018 - 2030 (USD Million)
- Table 48 Asia Pacific Stents Market, by product, 2018 - 2030 (USD Million)
- Table 49 Asia Pacific Stents Market, by material, 2018 - 2030 (USD Million)
- Table 50 Asia Pacific Stents Market, by end-use, 2018 - 2030 (USD Million)
- Table 51 China Stents Market, by product, 2018 - 2030 (USD Million)
- Table 52 China Stents Market, by material, 2018 - 2030 (USD Million)
- Table 53 China Stents Market, by end-use, 2018 - 2030 (USD Million)
- Table 54 Japan Stents Market, by product, 2018 - 2030 (USD Million)
- Table 55 Japan Stents Market, by material, 2018 - 2030 (USD Million)
- Table 56 Japan Stents Market, by end-use, 2018 - 2030 (USD Million)
- Table 57 India Stents Market, by product, 2018 - 2030 (USD Million)
- Table 58 India Stents Market, by material, 2018 - 2030 (USD Million)
- Table 59 India Stents Market, by end-use, 2018 - 2030 (USD Million)
- Table 60 South Korea Stents Market, by product, 2018 - 2030 (USD Million)
- Table 61 South Korea Stents Market, by material, 2018 - 2030 (USD Million)
- Table 62 South Korea Stents Market, by end-use, 2018 - 2030 (USD Million)
- Table 63 Australia Stents Market, by product, 2018 - 2030 (USD Million)
- Table 64 Australia Stents Market, by material, 2018 - 2030 (USD Million)
- Table 65 Australia Stents Market, by end-use, 2018 - 2030 (USD Million)
- Table 66 Thailand Stents Market, by product, 2018 - 2030 (USD Million)
- Table 67 Thailand Stents Market, by material, 2018 - 2030 (USD Million)
- Table 68 Thailand Stents Market, by end-use, 2018 - 2030 (USD Million)
- Table 69 Latin America Stents Market, by country, 2018 - 2030 (USD Million)
- Table 70 Latin America Stents Market, by product, 2018 - 2030 (USD Million)
- Table 71 Latin America Stents Market, by material, 2018 - 2030 (USD Million)
- Table 72 Latin America Stents Market, by end-use, 2018 - 2030 (USD Million)
- Table 73 Brazil Stents Market, by product, 2018 - 2030 (USD Million)
- Table 74 Brazil Stents Market, by material, 2018 - 2030 (USD Million)
- Table 75 Brazil Stents Market, by end-use, 2018 - 2030 (USD Million)
- Table 76 Argentina Stents Market, by product, 2018 - 2030 (USD Million)
- Table 77 Argentina Stents Market, by material, 2018 - 2030 (USD Million)
- Table 78 Argentina Stents Market, by end-use, 2018 - 2030 (USD Million)
- Table 79 Middle East & Africa Stents Market, by product, 2018 - 2030 (USD Million)
- Table 80 Middle East & Africa Stents Market, by material, 2018 - 2030 (USD Million)
- Table 81 Middle East & Africa Stents Market, by end-use, 2018 - 2030 (USD Million)
- Table 82 South Africa Stents Market, by product, 2018 - 2030 (USD Million)
- Table 83 South Africa Stents Market, by material, 2018 - 2030 (USD Million)
- Table 84 South Africa Stents Market, by end-use, 2018 - 2030 (USD Million)
- Table 85 Saudi Arabia Stents Market, by product, 2018 - 2030 (USD Million)
- Table 86 Saudi Arabia Stents Market, by material, 2018 - 2030 (USD Million)
- Table 87 Saudi Arabia Stents Market, by end-use, 2018 - 2030 (USD Million)
- Table 88 UAE Stents Market, by product, 2018 - 2030 (USD Million)
- Table 89 UAE Stents Market, by material, 2018 - 2030 (USD Million)
- Table 90 UAE Stents Market, by end-use, 2018 - 2030 (USD Million)
- Table 91 Kuwait Stents Market, by product, 2018 - 2030 (USD Million)
- Table 92 Kuwait Stents Market, by material, 2018 - 2030 (USD Million)
- Table 93 Kuwait Stents Market, by end-use, 2018 - 2030 (USD Million)
List of Figures
- Fig. 1 Market research process
- Fig. 2 Information procurement
- Fig. 3 Primary research pattern
- Fig. 4 Market research approaches
- Fig. 5 Value chain-based sizing & forecasting
- Fig. 6 Market formulation & validation
- Fig. 7 Stents Market segmentation
- Fig. 8 Market snapshot, 2024
- Fig. 9 Market trends & outlook
- Fig. 10 Market driver relevance analysis (current & future impact)
- Fig. 11 Market restraint relevance analysis (current & future impact)
- Fig. 12 Swot analysis, by factor (political & legal, economic and technological)
- Fig. 13 Porter's five forces analysis
- Fig. 14 Global Stents Market: Product Outlook Key Takeaways
- Fig. 15 Global Stents Market: Product Movement Analysis
- Fig. 16 Global Vascular Stents Market, 2018 - 2030 (USD Million)
- Fig. 17 Global Coronary Stents Market, 2018 - 2030 (USD Million)
- Fig. 18 Global Peripheral Stents Market, 2018 - 2030 (USD Million)
- Fig. 19 Global Neurovascular Stents Market, 2018 - 2030 (USD Million)
- Fig. 20 Global Non-vascular Stents Market, 2018 - 2030 (USD Million)
- Fig. 21 Global Gastrointestinal Stents Market, 2018 - 2030 (USD Million)
- Fig. 22 Global Pulmonary (Airway) Stents Market, 2018 - 2030 (USD Million)
- Fig. 23 Global Urological Stents Market, 2018 - 2030 (USD Million)
- Fig. 24 Global Others Market, 2018 - 2030 (USD Million)
- Fig. 25 Global Stents Market: Material Outlook Key Takeaways
- Fig. 26 Global Stents Market: Material Movement Analysis
- Fig. 27 Global Metallic Stents Market, 2018 - 2030 (USD Million)
- Fig. 28 Global Non-metallic Stents Market, 2018 - 2030 (USD Million)
- Fig. 29 Global Stents Market: End-use Outlook Key Takeaways
- Fig. 30 Global Stents Market: End-use Movement Analysis
- Fig. 31 Global Hospitals Market, 2018 - 2030 (USD Million)
- Fig. 32 Global Ambulatory Care Centers (ACS) Market, 2018 - 2030 (USD Million)
- Fig. 33 Global Specialty Clinics Market, 2018 - 2030 (USD Million)
- Fig. 34 Regional Marketplace: Key Takeaways
- Fig. 35 Regional outlook, 2024 & 2030
- Fig. 36 Global Stents Market: Region Movement Analysis
- Fig. 37 North America Stents Market, 2018 - 2030 (USD Million)
- Fig. 38 U.S. Stents Market, 2018 - 2030 (USD Million)
- Fig. 39 Canada Stents Market, 2018 - 2030 (USD Million)
- Fig. 40 Mexico Stents Market, 2018 - 2030 (USD Million)
- Fig. 41 Europe Stents Market, 2018 - 2030 (USD Million)
- Fig. 42 Germany Stents Market, 2018 - 2030 (USD Million)
- Fig. 43 UK Stents Market, 2018 - 2030 (USD Million)
- Fig. 44 France Stents Market, 2018 - 2030 (USD Million)
- Fig. 45 Italy Stents Market, 2018 - 2030 (USD Million)
- Fig. 46 Spain Stents Market, 2018 - 2030 (USD Million)
- Fig. 47 Spain Stents Market, 2018 - 2030 (USD Million)
- Fig. 48 Denmark Stents Market, 2018 - 2030 (USD Million)
- Fig. 49 Sweden Stents Market, 2018 - 2030 (USD Million)
- Fig. 50 Norway Stents Market, 2018 - 2030 (USD Million)
- Fig. 51 Asia pacific Stents Market, 2018 - 2030 (USD Million)
- Fig. 52 Japan Stents Market, 2018 - 2030 (USD Million)
- Fig. 53 China Stents Market, 2018 - 2030 (USD Million)
- Fig. 54 India Stents Market, 2018 - 2030 (USD Million)
- Fig. 55 Australia Stents Market, 2018 - 2030 (USD Million)
- Fig. 56 South Korea Stents Market, 2018 - 2030 (USD Million)
- Fig. 57 Thailand Stents Market, 2018 - 2030 (USD Million)
- Fig. 58 Latin America Stents Market, 2018 - 2030 (USD Million)
- Fig. 59 Brazil Stents Market, 2018 - 2030 (USD Million)
- Fig. 60 Argentina Stents Market, 2018 - 2030 (USD Million)
- Fig. 61 Middle East and Africa Stents Market, 2018 - 2030 (USD Million)
- Fig. 62 South Africa Stents Market, 2018 - 2030 (USD Million)
- Fig. 63 Saudi Arabia Stents Market, 2018 - 2030 (USD Million)
- Fig. 64 UAE Stents Market, 2018 - 2030 (USD Million)
- Fig. 65 Kuwait Stents Market, 2018 - 2030 (USD Million)
Stents Market Growth & Trends:
The global stents market is anticipated to reach USD 18.46 billion by 2030 and is anticipated to grow at a CAGR of 3.7% from 2025 to 2030, according to a new report by Grand View Research, Inc. The market is significantly influenced by ongoing technological advancements in medical devices. Innovations such as drug-eluting stents (DES) have transformed the treatment landscape for cardiovascular diseases. These stents are designed to release medication over time, which helps to prevent restenosis, or the re-narrowing of blood vessels after angioplasty. Furthermore, advancements in materials science have led to the development of bioresorbable stents that dissolve over time, reducing long-term complications associated with permanent implants. The integration of advanced imaging techniques and minimally invasive surgical methods also enhances the efficacy and safety of stent placement procedures, thereby driving market growth.
Rising incidence of cardiovascular diseases (CVDs) globally contributes to the expansion of stents market. Factors such as sedentary lifestyles, unhealthy diets, and increasing rates of obesity and diabetes have led to a higher prevalence of conditions like coronary artery disease (CAD). As CVD remains one of the leading causes of morbidity and mortality worldwide, there is a growing demand for effective treatment options, including stenting procedures. This trend is further supported by an aging population that is more susceptible to heart-related ailments, thus propelling the need for interventional cardiology solutions.
Favorable reimbursement policies from healthcare systems encourage hospitals and clinics to adopt newer stenting technologies. This financial support makes these interventions more accessible and incentivizes manufacturers to invest in research and development for next-generation stent products. In June 2024, Royal Philips, a leader in health technology, announced the first implantation of the Duo Venous Stent System. This device, approved for treating symptomatic venous outflow obstruction in chronic venous insufficiency (CVI) patients, received premarket approval from the U.S. FDA.
Stents Market Report Highlights:
- Based on product, vascular segment held largest revenue share of 87.3% in 2024 due to the high prevalence of cardiovascular diseases, which necessitate interventions such as stent placements. Advancements in stent technology, including drug-eluting stents that reduce restenosis rates, have further solidified the vascular segment's position.
- Non-vascular segment is expected to grow at the fastest CAGR over the forecast period owing to its application in various medical conditions beyond cardiovascular issues, such as urology and gastroenterology.
- Based on material, metallic stents segment dominated the segment with a market share of 61.2% in 2024 due to their strength, flexibility, and ability to maintain patency in high-pressure environments. They are particularly effective in vascular applications, where structural integrity is crucial for long-term success.
- Non-metallic stents segment is expected to grow at the fastest CAGR over the forecast period. The non-metallic segment, including biodegradable and polymer-based stents, is gaining traction because they offer advantages such as reduced risk of thrombosis and inflammation.
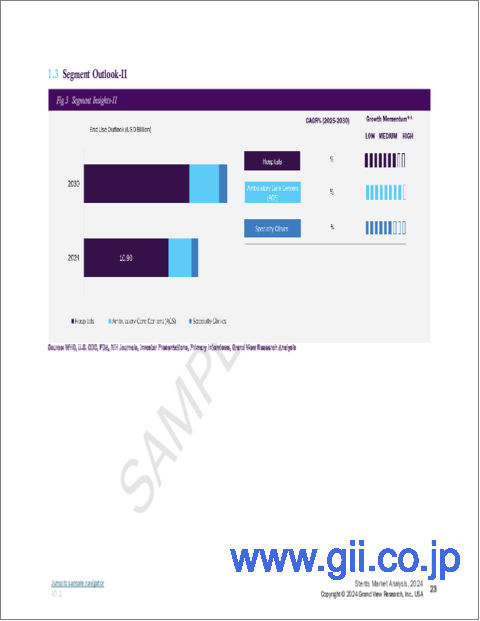
- Based on end use, hospitals segment held the largest revenue share in 2024 by end use due to their comprehensive infrastructure and advanced medical technology. Hospitals are equipped with specialized facilities and skilled healthcare professionals capable of performing complex procedures that require stent implantation, such as coronary angioplasty.
- Ambulatory care centers (ACS) segment is expected to grow at the fastest CAGR over the forecast period owing to their ability to provide outpatient services at lower costs compared to traditional hospitals. ASCs offer convenience and efficiency, allowing patients to undergo stent procedures without the need for extended hospital stays.
- North America dominated the market in 2024 due to rising incidence of cardiovascular diseases (CVDs). Continuous innovations in stent technology enhance their effectiveness and safety, making them more appealing to healthcare providers and patients alike. Asia Pacific is expected to grow at the fastest CAGR over the forecast period.
- In September 2024, Renata Medical announced the successful implantation of its Minima Growth Stent in a 2-year-old patient at Children's Hospital Los Angeles, following its recent FDA approval in August. This marks a significant advancement in treating pediatric congenital heart defects, offering a stent that grows with the patient and addresses the limitations of traditional stents.
Table of Contents
Chapter 1. Methodology and Scope
- 1.1. Market Segmentation & Scope
- 1.2. Market Definitions
- 1.3. Information Procurement
- 1.3.1. Purchased Database
- 1.3.2. GVR's Internal Database
- 1.3.3. Secondary Sources & Third-Party Perspectives
- 1.3.4. Primary Research
- 1.3.5. Details of Primary Research
- 1.4. Information Analysis
- 1.4.1. Data Analysis Models
- 1.5. Market Formulation & Data Visualization
- 1.5.1. Commodity Flow Analysis
- 1.5.1.1. Approach 1: Commodity flow approach
- 1.5.1. Commodity Flow Analysis
- 1.6. Data Validation & Publishing
- 1.7. Global Market: CAGR Calculation
- 1.8. List of Secondary Sources
- 1.9. List of Primary Sources
Chapter 2. Executive Summary
- 2.1. Market Snapshot
- 2.2. Segment Snapshot
- 2.3. Competitive Landscape Snapshot
Chapter 3. Market Variables, Trends, & Scope
- 3.1. Market Lineage Outlook
- 3.1.1. Parent Market Outlook
- 3.1.2. Related/Ancillary Market Outlook
- 3.2. Market Trends and Outlook
- 3.3. Market Dynamics
- 3.4. Market Restraint Analysis
- 3.5. Business Environment Analysis
- 3.5.1. SWOT Analysis; By Factor (Political & Legal, Economic and Technological)
- 3.5.2. Porter's Five Forces Analysis
Chapter 4. Product Business Analysis
- 4.1. Stents Market, By Product: Key Takeaways
- 4.2. Stents Market: Product Movement & Market Share Analysis, 2024 & 2030
- 4.3. Vascular Stents
- 4.3.1. Global Vascular Stents Market Estimates and Forecasts, 2018 - 2030 (USD Million)
- 4.3.2. Coronary Stents
- 4.3.2.1. Global Coronary Stents Market Estimates and Forecasts, 2018 - 2030 (USD Million)
- 4.3.3. Peripheral Stents
- 4.3.3.1. Global Peripheral Stents Market Estimates and Forecasts, 2018 - 2030 (USD Million)
- 4.3.3.2. Iliac Artery Stents
- 4.3.3.2.1. Global Iliac Artery Stents Market Estimates and Forecasts, 2018 - 2030 (USD Million)
- 4.3.3.3. Femoral Artery Stents
- 4.3.3.3.1. Global Femoral Artery Stents Market Estimates and Forecasts, 2018 - 2030 (USD Million)
- 4.3.3.4. Carotid Artery Stents
- 4.3.3.4.1. Global Carotid Artery Stents Market Estimates and Forecasts, 2018 - 2030 (USD Million)
- 4.3.3.5. Renal Artery Stents
- 4.3.3.5.1. Global Renal Artery Stents Market Estimates and Forecasts, 2018 - 2030 (USD Million)
- 4.3.3.6. Other Peripheral Stents
- 4.3.3.6.1. Global Other Peripheral Stents Market Estimates and Forecasts, 2018 - 2030 (USD Million)
- 4.3.4. Neurovascular Stents
- 4.3.4.1. Global Neurovascular Stents Market Estimates and Forecasts, 2018 - 2030 (USD Million)
- 4.3.4.2. Intracranial Stents
- 4.3.4.2.1. Global Intracranial Stents Market Estimates and Forecasts, 2018 - 2030 (USD Million)
- 4.3.4.3. Flow Diverters
- 4.3.4.3.1. Global Flow Diverters Market Estimates and Forecasts, 2018 - 2030 (USD Million)
- 4.4. Non-vascular Stents
- 4.4.1. Global Non-vascular Stents Market Estimates and Forecasts, 2018 - 2030 (USD Million)
- 4.4.2. Gastrointestinal Stents
- 4.4.2.1. Global Gastrointestinal Stents Market Estimates and Forecasts, 2018 - 2030 (USD Million)
- 4.4.2.2. Biliary
- 4.4.2.2.1. Global Biliary Market Estimates and Forecasts, 2018 - 2030 (USD Million)
- 4.4.2.3. Duodenal
- 4.4.2.3.1. Global Duodenal Market Estimates and Forecasts, 2018 - 2030 (USD Million)
- 4.4.2.4. Colonic
- 4.4.2.4.1. Global Colonic Market Estimates and Forecasts, 2018 - 2030 (USD Million)
- 4.4.2.5. Pancreatic
- 4.4.2.5.1. Global Pancreatic Market Estimates and Forecasts, 2018 - 2030 (USD Million)
- 4.4.2.6. Esophageal Stents
- 4.4.2.6.1. Global Esophageal Stents Market Estimates and Forecasts, 2018 - 2030 (USD Million)
- 4.4.3. Pulmonary (Airway) Stents
- 4.4.3.1. Global Pulmonary (Airway) Stents Market Estimates and Forecasts, 2018 - 2030 (USD Million)
- 4.4.3.2. Silicone Airway
- 4.4.3.2.1. Global Silicone Airway Market Estimates and Forecasts, 2018 - 2030 (USD Million)
- 4.4.3.3. Metallic Airway
- 4.4.3.3.1. Global Metallic Airway Market Estimates and Forecasts, 2018 - 2030 (USD Million)
- 4.4.4. Urological Stents
- 4.4.4.1. Global Urological Stents Market Estimates and Forecasts, 2018 - 2030 (USD Million)
- 4.4.5. Others
- 4.4.5.1. Global Others Market Estimates and Forecasts, 2018 - 2030 (USD Million)
Chapter 5. Material Business Analysis
- 5.1. Stents Market, By Material: Key Takeaways
- 5.2. Stents Market: Material Movement & Market Share Analysis, 2024 & 2030
- 5.3. Metallic Stents
- 5.3.1. Global Metallic Stents Market Estimates and Forecasts, 2018 - 2030 (USD Million)
- 5.4. Non-metallic Stents
- 5.4.1. Global Non-metallic Stents Market Estimates and Forecasts, 2018 - 2030 (USD Million)
Chapter 6. End-Use Business Analysis
- 6.1. Stents Market, By End-use: Key Takeaways
- 6.2. Stents Market: End-use Movement & Market Share Analysis, 2024 & 2030
- 6.3. Hospitals
- 6.3.1. Global Hospitals Market Estimates and Forecasts, 2018 - 2030 (USD Million)
- 6.4. Ambulatory Care Centers (ACS)
- 6.4.1. Global Ambulatory Care Centers (ACS) Market Estimates and Forecasts, 2018 - 2030 (USD Million)
- 6.5. Specialty Clinics
- 6.5.1. Global Specialty Clinics Market Estimates and Forecasts, 2018 - 2030 (USD Million)
Chapter 7. Regional Business Analysis
- 7.1. Regional Market Snapshot
- 7.2. Market Share Analysis by Country, 2024
- 7.2.1. North America
- 7.2.2. Europe
- 7.2.3. Asia Pacific
- 7.2.4. Latin America
- 7.2.5. MEA
- 7.3. North America
- 7.3.1. North America Stents Market, 2018 - 2030 (USD Million)
- 7.3.2. U.S.
- 7.3.2.1. U.S. Stents Market, 2018 - 2030 (USD Million)
- 7.3.3. Canada
- 7.3.3.1. Canada Stents Market, 2018 - 2030 (USD Million)
- 7.3.4. Mexico
- 7.3.4.1. Mexico Stents Market, 2018 - 2030 (USD Million)
- 7.4. Europe
- 7.4.1. Europe Stents Market, 2018 - 2030 (USD Million)
- 7.4.2. Germany
- 7.4.2.1. Germany Stents Market, 2018 - 2030 (USD Million)
- 7.4.3. UK
- 7.4.3.1. UK Stents Market, 2018 - 2030 (USD Million)
- 7.4.4. France
- 7.4.4.1. France Stents Market, 2018 - 2030 (USD Million)
- 7.4.5. Italy
- 7.4.5.1. Italy Stents Market, 2018 - 2030 (USD Million)
- 7.4.6. Spain
- 7.4.6.1. Spain Stents Market, 2018 - 2030 (USD Million)
- 7.4.7. Denmark
- 7.4.7.1. Denmark Stents Market, 2018 - 2030 (USD Million)
- 7.4.8. Sweden
- 7.4.8.1. Sweden Stents Market, 2018 - 2030 (USD Million)
- 7.4.9. Norway
- 7.4.9.1. Norway Stents Market, 2018 - 2030 (USD Million)
- 7.5. Asia Pacific
- 7.5.1. Asia Pacific Stents Market, 2018 - 2030 (USD Million)
- 7.5.2. Japan
- 7.5.2.1. Japan Stents Market, 2018 - 2030 (USD Million)
- 7.5.3. China
- 7.5.3.1. China Stents Market, 2018 - 2030 (USD Million)
- 7.5.4. India
- 7.5.4.1. India Stents Market, 2018 - 2030 (USD Million)
- 7.5.5. South Korea
- 7.5.5.1. South Korea Stents Market, 2018 - 2030 (USD Million)
- 7.5.6. Australia
- 7.5.6.1. Australia Stents Market, 2018 - 2030 (USD Million)
- 7.5.7. Thailand
- 7.5.7.1. Thailand Stents Market, 2018 - 2030 (USD Million)
- 7.6. Latin America
- 7.6.1. Latin America Stents Market, 2018 - 2030 (USD Million)
- 7.6.2. Brazil
- 7.6.2.1. Brazil Stents Market, 2018 - 2030 (USD Million)
- 7.6.3. Argentina
- 7.6.3.1. Argentina Stents Market, 2018 - 2030 (USD Million)
- 7.7. MEA
- 7.7.1. MEA Stents Market, 2018 - 2030 (USD Million)
- 7.7.2. South Africa
- 7.7.2.1. South Africa Stents Market, 2018 - 2030 (USD Million)
- 7.7.3. Saudi Arabia
- 7.7.3.1. Saudi Arabia Stents Market, 2018 - 2030 (USD Million)
- 7.7.4. UAE
- 7.7.4.1. UAE Stents Market, 2018 - 2030 (USD Million)
- 7.7.5. Kuwait
- 7.7.5.1. Kuwait Stents Market, 2018 - 2030 (USD Million)
Chapter 8. Competitive Landscape
- 8.1. Company Categorization
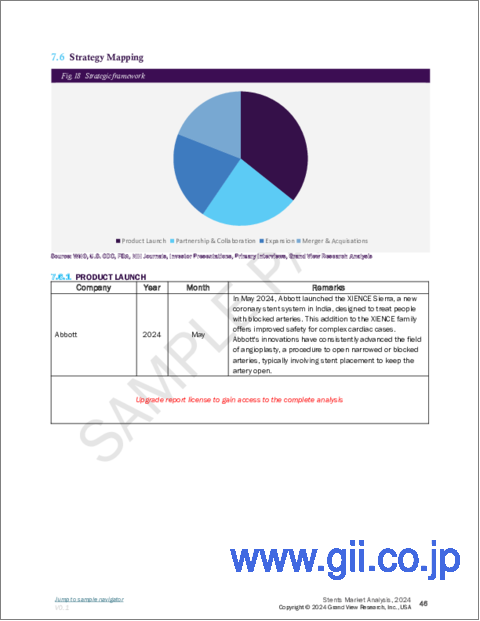
- 8.2. Strategy Mapping
- 8.3. Company Profiles/Listing
- 8.3.1. Abbott Laboratories
- 8.3.1.1. Overview
- 8.3.1.2. Financial Performance
- 8.3.1.3. Product Benchmarking
- 8.3.1.4. Strategic Initiatives
- 8.3.2. B. Braun Melsungen AG
- 8.3.2.1. Overview
- 8.3.2.2. Financial Performance
- 8.3.2.3. Product Benchmarking
- 8.3.2.4. Strategic Initiatives
- 8.3.3. Biotronik SE & Co. KG
- 8.3.3.1. Overview
- 8.3.3.2. Financial Performance
- 8.3.3.3. Product Benchmarking
- 8.3.3.4. Strategic Initiatives
- 8.3.4. Biosensors International Group, Ltd.
- 8.3.4.1. Overview
- 8.3.4.2. Financial Performance
- 8.3.4.3. Product Benchmarking
- 8.3.4.4. Strategic Initiatives
- 8.3.5. Boston Scientific Corporation
- 8.3.5.1. Overview
- 8.3.5.2. Financial Performance
- 8.3.5.3. Product Benchmarking
- 8.3.5.4. Strategic Initiatives
- 8.3.6. Elixir Medical Corporation
- 8.3.6.1. Overview
- 8.3.6.2. Financial Performance
- 8.3.6.3. Product Benchmarking
- 8.3.6.4. Strategic Initiatives
- 8.3.7. Medtronic Plc
- 8.3.7.1. Overview
- 8.3.7.2. Financial Performance
- 8.3.7.3. Product Benchmarking
- 8.3.7.4. Strategic Initiatives
- 8.3.8. Meril Life Science
- 8.3.8.1. Company Overview
- 8.3.8.2. Financial Performance
- 8.3.8.3. Platform Benchmarking
- 8.3.8.4. Strategic Initiatives
- 8.3.9. MicroPort Scientific Corporation
- 8.3.9.1. Company Overview
- 8.3.9.2. Financial Performance
- 8.3.9.3. Platform Benchmarking
- 8.3.9.4. Strategic Initiatives
- 8.3.10. Stryker
- 8.3.10.1. Company Overview
- 8.3.10.2. Financial Performance
- 8.3.10.3. Platform Benchmarking
- 8.3.10.4. Strategic Initiatives
- 8.3.11. Terumo Corporation
- 8.3.11.1. Company Overview
- 8.3.11.2. Financial Performance
- 8.3.11.3. Platform Benchmarking
- 8.3.11.4. Strategic Initiatives
- 8.3.12. BD
- 8.3.12.1. Company Overview
- 8.3.12.2. Financial Performance
- 8.3.12.3. Platform Benchmarking
- 8.3.12.4. Strategic Initiatives
- 8.3.13. W.L Gore & Associates
- 8.3.13.1. Company Overview
- 8.3.13.2. Financial Performance
- 8.3.13.3. Platform Benchmarking
- 8.3.13.4. Strategic Initiatives
- 8.3.1. Abbott Laboratories

