|
|
市場調査レポート
商品コード
1611682
クリーンルーム技術の市場規模、シェア、動向分析レポート:製品別、クリーンルームタイプ別、サービス別、産業別、地域別、セグメント別予測:2025年~2030年Cleanroom Technology Market Size, Share & Trends Analysis Report By Product, Cleanroom Type, By Service, By Industry Vertical, By Region, And Segment Forecasts 2025 - 2030 |
||||||

|
|||||||
カスタマイズ可能
|
|||||||

| クリーンルーム技術の市場規模、シェア、動向分析レポート:製品別、クリーンルームタイプ別、サービス別、産業別、地域別、セグメント別予測:2025年~2030年 |
|
出版日: 2024年11月22日
発行: Grand View Research
ページ情報: 英文 120 Pages
納期: 2~10営業日
|

全表示
- 概要
- 図表
- 目次
クリーンルーム技術市場の成長と動向
Grand View Research, Inc.の最新レポートによると、世界のクリーンルーム技術市場規模は2030年までに108億2,000万米ドルに達する見込みです。
同市場は2025~2030年にかけてCAGR 5.9%で成長すると予測されています。
クリーンルーム技術とは、空気中の粒子、汚染物質、温度、湿度、その他の環境特性のレベルを調整した雰囲気を維持するための専門技術、ツール、設備の集合体を指します。クリーンルームは、バイオテクノロジー、エレクトロニクス、製薬、医療など、さまざまな産業における工業プロセスの完全性と水準を維持するために不可欠です。これらの環境では、汚染を避けるために温度、湿度、換気、粒子数を管理する厳格なガイドラインが守られています。モニタリング・制御システム、空気濾過装置、先進的HVACシステムは、クリーンルーム技術に不可欠な要素です。クリーンルーム施設で働く従業員は通常、厳格なガイドラインに従わなければならず、これには汚染リスクを低減するための防護服、手袋、フードなどの防護具の着用が含まれます。クリーンルーム技術は、半導体製造から無菌医療環境まで、あらゆるセグメントで応用されています。クリーンルーム技術は、現代の産産業からの厳しい要求に応えるべく常に開発されており、汚染のない高品質な製品の生産を保証しています。
クリーンルーム技術は、製薬産業やバイオテクノロジー産業が製品の品質を維持し、厳しい規制を遵守するために取り組む中で、高い需要があります。さらに、ナノ技術や微細加工技術が進歩し続ける中、電子機器や半導体製造などのセグメントでは、生産物の精度と信頼性を保証するクリーンルーム設備への依存度が高まっています。小型化への動きは、より衛生的で規制された製造環境の必要性を高めています。世界の規制機関は、重要な産業における製造手順の基準を強化しています。企業は、クリーンルーム技術によって厳しい要件を積極的に遵守することで、製品の安全性と品質を確保することができます。
技術の飛躍的進歩と製造プロセスにおける品質管理の重視の高まりは、クリーンルーム技術セグメントに革命的な時代をもたらしています。クリーンルーム技術の需要は、産産業が最高水準に到達しようとするにつれて増加すると予測され、市場の参入企業に魅力的な展望を提供しています。
クリーンルーム技術市場レポートハイライト
- 消耗品セグメントは2024年に55.2%のシェアで市場を独占し、予測期間中のCAGRは5.4%。
- ハードウォールクリーンルーム部門が45.3%のシェアで市場を独占。予測期間中のCAGRは6.6%と最速の成長が見込まれます。
- プロフェッショナルサービスセグメントは、2024年に66.1%のシェアで市場を独占しました。予測期間中のCAGRは5.3%と予測されています。
- 医療セグメントは2024年の収益シェア62.3%で市場を独占し、予測期間中のCAGRは6.3%で最速となります。
目次
第1章 調査手法と範囲
第2章 エグゼクティブサマリー
第3章 クリーンルーム技術市場の変数、動向、範囲
- 市場系統の展望
- 市場力学
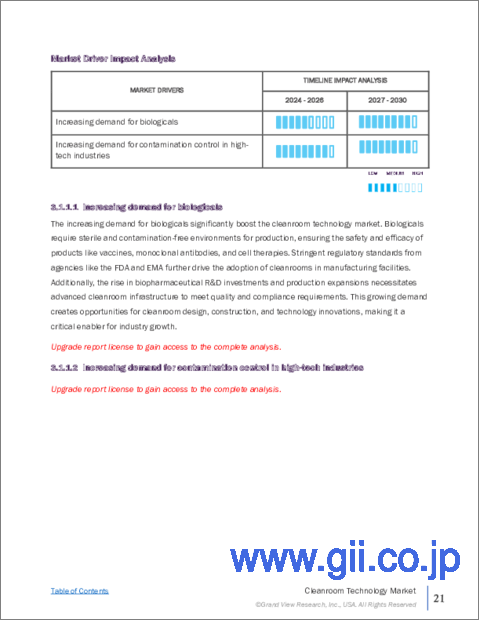
- 市場促進要因分析
- 市場抑制要因分析
- 産業の課題
- クリーンルーム技術市場分析ツール
- 産業分析-ポーターのファイブフォース分析
- PESTEL分析
- 問題点分析
第4章 クリーンルーム技術市場:製品別、推定・動向分析
- セグメントダッシュボード
- クリーンルーム技術市場:製品の変動分析、2024年と2030年
- 装置
- ファンフィルターユニット(FFU)
- HVACシステム
- 層流空気システムとバイオセーフティキャビネット
- HEPAフィルター
- その他
- 消耗品
- 安全消耗品
- クリーニング消耗品
第5章 クリーンルーム技術市場: クリーンルームタイプ別、推定・動向分析
- セグメントダッシュボード
- クリーンルーム技術市場:クリーンルームタイプの変動分析、2024年と2030年
- ソフトウォールクリーンルーム
- ハードウォールクリーンルーム
- リジッドウォールクリーンルーム
- その他
第6章 クリーンルーム技術市場:サービスタイプ別、推定・動向分析
- セグメントダッシュボード
- クリーンルーム技術市場:サービスタイプの変動分析、2024年と2030年
- プロフェッショナルサービス
- コンサルティングサービス
- 予算編成と計画サービス
- 設計とエンジニアリングサービス
- 建設と組立サービス
- 検査と認証サービス
- 予防保守サービス
- マネージドサービス
第7章 クリーンルーム技術市場:産業別、推定・動向分析
- セグメントダッシュボード
- クリーンルーム技術市場:産業の変動分析、2024年と2030年
- 半導体・エレクトロニクス
- 飲食品
- 医療
- 自動車
- 航空宇宙
- その他
第8章 クリーンルーム技術市場:地域別、推定・動向分析
- クリーンルーム技術の市場シェア、地域別、2024年と203年
- 北米
- 米国
- カナダ
- メキシコ
- 欧州
- 英国
- ドイツ
- フランス
- アジア太平洋
- 中国
- 日本
- インド
- 韓国
- オーストラリア
- ラテンアメリカ
- ブラジル
- 中東・アフリカ
- アラブ首長国連邦
- サウジアラビア
- 南アフリカ
第9章 競合情勢
- 企業分類
- 企業の市場ポジショニング
- 企業ヒートマップ分析
- 企業プロファイル/上場企業
- Advanced Technology Group
- CIMTechniques(SmartScan Technologies)
- Cleanrooms By United
- Angstrom Technology
- Elsisan(YI-BA Engineering. Ltd. Sti.)
- HEMCO Corporation
- Kojair Tech Oy
- Spetec GmbH
- Terra Universal Inc.
- Thomas Scientific
List of Tables
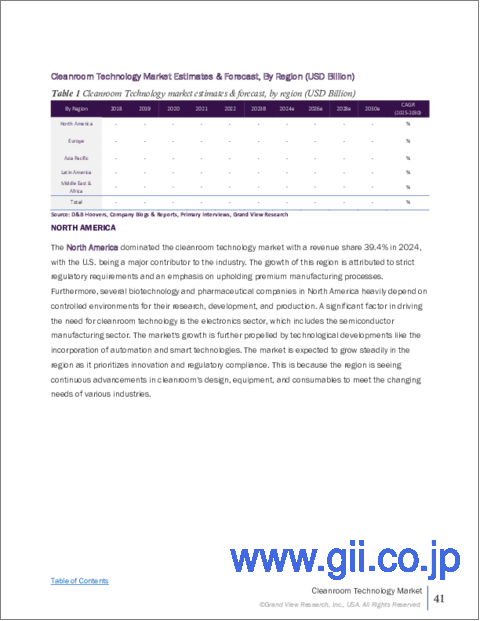
- Table 1 Global Cleanroom Technology market size estimates & forecasts, 2017 - 2030 (USD Million)
- Table 2 Global Cleanroom Technology market, by region, 2017 - 2030 (USD Million)
- Table 3 Global Cleanroom Technology market, by Product, 2017 - 2030 (USD Million)
- Table 4 Global Cleanroom Technology market, by Cleanroom Type, 2017 - 2030 (USD Million)
- Table 5 Global Cleanroom Technology market, by Service Type, 2017 - 2030 (USD Million)
- Table 6 Global Cleanroom Technology market, by Industry Vertical, 2017 - 2030 (USD Million)
- Table 7 Equipment Cleanroom Technology market, by region, 2017 - 2030 (USD Million)
- Table 8 Fan Filter Units (FFU) Cleanroom Technology market, by region, 2017 - 2030 (USD Million)
- Table 9 HVAC Systems Cleanroom Technology market, by region, 2017 - 2030 (USD Million)
- Table 10 Laminar Air Flow Systems and Biosafety Cabinets Cleanroom Technology market, by region, 2017 - 2030 (USD Million)
- Table 11 HEPA Filters Cleanroom Technology market, by region, 2017 - 2030 (USD Million)
- Table 12 Others Cleanroom Technology market, by region, 2017 - 2030 (USD Million)
- Table 13 Consumables Cleanroom Technology market, by region, 2017 - 2030 (USD Million)
- Table 14 Safety Consumables Cleanroom Technology market, by region, 2017 - 2030 (USD Million)
- Table 15 Gloves Cleanroom Technology market, by region, 2017 - 2030 (USD Million)
- Table 16 Apparel Cleanroom Technology market, by region, 2017 - 2030 (USD Million)
- Table 17 Other Safety Consumables Cleanroom Technology market, by region, 2017 - 2030 (USD Million)
- Table 18 Cleaning Consumables Cleanroom Technology market, by region, 2017 - 2030 (USD Million)
- Table 19 Wipes Cleanroom Technology market, by region, 2017 - 2030 (USD Million)
- Table 20 Disinfectants Cleanroom Technology market, by region, 2017 - 2030 (USD Million)
- Table 21 Other Cleaning Consumables Cleanroom Technology market, by region, 2017 - 2030 (USD Million)
- Table 22 Softwall Cleanroom Cleanroom Technology market, by region, 2017 - 2030 (USD Million)
- Table 23 Hardwall Cleanroom Cleanroom Technology market, by region, 2017 - 2030 (USD Million)
- Table 24 Rigidwall Cleanroom Cleanroom Technology market, by region, 2017 - 2030 (USD Million)
- Table 25 Others Cleanroom Technology market, by region, 2017 - 2030 (USD Million)
- Table 26 Professional Services Cleanroom Technology market, by region, 2017 - 2030 (USD Million)
- Table 27 Consultation Services Cleanroom Technology market, by region, 2017 - 2030 (USD Million)
- Table 28 Budgeting and Planning Services Cleanroom Technology market, by region, 2017 - 2030 (USD Million)
- Table 29 Design and Engineering Services Cleanroom Technology market, by region, 2017 - 2030 (USD Million)
- Table 30 Construction and Assembly Services Cleanroom Technology market, by region, 2017 - 2030 (USD Million)
- Table 31 Testing and Certification Services Cleanroom Technology market, by region, 2017 - 2030 (USD Million)
- Table 32 Preventative Maintenance Services Cleanroom Technology market, by region, 2017 - 2030 (USD Million)
- Table 33 Managed Services Cleanroom Technology market, by region, 2017 - 2030 (USD Million)
- Table 34 Semiconductor & Electronics Cleanroom Technology market, by region, 2017 - 2030 (USD Million)
- Table 35 Food & Beverages Cleanroom Technology market, by region, 2017 - 2030 (USD Million)
- Table 36 Healthcare Cleanroom Technology market, by region, 2017 - 2030 (USD Million)
- Table 37 Automotive Cleanroom Technology market, by region, 2017 - 2030 (USD Million)
- Table 38 Aerospace Cleanroom Technology market, by region, 2017 - 2030 (USD Million)
- Table 39 Others Cleanroom Technology market, by region, 2017 - 2030 (USD Million)
- Table 40 North America Cleanroom Technology market, by Product, 2017 - 2030 (USD Million)
- Table 41 North America Cleanroom Technology market, by Cleanroom Type, 2017 - 2030 (USD Million)
- Table 42 North America Cleanroom Technology market, by Service Type, 2017 - 2030 (USD Million)
- Table 43 North America Cleanroom Technology market, by Industry Vertical, 2017 - 2030 (USD Million)
- Table 44 U.S. Cleanroom Technology market, by Product, 2017 - 2030 (USD Million)
- Table 45 U.S. Cleanroom Technology market, by Cleanroom Type, 2017 - 2030 (USD Million)
- Table 46 U.S. Cleanroom Technology market, by Service Type, 2017 - 2030 (USD Million)
- Table 47 U.S. Cleanroom Technology market, by Industry Vertical, 2017 - 2030 (USD Million)
- Table 48 Canada Cleanroom Technology market, by Product, 2017 - 2030 (USD Million)
- Table 49 Canada Cleanroom Technology market, by Cleanroom Type, 2017 - 2030 (USD Million)
- Table 50 Canada Cleanroom Technology market, by Service Type, 2017 - 2030 (USD Million)
- Table 51 Canada Cleanroom Technology market, by Industry Vertical, 2017 - 2030 (USD Million)
- Table 52 Mexico Cleanroom Technology market, by Product, 2017 - 2030 (USD Million)
- Table 53 Mexico Cleanroom Technology market, by Cleanroom Type, 2017 - 2030 (USD Million)
- Table 54 Mexico Cleanroom Technology market, by Service Type, 2017 - 2030 (USD Million)
- Table 55 Mexico Cleanroom Technology market, by Industry Vertical, 2017 - 2030 (USD Million)
- Table 56 Europe Cleanroom Technology market, by Product, 2017 - 2030 (USD Million)
- Table 57 Europe Cleanroom Technology market, by Cleanroom Type, 2017 - 2030 (USD Million)
- Table 58 Europe Cleanroom Technology market, by Service Type, 2017 - 2030 (USD Million)
- Table 59 Europe Cleanroom Technology market, by Industry Vertical, 2017 - 2030 (USD Million)
- Table 60 UK Cleanroom Technology market, by Product, 2017 - 2030 (USD Million)
- Table 61 UK Cleanroom Technology market, by Cleanroom Type, 2017 - 2030 (USD Million)
- Table 62 UK Cleanroom Technology market, by Service Type, 2017 - 2030 (USD Million)
- Table 63 UK Cleanroom Technology market, by Industry Vertical, 2017 - 2030 (USD Million)
- Table 64 Germany Cleanroom Technology market, by Product, 2017 - 2030 (USD Million)
- Table 65 Germany Cleanroom Technology market, by Cleanroom Type, 2017 - 2030 (USD Million)
- Table 66 Germany Cleanroom Technology market, by Service Type, 2017 - 2030 (USD Million)
- Table 67 Germany Cleanroom Technology market, by Industry Vertical, 2017 - 2030 (USD Million)
- Table 68 France Cleanroom Technology market, by Product, 2017 - 2030 (USD Million)
- Table 69 France Cleanroom Technology market, by Cleanroom Type, 2017 - 2030 (USD Million)
- Table 70 France Cleanroom Technology market, by Service Type, 2017 - 2030 (USD Million)
- Table 71 France Cleanroom Technology market, by Industry Vertical, 2017 - 2030 (USD Million)
- Table 72 Asia Pacific Cleanroom Technology market, by Product, 2017 - 2030 (USD Million)
- Table 73 Asia Pacific Cleanroom Technology market, by Cleanroom Type, 2017 - 2030 (USD Million)
- Table 74 Asia Pacific Cleanroom Technology market, by Service Type, 2017 - 2030 (USD Million)
- Table 75 Asia Pacific Cleanroom Technology market, by Industry Vertical, 2017 - 2030 (USD Million)
- Table 76 China Cleanroom Technology market, by Product, 2017 - 2030 (USD Million)
- Table 77 China Cleanroom Technology market, by Cleanroom Type, 2017 - 2030 (USD Million)
- Table 78 China Cleanroom Technology market, by Service Type, 2017 - 2030 (USD Million)
- Table 79 China Cleanroom Technology market, by Industry Vertical, 2017 - 2030 (USD Million)
- Table 80 Japan Cleanroom Technology market, by Product, 2017 - 2030 (USD Million)
- Table 81 Japan Cleanroom Technology market, by Cleanroom Type, 2017 - 2030 (USD Million)
- Table 82 Japan Cleanroom Technology market, by Service Type, 2017 - 2030 (USD Million)
- Table 83 Japan Cleanroom Technology market, by Industry Vertical, 2017 - 2030 (USD Million)
- Table 84 India Cleanroom Technology market, by Product, 2017 - 2030 (USD Million)
- Table 85 India Cleanroom Technology market, by Cleanroom Type, 2017 - 2030 (USD Million)
- Table 86 India Cleanroom Technology market, by Service Type, 2017 - 2030 (USD Million)
- Table 87 India Cleanroom Technology market, by Industry Vertical, 2017 - 2030 (USD Million)
- Table 88 South Korea Cleanroom Technology market, by Product, 2017 - 2030 (USD Million)
- Table 89 South Korea Cleanroom Technology market, by Cleanroom Type, 2017 - 2030 (USD Million)
- Table 90 South Korea Cleanroom Technology market, by Service Type, 2017 - 2030 (USD Million)
- Table 91 South Korea Cleanroom Technology market, by Industry Vertical, 2017 - 2030 (USD Million)
- Table 92 Australia Cleanroom Technology market, by Product, 2017 - 2030 (USD Million)
- Table 93 Australia Cleanroom Technology market, by Cleanroom Type, 2017 - 2030 (USD Million)
- Table 94 Australia Cleanroom Technology market, by Service Type, 2017 - 2030 (USD Million)
- Table 95 Australia Cleanroom Technology market, by Industry Vertical, 2017 - 2030 (USD Million)
- Table 96 Latin America Cleanroom Technology market, by Product, 2017 - 2030 (USD Million)
- Table 97 Latin America Cleanroom Technology market, by Cleanroom Type, 2017 - 2030 (USD Million)
- Table 98 Latin America Cleanroom Technology market, by Service Type, 2017 - 2030 (USD Million)
- Table 99 Latin America Cleanroom Technology market, by Industry Vertical, 2017 - 2030 (USD Million)
- Table 100 Brazil Cleanroom Technology market, by Product, 2017 - 2030 (USD Million)
- Table 101 Brazil Cleanroom Technology market, by Cleanroom Type, 2017 - 2030 (USD Million)
- Table 102 Brazil Cleanroom Technology market, by Service Type, 2017 - 2030 (USD Million)
- Table 103 Brazil Cleanroom Technology market, by Industry Vertical, 2017 - 2030 (USD Million)
- Table 104 MEA Cleanroom Technology market, by Product, 2017 - 2030 (USD Million)
- Table 105 MEA Cleanroom Technology market, by Cleanroom Type, 2017 - 2030 (USD Million)
- Table 106 MEA Cleanroom Technology market, by Service Type, 2017 - 2030 (USD Million)
- Table 107 MEA Cleanroom Technology market, by Industry Vertical, 2017 - 2030 (USD Million)
- Table 108 UAE Cleanroom Technology market, by Product, 2017 - 2030 (USD Million)
- Table 109 UAE Cleanroom Technology market, by Cleanroom Type, 2017 - 2030 (USD Million)
- Table 110 UAE Cleanroom Technology market, by Service Type, 2017 - 2030 (USD Million)
- Table 111 UAE Cleanroom Technology market, by Industry Vertical, 2017 - 2030 (USD Million)
- Table 112 KSA Cleanroom Technology market, by Product, 2017 - 2030 (USD Million)
- Table 113 KSA Cleanroom Technology market, by Cleanroom Type, 2017 - 2030 (USD Million)
- Table 114 KSA Cleanroom Technology market, by Service Type, 2017 - 2030 (USD Million)
- Table 115 KSA Cleanroom Technology market, by Industry Vertical, 2017 - 2030 (USD Million)
- Table 116 South Africa Cleanroom Technology market, by Product, 2017 - 2030 (USD Million)
- Table 117 South Africa Cleanroom Technology market, by Cleanroom Type, 2017 - 2030 (USD Million)
- Table 118 South Africa Cleanroom Technology market, by Service Type, 2017 - 2030 (USD Million)
- Table 119 South Africa Cleanroom Technology market, by Industry Vertical, 2017 - 2030 (USD Million)
List of Figures
- Fig. 1 Cleanroom Technology market segmentation
- Fig. 2 Market research process
- Fig. 3 Information procurement
- Fig. 4 Primary research pattern
- Fig. 5 Market research approaches
- Fig. 6 Value chain-based sizing & forecasting
- Fig. 7 Parent market analysis
- Fig. 8 Market formulation & validation
- Fig. 9 Cleanroom Technology market snapshot
- Fig. 10 Cleanroom Technology market segment snapshot
- Fig. 11 Cleanroom Technology market competitive landscape snapshot
- Fig. 12 Market research process
- Fig. 13 Market driver relevance analysis (Current & future impact)
- Fig. 14 Market restraint relevance analysis (Current & future impact)
- Fig. 15 Cleanroom Technology market, Product outlook key takeaways (USD Million)
- Fig. 16 Cleanroom Technology market Product movement analysis 2024 & 2030 (USD Million)
- Fig. 17 Equipment market revenue estimates and forecasts, 2017 - 2030 (USD Million)
- Fig. 18 Fan Filter Units (FFU) market revenue estimates and forecasts, 2017 - 2030 (USD Million)
- Fig. 19 HVAC Systems market revenue estimates and forecasts, 2017 - 2030 (USD Million)
- Fig. 20 Laminar Air Flow Systems and Biosafety Cabinets market revenue estimates and forecasts, 2017 - 2030 (USD Million)
- Fig. 21 HEPA Filters market revenue estimates and forecasts, 2017 - 2030 (USD Million)
- Fig. 22 Others market revenue estimates and forecasts, 2017 - 2030 (USD Million)
- Fig. 23 Consumables market revenue estimates and forecasts, 2017 - 2030 (USD Million)
- Fig. 24 Safety Consumables market revenue estimates and forecasts, 2017 - 2030 (USD Million)
- Fig. 25 Gloves market revenue estimates and forecasts, 2017 - 2030 (USD Million)
- Fig. 26 Apparel market revenue estimates and forecasts, 2017 - 2030 (USD Million)
- Fig. 27 Other Safety Consumables market revenue estimates and forecasts, 2017 - 2030 (USD Million)
- Fig. 28 Cleaning Consumables market revenue estimates and forecasts, 2017 - 2030 (USD Million)
- Fig. 29 Wipes market revenue estimates and forecasts, 2017 - 2030 (USD Million)
- Fig. 30 Disinfectants market revenue estimates and forecasts, 2017 - 2030 (USD Million)
- Fig. 31 Other Cleaning Consumables market revenue estimates and forecasts, 2017 - 2030 (USD Million)
- Fig. 32 Cleanroom Technology market: Cleanroom Type outlook key takeaways (USD Million)
- Fig. 33 Cleanroom Technology market: Cleanroom Type movement analysis 2024 & 2030 (USD Million)
- Fig. 34 Softwall Cleanroom market revenue estimates and forecasts, 2017 - 2030 (USD Million)
- Fig. 35 Hardwall Cleanroom market revenue estimates and forecasts, 2017 - 2030 (USD Million)
- Fig. 36 Rigidwall Cleanroom market revenue estimates and forecasts, 2017 - 2030 (USD Million)
- Fig. 37 Others market revenue estimates and forecasts, 2017 - 2030 (USD Million)
- Fig. 38 Cleanroom Technology market: Service Type outlook key takeaways (USD Million)
- Fig. 39 Cleanroom Technology market: Service Type movement analysis 2024 & 2030 (USD Million)
- Fig. 40 Professional Services market revenue estimates and forecasts, 2017 - 2030 (USD Million)
- Fig. 41 Consultation Services market revenue estimates and forecasts, 2017 - 2030 (USD Million)
- Fig. 42 Budgeting and Planning Services market revenue estimates and forecasts, 2017 - 2030 (USD Million)
- Fig. 43 Design and Engineering Services market revenue estimates and forecasts, 2017 - 2030 (USD Million)
- Fig. 44 Construction and Assembly Services market revenue estimates and forecasts, 2017 - 2030 (USD Million)
- Fig. 45 Testing and Certification Services market revenue estimates and forecasts, 2017 - 2030 (USD Million)
- Fig. 46 Preventative Maintenance Services market revenue estimates and forecasts, 2017 - 2030 (USD Million)
- Fig. 47 Managed Services market revenue estimates and forecasts, 2017 - 2030 (USD Million)
- Fig. 48 Cleanroom Technology market: Industry Vertical outlook key takeaways (USD Million)
- Fig. 49 Cleanroom Technology market: Industry Vertical movement analysis 2024 & 2030 (USD Million)
- Fig. 50 Semiconductor & Electronics market revenue estimates and forecasts, 2017 - 2030 (USD Million)
- Fig. 51 Food & Beverages market revenue estimates and forecasts, 2017 - 2030 (USD Million)
- Fig. 52 Healthcare market revenue estimates and forecasts, 2017 - 2030 (USD Million)
- Fig. 53 Automotive market revenue estimates and forecasts, 2017 - 2030 (USD Million)
- Fig. 54 Aerospace market revenue estimates and forecasts, 2017 - 2030 (USD Million)
- Fig. 55 Others market revenue estimates and forecasts, 2017 - 2030 (USD Million)
- Fig. 56 Regional marketplace: Key takeaways
- Fig. 57 Cleanroom Technology market: Regional outlook, 2024 & 2030 (USD Million)
- Fig. 58 North America generative AI market estimates and forecasts, 2017 - 2030 (USD Million)
- Fig. 59 U.S. Cleanroom Technology market estimates and forecasts, 2017 - 2030 (USD Million)
- Fig. 60 Canada Cleanroom Technology market estimates and forecasts, 2017 - 2030 (USD Million)
- Fig. 61 Mexico Cleanroom Technology market estimates and forecasts, 2017 - 2030 (USD Million)
- Fig. 62 Europe Cleanroom Technology market estimates and forecasts, 2017 - 2030 (USD Million)
- Fig. 63 UK Cleanroom Technology market estimates and forecasts, 2017 - 2030 (USD Million)
- Fig. 64 Germany Cleanroom Technology market estimates and forecasts, 2017 - 2030 (USD Million)
- Fig. 65 France Cleanroom Technology market estimates and forecasts, 2017 - 2030 (USD Million)
- Fig. 66 Asia Pacific Cleanroom Technology market estimates and forecasts, 2017 - 2030 (USD Million)
- Fig. 67 Japan Cleanroom Technology market estimates and forecasts, 2017 - 2030 (USD Million)
- Fig. 68 China Cleanroom Technology market estimates and forecasts, 2017 - 2030 (USD Million)
- Fig. 69 India Cleanroom Technology market estimates and forecasts, 2017 - 2030 (USD Million)
- Fig. 70 Australia Cleanroom Technology market estimates and forecasts, 2017 - 2030 (USD Million)
- Fig. 71 South Korea Cleanroom Technology market estimates and forecasts, 2017 - 2030 (USD Million)
- Fig. 72 Latin America Cleanroom Technology market estimates and forecasts, 2017 - 2030 (USD Million)
- Fig. 73 Brazil Cleanroom Technology market estimates and forecasts, 2017 - 2030 (USD Million)
- Fig. 74 MEA Cleanroom Technology market estimates and forecasts, 2017 - 2030 (USD Million)
- Fig. 75 KSA Cleanroom Technology market estimates and forecasts, 2017 - 2030 (USD Million)
- Fig. 76 UAE Cleanroom Technology market estimates and forecasts, 2017 - 2030 (USD Million)
- Fig. 77 South Africa Cleanroom Technology market estimates and forecasts, 2017 - 2030 (USD Million)
- Fig. 78 Strategy framework
- Fig. 79 Company Categorization
Cleanroom Technology Market Growth & Trends:
The global cleanroom technology market size is expected to reach USD 10.82 billion by 2030, according to a new report by Grand View Research, Inc. The market is projected to grow at a CAGR of 5.9% from 2025 to 2030.
Cleanroom technology refers to a collection of specialized techniques, tools, and facilities to maintain an atmosphere with regulated levels of airborne particles, pollutants, temperature, humidity, and other environmental characteristics. Cleanrooms are essential for maintaining the integrity and caliber of industrial processes in a variety of industries, including biotechnology, electronics, pharmaceuticals, and healthcare. Strict guidelines are followed in these environments, which control temperature, humidity, ventilation, and particle count to avoid contamination. Monitoring and control systems, air filtration devices, and sophisticated HVAC systems are essential parts of cleanroom technology. Employees working in cleanroom facilities are usually subject to stringent guidelines, which include wearing protective gear like protective clothing, gloves, and hoods to reduce the risk of contamination. Cleanroom technology has applications in everything from semiconductor manufacturing to sterile healthcare environments. It is constantly developing to meet the ever-stricter demands of contemporary industries and guarantees the production of high-quality, contamination-free products.
Cleanroom technology is in high demand as the pharmaceutical and biotechnology industries work to preserve product quality and comply with stringent regulations. In addition, as nanotechnology and microfabrication techniques continue to progress, sectors such as electronics and semiconductor production are depending more and more on cleanroom facilities to guarantee the accuracy and dependability of their output. The move toward miniaturization is driving the need for more hygienic and regulated manufacturing settings. Global regulatory agencies are strengthening the standards for manufacturing procedures in vital industries. Companies may ensure product safety and quality by adhering to strict requirements proactively with cleanroom technology.
Technology breakthroughs and a growing focus on quality control in manufacturing processes are bringing about a revolutionary time for the cleanroom technology sector. Cleanroom technology demand is predicted to increase as industries attempt to reach the highest standards, offering attractive prospects for market players.
Cleanroom Technology Market Report Highlights:
- The consumables segment dominated the market with a share of 55.2% in 2024 and witnessing a CAGR of 5.4% during the forecast period.
- The hardwall cleanroom segment dominated the market with a share of 45.3%. It is expected to grow at the fastest CAGR of 6.6% throughout the forecast period.
- The professional services segment dominated the market with a 66.1% share in 2024. It is anticipated to grow at a CAGR of 5.3% during the forecast period.
- The healthcare segment dominated the market with a revenue share of 62.3% in 2024 and witnessing the fastest CAGR of 6.3% during the forecast period.
Table of Contents
Chapter 1. Methodology and Scope
- 1.1. Market Segmentation and Scope
- 1.2. Research Methodology
- 1.2.1. Information Procurement
- 1.3. Information or Data Analysis
- 1.4. Methodology
- 1.5. Research Scope and Assumptions
- 1.6. Market Formulation & Validation
- 1.7. Country Based Segment Share Calculation
- 1.8. List of Data Sources
Chapter 2. Executive Summary
- 2.1. Market Outlook
- 2.2. Segment Outlook
- 2.3. Competitive Insights
Chapter 3. Cleanroom Technology Market Variables, Trends, & Scope
- 3.1. Market Lineage Outlook
- 3.2. Market Dynamics
- 3.2.1. Market Driver Analysis
- 3.2.2. Market Restraint Analysis
- 3.2.3. Industry Challenge
- 3.3. Cleanroom Technology Market Analysis Tools
- 3.3.1. Industry Analysis - Porter's
- 3.3.1.1. Bargaining power of the suppliers
- 3.3.1.2. Bargaining power of the buyers
- 3.3.1.3. Threats of substitution
- 3.3.1.4. Threats from new entrants
- 3.3.1.5. Competitive rivalry
- 3.3.2. PESTEL Analysis
- 3.3.2.1. Political landscape
- 3.3.2.2. Economic and social landscape
- 3.3.2.3. Technological landscape
- 3.3.1. Industry Analysis - Porter's
- 3.4. Pain Point Analysis
Chapter 4. Cleanroom Technology Market: Product Estimates & Trend Analysis
- 4.1. Segment Dashboard
- 4.2. Cleanroom Technology Market: Product Movement Analysis, 2024 & 2030 (USD Million)
- 4.3. Equipment
- 4.3.1. Equipment Market Revenue Estimates and Forecasts, 2017 - 2030 (USD Million)
- 4.3.2. Fan Filter Units (FFU)
- 4.3.2.1. Fan Filter Units (FFU) Market Revenue Estimates and Forecasts, 2017 - 2030 (USD Million)
- 4.3.3. HVAC Systems
- 4.3.3.1. HVAC Systems Market Revenue Estimates and Forecasts, 2017 - 2030 (USD Million)
- 4.3.4. Laminar Air Flow Systems and Biosafety Cabinets
- 4.3.4.1. Laminar Air Flow Systems and Biosafety Cabinets Market Revenue Estimates and Forecasts, 2017 - 2030 (USD Million)
- 4.3.5. HEPA Filters
- 4.3.5.1. HEPA Filters Market Revenue Estimates and Forecasts, 2017 - 2030 (USD Million)
- 4.3.6. Others
- 4.3.6.1. Others Market Revenue Estimates and Forecasts, 2017 - 2030 (USD Million)
- 4.4. Consumables
- 4.4.1. Consumables Market Revenue Estimates and Forecasts, 2017 - 2030 (USD Million)
- 4.4.2. Safety Consumables
- 4.4.2.1. Safety Consumables Market Revenue Estimates and Forecasts, 2017 - 2030 (USD Million)
- 4.4.2.2. Gloves
- 4.4.2.2.1. Gloves Market Revenue Estimates and Forecasts, 2017 - 2030 (USD Million)
- 4.4.2.3. Apparel
- 4.4.2.3.1. Apparel Market Revenue Estimates and Forecasts, 2017 - 2030 (USD Million)
- 4.4.2.4. Other Safety Consumables
- 4.4.2.4.1. Other Safety Consumables Market Revenue Estimates and Forecasts, 2017 - 2030 (USD Million)
- 4.4.3. Cleaning Consumables
- 4.4.3.1. Cleaning Consumables Market Revenue Estimates and Forecasts, 2017 - 2030 (USD Million)
- 4.4.3.2. Wipes
- 4.4.3.2.1. Wipes Market Revenue Estimates and Forecasts, 2017 - 2030 (USD Million)
- 4.4.3.3. Disinfectants
- 4.4.3.3.1. Disinfectants Market Revenue Estimates and Forecasts, 2017 - 2030 (USD Million)
- 4.4.3.4. Other Cleaning Consumables
- 4.4.3.4.1. Other Cleaning Consumables Market Revenue Estimates and Forecasts, 2017 - 2030 (USD Million)
Chapter 5. Cleanroom Technology Market: Cleanroom Type Estimates & Trend Analysis
- 5.1. Segment Dashboard
- 5.2. Cleanroom Technology Market: Cleanroom Type Movement Analysis, 2024 & 2030 (USD Million)
- 5.3. Softwall Cleanroom
- 5.3.1. Softwall Cleanroom Market Revenue Estimates and Forecasts, 2017 - 2030 (USD Million)
- 5.4. Hardwall Cleanroom
- 5.4.1. Hardwall Cleanroom Market Revenue Estimates and Forecasts, 2017 - 2030 (USD Million)
- 5.5. Rigidwall Cleanroom
- 5.5.1. Rigidwall Cleanroom Market Revenue Estimates and Forecasts, 2017 - 2030 (USD Million)
- 5.6. Others
- 5.6.1. Others Market Revenue Estimates and Forecasts, 2017 - 2030 (USD Million)
Chapter 6. Cleanroom Technology Market: Service Type Estimates & Trend Analysis
- 6.1. Segment Dashboard
- 6.2. Cleanroom Technology Market: Service Type Movement Analysis, 2024 & 2030 (USD Million)
- 6.3. Professional Services
- 6.3.1. Professional Services Market Revenue Estimates and Forecasts, 2017 - 2030 (USD Million)
- 6.3.2. Consultation Services
- 6.3.2.1. Consultation Services Market Revenue Estimates and Forecasts, 2017 - 2030 (USD Million)
- 6.3.3. Budgeting and Planning Services
- 6.3.3.1. Budgeting and Planning Services Market Revenue Estimates and Forecasts, 2017 - 2030 (USD Million)
- 6.3.4. Design and Engineering Services
- 6.3.4.1. Design and Engineering Services Market Revenue Estimates and Forecasts, 2017 - 2030 (USD Million)
- 6.3.5. Construction and Assembly Services
- 6.3.5.1. Construction and Assembly Services Market Revenue Estimates and Forecasts, 2017 - 2030 (USD Million)
- 6.3.6. Testing and Certification Services
- 6.3.6.1. Testing and Certification Services Market Revenue Estimates and Forecasts, 2017 - 2030 (USD Million)
- 6.3.7. Preventative Maintenance Services
- 6.3.7.1. Preventative Maintenance Services Market Revenue Estimates and Forecasts, 2017 - 2030 (USD Million)
- 6.4. Managed Services
- 6.4.1. Managed Services Market Revenue Estimates and Forecasts, 2017 - 2030 (USD Million)
Chapter 7. Cleanroom Technology Market: Industry Vertical Estimates & Trend Analysis
- 7.1. Segment Dashboard
- 7.2. Cleanroom Technology Market: Industry Vertical Movement Analysis, 2024 & 2030 (USD Million)
- 7.3. Semiconductor & Electronics
- 7.3.1. Semiconductor & Electronics Market Revenue Estimates and Forecasts, 2017 - 2030 (USD Million)
- 7.4. Food & Beverages
- 7.4.1. Food & Beverages Market Revenue Estimates and Forecasts, 2017 - 2030 (USD Million)
- 7.5. Healthcare
- 7.5.1. Healthcare Market Revenue Estimates and Forecasts, 2017 - 2030 (USD Million)
- 7.6. Automotive
- 7.6.1. Automotive Market Revenue Estimates and Forecasts, 2017 - 2030 (USD Million)
- 7.7. Aerospace
- 7.7.1. Aerospace Market Revenue Estimates and Forecasts, 2017 - 2030 (USD Million)
- 7.8. Others
- 7.8.1. Others Market Revenue Estimates and Forecasts, 2017 - 2030 (USD Million)
Chapter 8. Cleanroom Technology Market: Regional Estimates & Trend Analysis
- 8.1. Cleanroom Technology Market Share, By Region, 2024 & 203 ( USD Million)
- 8.2. North America
- 8.2.1. North America Cleanroom Technology Market Estimates and Forecasts, 2017 - 2030 (USD Million)
- 8.2.2. U.S.
- 8.2.2.1. U.S. Cleanroom Technology Market Estimates and Forecasts, 2017 - 2030 (USD Million)
- 8.2.3. Canada
- 8.2.3.1. Canada Cleanroom Technology Market Estimates and Forecasts, 2017 - 2030 (USD Million)
- 8.2.4. Mexico
- 8.2.4.1. Mexico Cleanroom Technology Market Estimates and Forecasts, 2017 - 2030 (USD Million)
- 8.3. Europe
- 8.3.1. Europe Cleanroom Technology Market Estimates and Forecasts, 2017 - 2030 (USD Million)
- 8.3.2. UK
- 8.3.2.1. UK Cleanroom Technology Market Estimates and Forecasts, 2017 - 2030 (USD Million)
- 8.3.3. Germany
- 8.3.3.1. Germany Cleanroom Technology Market Estimates and Forecasts, 2017 - 2030 (USD Million)
- 8.3.4. France
- 8.3.4.1. France Cleanroom Technology Market Estimates and Forecasts, 2017 - 2030 (USD Million)
- 8.4. Asia Pacific
- 8.4.1. Asia Pacific Cleanroom Technology Market Estimates and Forecasts, 2017 - 2030 (USD Million)
- 8.4.2. China
- 8.4.2.1. China Cleanroom Technology Market Estimates and Forecasts, 2017 - 2030 (USD Million)
- 8.4.3. Japan
- 8.4.3.1. Japan Cleanroom Technology Market Estimates and Forecasts, 2017 - 2030 (USD Million)
- 8.4.4. India
- 8.4.4.1. India Cleanroom Technology Market Estimates and Forecasts, 2017 - 2030 (USD Million)
- 8.4.5. South Korea
- 8.4.5.1. South Korea Cleanroom Technology Market Estimates and Forecasts, 2017 - 2030 (USD Million)
- 8.4.6. Australia
- 8.4.6.1. Australia Cleanroom Technology Market Estimates and Forecasts, 2017 - 2030 (USD Million)
- 8.5. Latin America
- 8.5.1. Latin America Cleanroom Technology Market Estimates and Forecasts, 2017 - 2030 (USD Million)
- 8.5.2. Brazil
- 8.5.2.1. Brazil Cleanroom Technology Market Estimates and Forecasts, 2017 - 2030 (USD Million)
- 8.6. Middle East and Africa
- 8.6.1. Middle East and Africa Cleanroom Technology Market Estimates and Forecasts, 2017 - 2030 (USD Million)
- 8.6.2. UAE
- 8.6.2.1. UAE Cleanroom Technology Market Estimates and Forecasts, 2017 - 2030 (USD Million)
- 8.6.3. KSA
- 8.6.3.1. KSA Cleanroom Technology Market Estimates and Forecasts, 2017 - 2030 (USD Million)
- 8.6.4. South Africa
- 8.6.4.1. South Africa Cleanroom Technology Market Estimates and Forecasts, 2017 - 2030 (USD Million)
Chapter 9. Competitive Landscape
- 9.1. Company Categorization
- 9.2. Company Market Positioning
- 9.3. Company Heat Map Analysis
- 9.4. Company Profiles/Listing
- 9.4.1. Advanced Technology Group
- 9.4.1.1. Participant's Overview
- 9.4.1.2. Financial Performance
- 9.4.1.3. Product Benchmarking
- 9.4.1.4. Strategic Initiatives
- 9.4.2. CIMTechniques (SmartScan Technologies)
- 9.4.2.1. Participant's Overview
- 9.4.2.2. Financial Performance
- 9.4.2.3. Product Benchmarking
- 9.4.2.4. Strategic Initiatives
- 9.4.3. Cleanrooms By United
- 9.4.3.1. Participant's Overview
- 9.4.3.2. Financial Performance
- 9.4.3.3. Product Benchmarking
- 9.4.3.4. Strategic Initiatives
- 9.4.4. Angstrom Technology
- 9.4.4.1. Participant's Overview
- 9.4.4.2. Financial Performance
- 9.4.4.3. Product Benchmarking
- 9.4.4.4. Strategic Initiatives
- 9.4.5. Elsisan (YI-BA Engineering. Ltd. Sti.)
- 9.4.5.1. Participant's Overview
- 9.4.5.2. Financial Performance
- 9.4.5.3. Product Benchmarking
- 9.4.5.4. Strategic Initiatives
- 9.4.6. HEMCO Corporation
- 9.4.6.1. Participant's Overview
- 9.4.6.2. Financial Performance
- 9.4.6.3. Product Benchmarking
- 9.4.6.4. Strategic Initiatives
- 9.4.7. Kojair Tech Oy
- 9.4.7.1. Participant's Overview
- 9.4.7.2. Financial Performance
- 9.4.7.3. Product Benchmarking
- 9.4.7.4. Strategic Initiatives
- 9.4.8. Spetec GmbH
- 9.4.8.1. Participant's Overview
- 9.4.8.2. Financial Performance
- 9.4.8.3. Product Benchmarking
- 9.4.8.4. Strategic Initiatives
- 9.4.9. Terra Universal Inc.
- 9.4.9.1. Participant's Overview
- 9.4.9.2. Financial Performance
- 9.4.9.3. Product Benchmarking
- 9.4.9.4. Strategic Initiatives
- 9.4.10. Thomas Scientific
- 9.4.10.1. Participant's Overview
- 9.4.10.2. Financial Performance
- 9.4.10.3. Product Benchmarking
- 9.4.10.4. Strategic Initiatives
- 9.4.1. Advanced Technology Group

