|
|
市場調査レポート
商品コード
1404879
電気絶縁コーティングの市場規模、シェア、動向分析レポート:製品別、原材料別、地域別、セグメント予測、2023年~2030年Electrical Insulation Coatings Market Size, Share & Trends Analysis Report By Product (Liquid, Powder), By Raw Material (Epoxy, PTFE, Ceramic), By Region, And Segment Forecasts, 2023 - 2030 |
||||||
|
|
|||||||
カスタマイズ可能
|
|||||||


| 電気絶縁コーティングの市場規模、シェア、動向分析レポート:製品別、原材料別、地域別、セグメント予測、2023年~2030年 |
|
出版日: 2023年11月03日
発行: Grand View Research
ページ情報: 英文 150 Pages
納期: 2~10営業日
|

- 全表示
- 概要
- 図表
- 目次
電気絶縁コーティング市場の成長と動向:
Grand View Research, Inc.の最新レポートによると、世界の電気絶縁コーティング市場は2030年までに37億米ドルに達する見込みです。
同市場は2023年から2030年にかけてCAGR 4.7%で拡大すると予測されています。電力需要は、経済成長と人口増加により、非OECD諸国から力強い成長が見込まれます。原材料の入手が容易であること、特にアジア太平洋地域で今後の発電プロジェクトが予定されていることなど、その他の要因も市場の成長を促進すると予想されます。
原材料価格は、最終製品の総コストを決定する上で重要な役割を果たします。為替変動により、原材料価格は不安定になると予想されます。コーティング製剤のコストが高いことも、市場成長の妨げになると予想される要因のひとつです。VOC(揮発性有機化合物)排出に関する規制は、近い将来、液体ベースの絶縁コーティング剤の需要に影響を与えると予想されます。
液体コーティングは主要製品セグメントとして台頭し、2015年の世界需要の60%以上を占めました。しかし、厳しい規制が設けられていることから、電気絶縁用粉体コーティングの人気が高まっており、予測期間中に市場シェアが拡大すると予想されます。
電気絶縁コーティング市場レポートハイライト
- 電気絶縁コーティングは主に液体形態で入手可能です。液体コーティングは塗布が容易で、様々な表面への効率的かつ一貫した被覆を可能にします。流動性があるためシームレスな接着が可能で、空隙のリスクを低減し、より優れた電気絶縁性能を保証します。
- 粉末セグメントは、予測期間中最も速いCAGR 4.8%で成長すると予想されます。粉末コーティングは優れた耐久性と耐摩耗性を提供するため、過酷な環境での用途に最適です。
- エポキシ樹脂は、粉末状だけでなく樹脂状でも使用されます。高い誘電特性により、エポキシ粉体コーティングは、特にケーブル絶縁に使用される場合、高電圧スパイクの抑制に役立ちます。エポキシセグメントは、2022年に51.7%と最大の収益シェアを占め、収益と予測期間中のCAGRは5.0%と最も速いと推定・予測されています。
- アジア太平洋地域は、2022年に51.6%の最大の収益シェアを占め、予測期間中に5.2%の最速CAGRで成長すると予測されています。これは、急速な都市化、インフラ整備への投資の増加、インドと中国の堅調な経済成長に起因しています。
- 電気絶縁コーティング業界は、厳格なVOC規制のために技術的転換を遂げる可能性が高いです。様々な市場プレーヤーが、電気部品の形状に応じて異なるコーティングプロセスを導入しています。
目次
第1章 調査手法と範囲
第2章 エグゼクティブサマリー
第3章 電気絶縁コーティング市場の変数、動向および範囲
- 市場系統の見通し
- 普及と成長の見通しマッピング
- バリューチェーン分析
- 規制の枠組み
- 市場力学
- 市場促進要因分析
- 市場抑制要因分析
- 業界の機会と課題
- 電気絶縁コーティング市場分析ツール
- 業界分析- ポーターのファイブフォース分析
- PESTEL分析
第4章 サプライヤーのポートフォリオ分析
- サプライヤー一覧
- Kraljic Matrix
- 調達のベストプラクティス
- 交渉戦略
第5章 電気絶縁コーティング:製品推定・動向分析
- 電気絶縁コーティング市場:重要なポイント
- 電気絶縁コーティング市場:動向と市場シェア分析、2022年・2030年
- 液体
- 液体市場推計・予測、2018年~2030年
- 粉末
- 粉末市場推計・予測、2018年~2030年
第6章 電気絶縁コーティング:原材料の推定・動向分析
- 電気絶縁コーティング市場:重要なポイント
- 電気絶縁コーティング市場:動向と市場シェア分析、2022年・2030年
- エポキシ
- エポキシ市場推計・予測、2018年~2030年
- PTFE
- PTFE市場推計・予測、2018年~2030年
- セラミック
- セラミック市場推計・予測、2018年~2030年
- その他
- その他の市場推計・予測、2018年~2030年
第7章 電気絶縁コーティング市場:地域推定・動向分析
- 地域別の見通し
- 地域別の電気絶縁コーティング市場:重要なポイント
- 北米
- 市場推計・予測、2018~2030年
- 米国
- カナダ
- メキシコ
- 欧州
- 英国
- ドイツ
- フランス
- イタリア
- スペイン
- ロシア
- アジア太平洋地域
- 中国
- インド
- 日本
- 韓国
- 中南米
- ブラジル
- アルゼンチン
- 中東・アフリカ
- サウジアラビア
- 南アフリカ
第8章 競合情勢
- 主要市場参入企業による最近の動向と影響分析
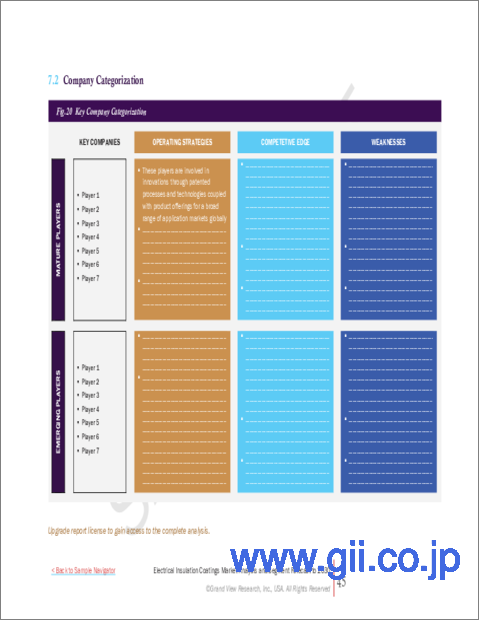
- 市場参入企業の分類
- Evonik Industries AG
- 3M
- PPG Industries, Inc.
- Thermal Spray Coatings(A Fisher Barton Company)
- GfE Gesellschaft fur Elektrometallurgie mbH
- ELANTAS PDG, Inc.
- GLS Coatings Ltd.
- SK FORMULATIONS INDIA PVT. LTD.
- PTFE Applied Coatings
- Axalta Coating Systems, LLC
- Akzo Nobel N.V.
List of Tables
- Table 1 List of abbreviation
- Table 2 North America electrical insulation coatings market, by product, 2018 - 2030 (USD Million, Kilo Tons)
- Table 3 North America electrical insulation coatings market, by material, 2018 - 2030 (USD Million, Kilo Tons)
- Table 4 North America electrical insulation coatings market, by region, 2018 - 2030 (USD Million, Kilo Tons)
- Table 5 U.S. electrical insulation coatings market, by product, 2018 - 2030 (USD Million, Kilo Tons)
- Table 6 U.S. electrical insulation coatings market, by material, 2018 - 2030 (USD Million, Kilo Tons)
- Table 7 Canada electrical insulation coatings market, by product, 2018 - 2030 (USD Million, Kilo Tons)
- Table 8 Canada electrical insulation coatings market, by material, 2018 - 2030 (USD Million, Kilo Tons)
- Table 9 Mexico electrical insulation coatings market, by product, 2018 - 2030 (USD Million, Kilo Tons)
- Table 10 Mexico electrical insulation coatings market, by material, 2018 - 2030 (USD Million, Kilo Tons)
- Table 11 Europe electrical insulation coatings market, by product, 2018 - 2030 (USD Million, Kilo Tons)
- Table 12 Europe electrical insulation coatings market, by material, 2018 - 2030 (USD Million, Kilo Tons)
- Table 13 Europe electrical insulation coatings market, by region, 2018 - 2030 (USD Million, Kilo Tons)
- Table 14 UK electrical insulation coatings market, by product, 2018 - 2030 (USD Million, Kilo Tons)
- Table 15 UK electrical insulation coatings market, by material, 2018 - 2030 (USD Million, Kilo Tons)
- Table 16 Germany electrical insulation coatings market, by product, 2018 - 2030 (USD Million, Kilo Tons)
- Table 17 Germany electrical insulation coatings market, by material, 2018 - 2030 (USD Million, Kilo Tons)
- Table 18 France electrical insulation coatings market, by product, 2018 - 2030 (USD Million, Kilo Tons)
- Table 19 France electrical insulation coatings market, by material, 2018 - 2030 (USD Million, Kilo Tons)
- Table 20 Italy electrical insulation coatings market, by product, 2018 - 2030 (USD Million, Kilo Tons)
- Table 21 Italy electrical insulation coatings market, by material, 2018 - 2030 (USD Million, Kilo Tons)
- Table 22 Spain electrical insulation coatings market, by product, 2018 - 2030 (USD Million, Kilo Tons)
- Table 23 Spain electrical insulation coatings market, by material, 2018 - 2030 (USD Million, Kilo Tons)
- Table 24 Russia electrical insulation coatings market, by product, 2018 - 2030 (USD Million, Kilo Tons)
- Table 25 Russia electrical insulation coatings market, by material, 2018 - 2030 (USD Million, Kilo Tons)
- Table 26 Asia Pacific electrical insulation coatings market, by product, 2018 - 2030 (USD Million, Kilo Tons)
- Table 27 Asia Pacific electrical insulation coatings market, by material, 2018 - 2030 (USD Million, Kilo Tons)
- Table 28 Asia Pacific electrical insulation coatings market, by region, 2018 - 2030 (USD Million, Kilo Tons)
- Table 29 China electrical insulation coatings market, by product, 2018 - 2030 (USD Million, Kilo Tons)
- Table 30 China electrical insulation coatings market, by material, 2018 - 2030 (USD Million, Kilo Tons)
- Table 31 India electrical insulation coatings market, by product, 2018 - 2030 (USD Million, Kilo Tons)
- Table 32 India electrical insulation coatings market, by material, 2018 - 2030 (USD Million, Kilo Tons)
- Table 33 Japan electrical insulation coatings market, by product, 2018 - 2030 (USD Million, Kilo Tons)
- Table 34 Japan electrical insulation coatings market, by material, 2018 - 2030 (USD Million, Kilo Tons)
- Table 35 South Korea electrical insulation coatings market, by product, 2018 - 2030 (USD Million, Kilo Tons)
- Table 36 South Korea electrical insulation coatings market, by material, 2018 - 2030 (USD Million, Kilo Tons)
- Table 37 Central and South America electrical insulation coatings market, by product, 2018 - 2030 (USD Million, Kilo Tons)
- Table 38 Central and South America electrical insulation coatings market, by material, 2018 - 2030 (USD Million, Kilo Tons)
- Table 39 Central and South America electrical insulation coatings market, by region, 2018 - 2030 (USD Million, Kilo Tons)
- Table 40 Brazil electrical insulation coatings market, by product, 2018 - 2030 (USD Million, Kilo Tons)
- Table 41 Brazil electrical insulation coatings market, by material, 2018 - 2030 (USD Million, Kilo Tons)
- Table 42 Argentina electrical insulation coatings market, by product, 2018 - 2030 (USD Million, Kilo Tons)
- Table 43 Argentina electrical insulation coatings market, by material, 2018 - 2030 (USD Million, Kilo Tons)
- Table 44 Middle East and Africa electrical insulation coatings market, by product, 2018 - 2030 (USD Million, Kilo Tons)
- Table 45 Middle East and Africa electrical insulation coatings market, by material, 2018 - 2030 (USD Million, Kilo Tons)
- Table 46 Middle East and Africa electrical insulation coatings market, by region, 2018 - 2030 (USD Million, Kilo Tons)
- Table 47 Saudi Arabia electrical insulation coatings market, by product, 2018 - 2030 (USD Million, Kilo Tons)
- Table 48 Saudi Arabia electrical insulation coatings market, by material, 2018 - 2030 (USD Million, Kilo Tons)
- Table 49 South Africa electrical insulation coatings market, by product, 2018 - 2030 (USD Million, Kilo Tons)
- Table 50 South Africa electrical insulation coatings market, by material, 2018 - 2030 (USD Million, Kilo Tons)
List of Figures
- Fig. 1 Market research process
- Fig. 2 Data triangulation techniques
- Fig. 3 Primary research pattern
- Fig. 4 Market research approaches
- Fig. 5 Value-chain-based sizing & forecasting
- Fig. 6 QFD modeling for market share assessment
- Fig. 7 Market formulation & validation
- Fig. 8 Electrical insulation coatings: Market outlook
- Fig. 9 Electrical insulation coatings: Competitive insights
- Fig. 10 Parent market outlook
- Fig. 11 Related/ancillary market outlook
- Fig. 12 Penetration and growth prospect mapping
- Fig. 13 Industry value chain analysis
- Fig. 14 Electrical insulation coatings market driver impact
- Fig. 15 Electrical insulation coatings market restraint impact
- Fig. 16 Electrical insulation coatings market strategic initiatives analysis
- Fig. 17 Electrical insulation coatings market: Product movement analysis
- Fig. 18 Electrical insulation coatings market: Product outlook and key takeaways
- Fig. 19 Liquid market estimates and forecasts, 2018 - 2030
- Fig. 20 Powder market estimates and forecasts, 2018 - 2030
- Fig. 21 Electrical insulation coatings market: Raw Material movement analysis
- Fig. 22 Electrical insulation coatings market: Raw Material outlook and key takeaways
- Fig. 23 Epoxy market estimates and forecasts, 2018 - 2030
- Fig. 24 PTFE market estimates and forecasts, 2018 - 2030
- Fig. 25 Ceramic market estimates and forecasts, 2018 - 2030
- Fig. 26 Others market estimates and forecasts, 2018 - 2030
- Fig. 27 Global electrical insulation coatings market: Regional movement analysis
- Fig. 28 Global electrical insulation coatings market: Regional outlook and key takeaways
- Fig. 29 North America market estimates and forecasts, 2018 - 2030
- Fig. 30 U.S. market estimates and forecasts, 2018 - 2030
- Fig. 31 Canada market estimates and forecasts, 2018 - 2030
- Fig. 32 Mexico market estimates and forecasts, 2018 - 2030
- Fig. 33 Europe market estimates and forecasts, 2018 - 2030
- Fig. 34 U.K. market estimates and forecasts, 2018 - 2030
- Fig. 35 Germany market estimates and forecasts, 2018 - 2030
- Fig. 36 France market estimates and forecasts, 2018 - 2030
- Fig. 37 Italy market estimates and forecasts, 2018 - 2030
- Fig. 38 Spain market estimates and forecasts, 2018 - 2030
- Fig. 39 Russia market estimates and forecasts, 2018 - 2030
- Fig. 40 Asia Pacific market estimates and forecasts, 2018 - 2030
- Fig. 41 China market estimates and forecasts, 2018 - 2030
- Fig. 42 India market estimates and forecasts, 2018 - 2030
- Fig. 43 Japan market estimates and forecasts, 2018 - 2030
- Fig. 44 South Korea market estimates and forecasts, 2018 - 2030
- Fig. 45 Central and South America market estimates and forecasts, 2018 - 2030
- Fig. 46 Brazil market estimates and forecasts, 2018 - 2030
- Fig. 47 Argentina market estimates and forecasts, 2018 - 2030
- Fig. 48 Middle East and Africa. market estimates and forecasts, 2018 - 2030
- Fig. 49 Saudi Arabia market estimates and forecasts, 2018 - 2030
- Fig. 50 South Africa market estimates and forecasts, 2018 - 2030
Electrical Insulation Coatings Market Growth & Trends:
The global electrical insulation coating market is expected to reach USD 3.7 billion in 2030, according to a new report by Grand View Research, Inc. The market is expected to expand at a CAGR of 4.7% from 2023 to 2030. The electricity demand is anticipated to witness robust growth from non-OECD countries owing to economic and population growth. Other factors such as easy availability of raw materials, upcoming power generation projects particularly in Asia Pacific are anticipated to foster the market growth.
Raw material prices play a vital role in defining the overall costs of the final product. Currency fluctuations are expected to result in unstable raw material prices. The high cost of coating formulations is another factor which is anticipated to hinder the market growth. Regulations related to VOC (volatile organic compound) emission are expected to affect the demand for liquid based insulation coatings in the near future.
Liquid coatings emerged as the leading product segment and accounted for over 60% of global demand in 2015. However, gaining popularity of powder coatings for electrical insulation on account of stringent regulations in place is expected to increase its market share over the forecast period.
Electrical Insulation Coatings Market Report Highlights:
- Electrical insulation coatings are largely available in liquid form. Liquid coatings offer ease of application, enabling efficient and consistent coverage on various surfaces. Their fluidity allows for seamless adhesion, reducing the risk of air gaps and ensuring better electrical insulation performance.
- The powder segment is expected to grow at the fastest CAGR of 4.8% during the forecast period. Powder coatings offer superior durability and resistance to wear, making them ideal for applications in harsh environments.
- Epoxies are used in powdered as well as resin forms. Due to high dielectric properties, epoxy powder coatings help in negating high voltage spikes, especially when used in cable insulations. The epoxy segment accounted for the largest revenue share of 51.7% in 2022 and is estimated to register the fastest CAGR of 5.0% over the forecast period.
- Asia Pacific accounted for the largest revenue share of 51.6% in 2022 and is expected to grow at the fastest CAGR of 5.2% during the forecast period. This can be attributed to rapid urbanization, increasing investment in infrastructure development, and robust economic growth in India and China.
- Electrical insulation coatings industry is likely to witness technological shift owing to strict VOC regulations. Various market players have implemented different coating processes depending on the geometry of the electrical components.
Table of Contents
Chapter 1. Methodology and Scope
- 1.1. Market Segmentation & Scope
- 1.1.1. Product
- 1.1.2. Raw Material
- 1.1.3. Regional scope
- 1.1.4. Estimates and forecast timeline
- 1.2. Research Methodology
- 1.3. Information Procurement
- 1.3.1. Purchased database
- 1.3.2. GVR's internal database
- 1.3.3. Secondary sources
- 1.3.4. Primary research
- 1.3.5. Details of primary research
- 1.4. Information or Data Analysis
- 1.5. Market Formulation & Validation
- 1.6. Model Details
- 1.7. List of Secondary Sources
- 1.8. List of Primary Sources
- 1.9. Objectives
Chapter 2. Executive Summary
- 2.1. Market Outlook
- 2.2. Segment Outlook
- 2.2.1. Product outlook
- 2.2.2. Raw Material outlook
- 2.2.3. Regional outlook
- 2.3. Competitive Insights
Chapter 3. Microneedle Drug Delivery Systems Market Variables, Trends & Scope
- 3.1. Market Lineage Outlook
- 3.2. Penetration & Growth Prospect Mapping
- 3.3. Value Chain Analysis
- 3.4. Regulatory Framework
- 3.5. Market Dynamics
- 3.5.1. Market driver analysis
- 3.5.2. Market restraint analysis
- 3.5.3. Industry opportunities & challenges
- 3.6. Microneedle Drug Delivery Systems Market Analysis Tools
- 3.6.1. Industry analysis - Porter's
- 3.6.1.1. Supplier power
- 3.6.1.2. Buyer power
- 3.6.1.3. Substitution threat
- 3.6.1.4. Threat of new entrant
- 3.6.1.5. Competitive rivalry
- 3.6.2. PESTEL analysis
- 3.6.2.1. Political landscape
- 3.6.2.2. Technological landscape
- 3.6.2.3. Economic landscape
- 3.6.2.4. Social landscape
- 3.6.2.5. Environmental landscape
- 3.6.2.6. Legal landscape
- 3.6.1. Industry analysis - Porter's
Chapter 4. Supplier Portfolio Analysis
- 4.1. List of Suppliers
- 4.2. Kraljic Matrix
- 4.3. Sourcing Best Practices
- 4.4. Negotiation Strategies
Chapter 5. Electrical Insulation Coatings: Product Estimates & Trend Analysis
- 5.1. Electrical Insulation Coatings Market: Key Takeaways
- 5.2. Electrical Insulation Coatings Market: Movement & Market Share Analysis, 2022 & 2030
- 5.3. Liquid
- 5.3.1. Liquid market estimates and forecasts, 2018 to 2030 (USD Million, Kilo Tons)
- 5.4. Powder
- 5.4.1. Powder market estimates and forecasts, 2018 to 2030 (USD Million, Kilo Tons)
Chapter 6. Electrical Insulation Coatings: Raw Material Estimates & Trend Analysis
- 6.1. Electrical Insulation Coatings Market: Key Takeaways
- 6.2. Electrical Insulation Coatings Market: Movement & Market Share Analysis, 2022 & 2030
- 6.3. Epoxy
- 6.3.1. Epoxy market estimates and forecasts, 2018 to 2030 (USD Million, Kilo Tons)
- 6.4. PTFE
- 6.4.1. PTFE market estimates and forecasts, 2018 to 2030 (USD Million, Kilo Tons)
- 6.5. Ceramic
- 6.5.1. Ceramic market estimates and forecasts, 2018 to 2030 (USD Million, Kilo Tons)
- 6.6. Others
- 6.6.1. Others market estimates and forecasts, 2018 to 2030 (USD Million, Kilo Tons)
Chapter 7. Electrical Insulation Coatings Market: Regional Estimates & Trend Analysis
- 7.1. Regional Outlook
- 7.2. Electrical Insulation Coatings Market by Region: Key Takeaway
- 7.3. North America
- 7.3.1. Market estimates and forecasts, 2018 - 2030 (Revenue, USD Million, Volume, Kilo Tons)
- 7.3.2. U.S.
- 7.3.2.1. Market estimates and forecasts, 2018 - 2030 (Revenue, USD Million, Volume, Kilo Tons)
- 7.3.3. Canada
- 7.3.3.1. Market estimates and forecasts, 2018 - 2030 (Revenue, USD Million, Volume, Kilo Tons)
- 7.3.4. Mexico
- 7.3.4.1. Market estimates and forecasts, 2018 - 2030 (Revenue, USD Million, Volume, Kilo Tons)
- 7.4. Europe
- 7.4.1. UK
- 7.4.1.1. Market estimates and forecasts, 2018 - 2030 (Revenue, USD Million, Volume, Kilo Tons)
- 7.4.2. Germany
- 7.4.2.1. Market estimates and forecasts, 2018 - 2030 (Revenue, USD Million, Volume, Kilo Tons)
- 7.4.3. France
- 7.4.3.1. Market estimates and forecasts, 2018 - 2030 (Revenue, USD Million, Volume, Kilo Tons)
- 7.4.4. Italy
- 7.4.4.1. Market estimates and forecasts, 2018 - 2030 (Revenue, USD Million, Volume, Kilo Tons)
- 7.4.5. Spain
- 7.4.5.1. Market estimates and forecasts, 2018 - 2030 (Revenue, USD Million, Volume, Kilo Tons)
- 7.4.6. Russia
- 7.4.6.1. Market estimates and forecasts, 2018 - 2030 (Revenue, USD Million, Volume, Kilo Tons)
- 7.4.1. UK
- 7.5. Asia Pacific
- 7.5.1. China
- 7.5.1.1. Market estimates and forecasts, 2018 - 2030 (Revenue, USD Million, Volume, Kilo Tons)
- 7.5.2. India
- 7.5.2.1. Market estimates and forecasts, 2018 - 2030 (Revenue, USD Million, Volume, Kilo Tons)
- 7.5.3. Japan
- 7.5.3.1. Market estimates and forecasts, 2018 - 2030 (Revenue, USD Million, Volume, Kilo Tons)
- 7.5.4. South Korea
- 7.5.4.1. Market estimates and forecasts, 2018 - 2030 (Revenue, USD Million, Volume, Kilo Tons)
- 7.5.1. China
- 7.6. Central and South America
- 7.6.1. Brazil
- 7.6.1.1. Market estimates and forecasts, 2018 - 2030 (Revenue, USD Million, Volume, Kilo Tons)
- 7.6.2. Argentina
- 7.6.2.1. Market estimates and forecasts, 2018 - 2030 (Revenue, USD Million, Volume, Kilo Tons)
- 7.6.1. Brazil
- 7.7. MEA
- 7.7.1. Saudi Arabia
- 7.7.1.1. Market estimates and forecasts, 2018 - 2030 (Revenue, USD Million, Volume, Kilo Tons)
- 7.7.2. South Africa
- 7.7.2.1. Market estimates and forecasts, 2018 - 2030 (Revenue, USD Million, Volume, Kilo Tons)
- 7.7.1. Saudi Arabia
Chapter 8. Competitive Landscape
- 8.1. Recent Developments & Impact Analysis, By Key Market Participants
- 8.2. Market Participant Categorization
- 8.2.1. Evonik Industries AG
- 8.2.1.1. Company overview
- 8.2.1.2. Financial performance
- 8.2.1.3. Product benchmarking
- 8.2.1.4. Strategic initiatives
- 8.2.2. 3M
- 8.2.2.1. Company overview
- 8.2.2.2. Financial performance
- 8.2.2.3. Product benchmarking
- 8.2.2.4. Strategic initiatives
- 8.2.3. PPG Industries, Inc.
- 8.2.3.1. Company overview
- 8.2.3.2. Financial performance
- 8.2.3.3. Product benchmarking
- 8.2.3.4. Strategic initiatives
- 8.2.4. Thermal Spray Coatings (A Fisher Barton Company)
- 8.2.4.1. Company overview
- 8.2.4.2. Financial performance
- 8.2.4.3. Product benchmarking
- 8.2.4.4. Strategic initiatives
- 8.2.5. GfE Gesellschaft fur Elektrometallurgie mbH
- 8.2.5.1. Company overview
- 8.2.5.2. Financial performance
- 8.2.5.3. Product benchmarking
- 8.2.5.4. Strategic initiatives
- 8.2.6. ELANTAS PDG, Inc.
- 8.2.6.1. Company overview
- 8.2.6.2. Financial performance
- 8.2.6.3. Product benchmarking
- 8.2.6.4. Strategic initiatives
- 8.2.7. GLS Coatings Ltd.
- 8.2.7.1. Company overview
- 8.2.7.2. Financial performance
- 8.2.7.3. Product benchmarking
- 8.2.7.4. Strategic initiatives
- 8.2.8. SK FORMULATIONS INDIA PVT. LTD.
- 8.2.8.1. Company overview
- 8.2.8.2. Financial performance
- 8.2.8.3. Product benchmarking
- 8.2.8.4. Strategic initiatives
- 8.2.9. PTFE Applied Coatings
- 8.2.9.1. Company overview
- 8.2.9.2. Financial performance
- 8.2.9.3. Product benchmarking
- 8.2.9.4. Strategic initiatives
- 8.2.10. Axalta Coating Systems, LLC
- 8.2.10.1. Company overview
- 8.2.10.2. Financial performance
- 8.2.10.3. Product benchmarking
- 8.2.10.4. Strategic initiatives
- 8.2.11. Akzo Nobel N.V.
- 8.2.11.1. Company overview
- 8.2.11.2. Financial performance
- 8.2.11.3. Product benchmarking
- 8.2.11.4. Strategic initiatives
- 8.2.1. Evonik Industries AG
