|
|
市場調査レポート
商品コード
1376249
シリコンフォトニクスの市場規模、シェア、動向分析レポート:コンポーネント別、製品別、用途別、地域別、セグメント予測、2023-2030年Silicon Photonics Market Size, Share & Trends Analysis Report By Component, By Product (Transceivers, Active Optical Cables, Optical Multiplexers, Optical Attenuators, Others), By Application, By Region, And Segment Forecasts, 2023 - 2030 |
||||||
|
|
|||||||
カスタマイズ可能
|
|||||||


| シリコンフォトニクスの市場規模、シェア、動向分析レポート:コンポーネント別、製品別、用途別、地域別、セグメント予測、2023-2030年 |
|
出版日: 2023年10月31日
発行: Grand View Research
ページ情報: 英文 100 Pages
納期: 2~10営業日
|

全表示
- 概要
- 図表
- 目次
シリコンフォトニクス市場の成長と動向:
Grand View Research, Inc.の新しいレポートによると、世界のシリコンフォトニクス市場規模は2030年に81億3,000万米ドルに達する見込みです。
同市場は、2023年から2030年にかけてCAGR 25.8%で拡大すると予測されています。商業用およびコンシューマーエレクトロニクス用途の急速な出現は、予測期間中に市場を変革すると予測されています。成長を促進する主な要因には、高速データ転送需要の増加やエネルギー効率の高い通信システムの必要性などがあります。シリコンフォトニクスは、高帯域幅、低消費電力、コンパクトサイズ、既存の半導体製造プロセスとの互換性などの利点を備えています。
データセンターは、高速でエネルギー効率に優れた相互接続を必要とするため、シリコンフォトニクス採用の大きな原動力となっています。シリコンフォトニクスは、サーバーやラック間のより高速で効率的なデータ伝送を可能にします。通信も主要な用途分野の1つで、シリコンフォトニクスは光ファイバーネットワークの性能を高めることができます。
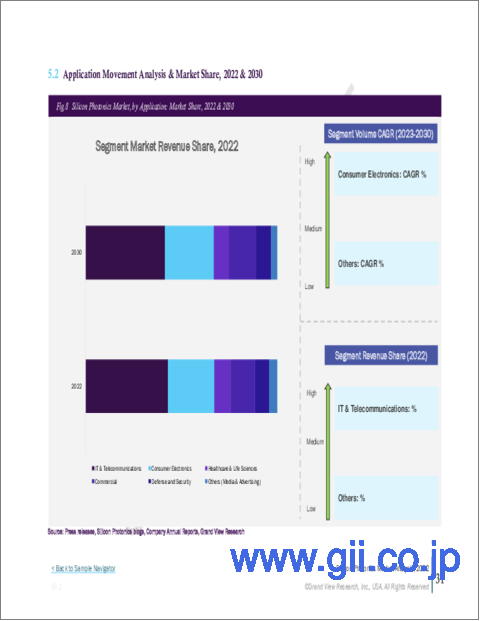
予測期間の市場規模では、IT・通信用途分野がこの分野を支配します。シリコンフォトニクスデバイスは、高性能コンピュータやデータセンター用途で商用用途を見出しています。ITと通信産業でシリコンフォトニクスの重要性が高まっており、高速データ伝送、エネルギー効率、スケーラビリティ、ネットワークパフォーマンスの向上が可能になります。これらの分野でのシリコンフォトニクスの採用は、最新の用途や技術で増大するデータ要件に対応できる高度な通信システムに対する需要の高まりが背景にあります。
シリコンフォトニクスに求められる理想的な特徴は、小型化とコスト効率であり、これがシリコンフォトニクス産業の成長を大きく後押ししています。ベンダーは、モバイルブロードバンドインターネットアクセス、ハイパフォーマンスコンピューティング、データセンター・企業ネットワーキング、メトロ・長距離データ通信など、幅広い産業にソリューションを提供しています。
同市場は、インテル、シスコ、IBM、メラノックステクノロジーズなど、半導体業界の大手企業が独占しています。しかし、シリコンフォトニクス技術の進歩に積極的に貢献している新興企業や研究機関もいくつかあります。1つのシリコンチップ上に様々な光コンポーネントを集積する改良に継続的に焦点が当てられています。この集積化には、レーザー、変調器、光検出器、導波路などが含まれます。集積度を高めることで、シリコンフォトニクスデバイスの小型化、低コスト化、性能向上が可能になります。
シリコンフォトニクス市場レポートハイライト
- シリコンフォトニクス製品は急速に普及し、業界は成長すると予測されています。これは、IT・通信、コンシューマーエレクトロニクス、商業用など、さまざまな用途分野に製品を組み込むことができるためです。
- アクティブ光ケーブル、光マルチプレクサー、光減衰器の需要増は、低コスト経済を実現するための大きな選択肢を提供するため、多くの成長機会をもたらしています。
- 北米がマーケットプレースを席巻しており、2030年には世界収益の最大シェアを占めると見られています。
- 主な業界参加者は、Cisco Systems Inc.、Finisar Corporation、Intel Corporation、Mellanox Technologies、Molex Incorporatedなど
目次
第1章 調査手法と範囲
第2章 エグゼクティブサマリー
第3章 シリコンフォトニクス市場の変数、動向、範囲
- 市場系統の見通し
- 用途のバリューチェーン分析
- 市場力学
- 市場促進要因分析
- 市場抑制要因分析
- 市場機会分析
- シリコンフォトニクス市場分析ツール
- 用途の分析- ポーターのファイブフォース分析
- PESTEL分析
第4章 シリコンフォトニクス市場:コンポーネントの推定・動向分析
- シリコンフォトニクス市場:重要なポイント
- シリコンフォトニクス市場:動向と市場シェア分析、2022年と2030年
- 光導波路
- 光変調器
- 光検出器
- 波長分割多重(WDM)フィルター
- レーザー
第5章 シリコンフォトニクス市場:製品の推定・動向分析
- シリコンフォトニクス市場:重要なポイント
- シリコンフォトニクス市場:動向と市場シェア分析、2022年と2030年
- トランシーバー
- アクティブ光ケーブル
- 光マルチプレクサー
- 光減衰器
- その他
第6章 シリコンフォトニクス市場:用途の推定・動向分析
- シリコンフォトニクス市場:重要なポイント
- シリコンフォトニクス市場:動向と市場シェア分析、2022年と2030年
- IT・通信
- コンシューマーエレクトロニクス
- ヘルスケア・ライフサイエンス
- 商業
- 防衛・セキュリティ
- その他
第7章 シリコンフォトニクス市場:地域の推定・動向分析
- 地域の展望
- 地域別のシリコンフォトニクス市場:重要なポイント
- 北米
- 市場推計・予測、2017年~2030年
- 米国
- カナダ
- 欧州
- 英国
- ドイツ
- フランス
- アジア太平洋地域
- 日本
- 中国
- インド
- オーストラリア
- 韓国
- ラテンアメリカ
- ブラジル
- メキシコ
- 中東・アフリカ
- サウジアラビア
- 南アフリカ
- アラブ首長国連邦
第8章 競合情勢
- 主要市場参入企業による最近の動向と影響分析
- 市場参入企業の分類
- Intel Corporation
- Cisco Systems, Inc.
- DAS Photonics
- Hamamatsu Photonics K.K.
- IBM Corporation
- STMicroelectronics N.V.
- Adtran Network
- Finisar Corporation
- Molex, LLC
- Mellanox Technologies (NVIDIA Corporation)
- Infinera Corporation
List of Tables
- Table 1 List of abbreviation
- Table 2 North America silicon photonics market, by component, 2017 - 2030 (USD Million)
- Table 3 North America silicon photonics market, by product, 2017 - 2030 (USD Million)
- Table 4 North America silicon photonics market, by application, 2017 - 2030 (USD Million)
- Table 5 North America silicon photonics market, by region, 2017 to 2030 (USD Million)
- Table 6 U.S. silicon photonics market, by component, 2017 - 2030 (USD Million)
- Table 7 U.S. silicon photonics market, by product, 2017 - 2030 (USD Million)
- Table 8 U.S. silicon photonics market, by application, 2017 - 2030 (USD Million)
- Table 9 Canada silicon photonics market, by component, 2017 - 2030 (USD Million)
- Table 10 Canada silicon photonics market, by product, 2017 - 2030 (USD Million)
- Table 11 Canada silicon photonics market, by application, 2017 - 2030 (USD Million)
- Table 12 Europe silicon photonics market, by component, 2017 - 2030 (USD Million)
- Table 13 Europe silicon photonics market, by product, 2017 - 2030 (USD Million)
- Table 14 Europe silicon photonics market, by application, 2017 - 2030 (USD Million)
- Table 15 Europe silicon photonics market, by region, 2017 to 2030 (USD Million)
- Table 16 Germany silicon photonics market, by component, 2017 - 2030 (USD Million)
- Table 17 Germany silicon photonics market, by product, 2017 - 2030 (USD Million)
- Table 18 Germany silicon photonics market, by application, 2017 - 2030 (USD Million)
- Table 19 UK silicon photonics market, by component, 2017 - 2030 (USD Million)
- Table 20 UK silicon photonics market, by product, 2017 - 2030 (USD Million)
- Table 21 UK silicon photonics market, by application, 2017 - 2030 (USD Million)
- Table 22 France silicon photonics market, by component, 2017 - 2030 (USD Million)
- Table 23 France silicon photonics market, by product, 2017 - 2030 (USD Million)
- Table 24 France silicon photonics market, by application, 2017 - 2030 (USD Million)
- Table 25 Asia Pacific silicon photonics market, by component, 2017 - 2030 (USD Million)
- Table 26 Asia Pacific silicon photonics market, by product, 2017 - 2030 (USD Million)
- Table 27 Asia Pacific silicon photonics market, by application, 2017 - 2030 (USD Million)
- Table 28 Asia Pacific silicon photonics market, by region, 2017 to 2030 (USD Million)
- Table 29 China silicon photonics market, by component, 2017 - 2030 (USD Million)
- Table 30 China silicon photonics market, by product, 2017 - 2030 (USD Million)
- Table 31 China silicon photonics market, by application, 2017 - 2030 (USD Million)
- Table 32 Japan silicon photonics market, by component, 2017 - 2030 (USD Million)
- Table 33 Japan silicon photonics market, by product, 2017 - 2030 (USD Million)
- Table 34 Japan silicon photonics market, by application, 2017 - 2030 (USD Million)
- Table 35 India silicon photonics market, by component, 2017 - 2030 (USD Million)
- Table 36 India silicon photonics market, by product, 2017 - 2030 (USD Million)
- Table 37 India silicon photonics market, by application, 2017 - 2030 (USD Million)
- Table 38 Australia silicon photonics market, by component, 2017 - 2030 (USD Million)
- Table 39 Australia silicon photonics market, by product, 2017 - 2030 (USD Million)
- Table 40 Australia silicon photonics market, by application, 2017 - 2030 (USD Million)
- Table 41 South Korea silicon photonics market, by component, 2017 - 2030 (USD Million)
- Table 42 South Korea silicon photonics market, by product, 2017 - 2030 (USD Million)
- Table 43 South Korea silicon photonics market, by application, 2017 - 2030 (USD Million)
- Table 44 Latin America silicon photonics market, by component, 2017 - 2030 (USD Million)
- Table 45 Latin America silicon photonics market, by product, 2017 - 2030 (USD Million)
- Table 46 Latin America silicon photonics market, by application, 2017 - 2030 (USD Million)
- Table 47 Latin America silicon photonics market, by region, 2017 to 2030 (USD Million)
- Table 48 Brazil silicon photonics market, by component, 2017 - 2030 (USD Million)
- Table 49 Brazil silicon photonics market, by product, 2017 - 2030 (USD Million)
- Table 50 Brazil silicon photonics market, by application, 2017 - 2030 (USD Million)
- Table 51 Mexico silicon photonics market, by component, 2017 - 2030 (USD Million)
- Table 52 Mexico silicon photonics market, by product, 2017 - 2030 (USD Million)
- Table 53 Mexico silicon photonics market, by application, 2017 - 2030 (USD Million)
- Table 54 Middle East and Africa (MEA) silicon photonics market, by component, 2017 - 2030 (USD Million)
- Table 55 Middle East and Africa (MEA)silicon photonics market, by product, 2017 - 2030 (USD Million)
- Table 56 Middle East and Africa (MEA)silicon photonics market, by application, 2017 - 2030 (USD Million)
- Table 57 Middle East and Africa (MEA)silicon photonics market, by region, 2017 to 2030 (USD Million)
- Table 58 South Africa silicon photonics market, by component, 2017 - 2030 (USD Million)
- Table 59 South Africa silicon photonics market, by product, 2017 - 2030 (USD Million)
- Table 60 South Africa silicon photonics market, by application, 2017 - 2030 (USD Million)
- Table 61 Saudi Arabia silicon photonics market, by component, 2017 - 2030 (USD Million)
- Table 62 Saudi Arabia silicon photonics market, by product, 2017 - 2030 (USD Million)
- Table 63 Saudi Arabia silicon photonics market, by application, 2017 - 2030 (USD Million)
- Table 64 United Arab Emirates (UAE) silicon photonics market, by component, 2017 - 2030 (USD Million)
- Table 65 United Arab Emirates (UAE) silicon photonics market, by product, 2017 - 2030 (USD Million)
- Table 66 United Arab Emirates (UAE) silicon photonics market, by application, 2017 - 2030 (USD Million)
List of Figures
- Fig. 1 Market research process
- Fig. 2 Data triangulation techniques
- Fig. 3 Primary research pattern
- Fig. 4 Market research approaches
- Fig. 5 Value-chain-based sizing & forecasting
- Fig. 6 QFD modeling for market share assessment
- Fig. 7 Market formulation & validation
- Fig. 8 Silicon photonics: Market outlook
- Fig. 9 Silicon photonics: Competitive insights
- Fig. 10 Parent market outlook
- Fig. 11 Related/ancillary market outlook
- Fig. 12 Penetration and growth prospect mapping
- Fig. 13 Application value chain analysis
- Fig. 14 Silicon photonics market driver impact
- Fig. 15 Silicon photonics market restraint impact
- Fig. 16 Silicon photonics market strategic initiatives analysis
- Fig. 17 Silicon photonics market: Component movement analysis
- Fig. 18 Silicon photonics market: Component outlook and key takeaways
- Fig. 19 Optical waveguides market estimates and forecasts, 2017 - 2030
- Fig. 20 Optical modulators market estimates and forecasts, 2017 - 2030
- Fig. 21 Photodetectors market estimates and forecasts, 2017 - 2030
- Fig. 22 Wavelength-Division Multiplexing (WDM) filters market estimates and forecasts, 2017 - 2030
- Fig. 23 Laser market estimates and forecasts, 2017 - 2030
- Fig. 24 Silicon photonics market: Product movement analysis
- Fig. 25 Silicon photonics market: Product outlook and key takeaways
- Fig. 26 Transceivers market estimates and forecasts, 2017 - 2030
- Fig. 27 Active optical cables market estimates and forecasts, 2017 - 2030
- Fig. 28 Optical multiplexers market estimates and forecasts, 2017 - 2030
- Fig. 29 Optical attenuators market estimates and forecasts, 2017 - 2030
- Fig. 30 Others market estimates and forecasts, 2017 - 2030
- Fig. 31 Silicon photonics market: Application movement analysis
- Fig. 32 Silicon photonics market: Application outlook and key takeaways
- Fig. 33 IT & telecommunications market estimates and forecasts, 2017 - 2030
- Fig. 34 Consumer electronics market estimates and forecasts, 2017 - 2030
- Fig. 35 Healthcare & life sciences market estimates and forecasts, 2017 - 2030
- Fig. 36 Commercial market estimates and forecasts, 2017 - 2030
- Fig. 37 Defense and security market estimates and forecasts, 2017 - 2030
- Fig. 38 Others market estimates and forecasts, 2017 - 2030
- Fig. 39 Global silicon photonics market: Regional movement analysis
- Fig. 40 Global silicon photonics market: Regional outlook and key takeaways
- Fig. 41 North America market estimates and forecasts, 2017 - 2030
- Fig. 42 U.S. market estimates and forecasts, 2017 - 2030
- Fig. 43 Canada market estimates and forecasts, 2017 - 2030
- Fig. 44 Europe market estimates and forecasts, 2017 - 2030
- Fig. 45 UK market estimates and forecasts, 2017 - 2030
- Fig. 46 Germany market estimates and forecasts, 2017 - 2030
- Fig. 47 France market estimates and forecasts, 2017 - 2030
- Fig. 48 Asia Pacific market estimates and forecasts, 2017 - 2030
- Fig. 49 Japan market estimates and forecasts, 2017 - 2030
- Fig. 50 China market estimates and forecasts, 2017 - 2030
- Fig. 51 India market estimates and forecasts, 2017 - 2030
- Fig. 52 Australia market estimates and forecasts, 2017 - 2030
- Fig. 53 South Korea market estimates and forecasts, 2017 - 2030
- Fig. 54 Latin America market estimates and forecasts, 2017 - 2030
- Fig. 55 Brazil market estimates and forecasts, 2017 - 2030
- Fig. 56 Mexico market estimates and forecasts, 2017 - 2030
- Fig. 57 Middle East and Africa market estimates and forecasts, 2017 - 2030
- Fig. 58 Saudi Arabia market estimates and forecasts, 2017 - 2030
- Fig. 59 South Africa market estimates and forecasts, 2017 - 2030
- Fig. 60 United Arab Emirates (UAE) market estimates and forecasts, 2017 - 2030
Silicon Photonics Market Growth & Trends:
The global silicon photonics market size is expected to reach USD 8.13 billion by 2030, according to a new report by Grand View Research, Inc.. The market is anticipated to expand at a CAGR of 25.8% from 2023 to 2030. The rapid emergence of commercial and consumer electronics applications is anticipated to revolutionize the market over the forecast period. Key factors driving the growth include the increasing demand for high-speed data transfer and the need for energy-efficient communication systems. Silicon photonics offers advantages such as high bandwidth, low power consumption, compact size, and compatibility with existing semiconductor manufacturing processes.
Data centers have been a major driver for the adoption of silicon photonics due to their need for high-speed and energy-efficient interconnects. Silicon photonics enables faster and more efficient data transmission between servers and racks. Telecommunications is another key application area, where silicon photonics can enhance the performance of fiber-optic networks.
The IT and telecommunication application segment would dominate the sector in terms of market size over the forecast period. Silicon photonics devices find commercial applications in high-performance computers and data center applications. The growing importance of silicon photonics in the IT and telecom industry, enables high-speed data transmission, energy efficiency, scalability, and improved network performance. The adoption of silicon photonics in the sectors is driven by the increasing demand for advanced communication systems that can handle the growing data requirements of modern applications and technologies.
Small size and cost-effectiveness are the ideal features desired from silicon photonics, which is largely driving the growth of the silicon photonics industry. Vendors provide solutions across a wide range of industries, such as mobile broadband Internet access, high-performance computing, data center and enterprise networking, and metro and long-haul data communications, among many others.
The market is dominated by major players in the semiconductor industry, including Intel, Cisco, IBM, and Mellanox Technologies. However, there are also several start-ups and research organizations actively contributing to the advancement of silicon photonics technology. There is a continuous focus on improving the integration of various optical components on a single silicon chip. This integration includes lasers, modulators, photodetectors, and waveguides. Achieving higher levels of integration enables smaller form factors, lower costs, and improved performance of silicon photonics devices.
Silicon Photonics Market Report Highlights:
- The industry is projected to grow as the products would rapidly gain traction. This is attributed to the ability of products to be incorporated into different application areas, such as IT and telecommunication, consumer electronics, and commercial
- The increasing demand for active optical cables, optical multiplexers, and optical attenuators provides numerous growth opportunities as they offer considerable options to attain low-cost economies
- North America dominated the marketplace and is expected to account for the largest share of global revenue in 2030
- The key industry participants include Cisco Systems Inc.; Finisar Corporation; Intel Corporation; Mellanox Technologies; and Molex Incorporated
Table of Contents
Chapter 1. Methodology and Scope
- 1.1. Market Segmentation & Scope
- 1.1.1. Component
- 1.1.2. Product
- 1.1.3. Application
- 1.1.4. Regional scope
- 1.1.5. Estimates and forecast timeline
- 1.2. Research Methodology
- 1.3. Information Procurement
- 1.3.1. Purchased database
- 1.3.2. GVR's internal database
- 1.3.3. Secondary sources
- 1.3.4. Primary research
- 1.3.5. Details of primary research
- 1.4. Information or Data Analysis
- 1.5. Market Formulation & Validation
- 1.6. Model Details
- 1.7. List of Secondary Sources
- 1.8. List of Primary Sources
- 1.9. Objectives
Chapter 2. Executive Summary
- 2.1. Market Outlook
- 2.2. Segment Outlook
- 2.2.1. Component outlook
- 2.2.2. Product outlook
- 2.2.3. Application outlook
- 2.2.4. Regional outlook
- 2.3. Competitive Insights
Chapter 3. Silicon Photonics Market Variables, Trends & Scope
- 3.1. Market Lineage Outlook
- 3.2. Application Value Chain Analysis
- 3.3. Market Dynamics
- 3.3.1. Market driver analysis
- 3.3.2. Market restraint analysis
- 3.3.3. Market opportunity analysis
- 3.4. Silicon Photonics Market Analysis Tools
- 3.4.1. Application analysis - Porter's
- 3.4.1.1. Supplier power
- 3.4.1.2. Buyer power
- 3.4.1.3. Substitution threat
- 3.4.1.4. Threat of new entrant
- 3.4.1.5. Competitive rivalry
- 3.4.2. PESTEL analysis
- 3.4.2.1. Political landscape
- 3.4.2.2. Technological landscape
- 3.4.2.3. Economic landscape
- 3.4.1. Application analysis - Porter's
Chapter 4. Silicon Photonics Market: Component Estimates & Trend Analysis
- 4.1. Silicon Photonics Market: Key Takeaways
- 4.2. Silicon Photonics Market: Movement & Market Share Analysis, 2022 & 2030
- 4.3. Optical Waveguides
- 4.3.1. Optical waveguides market estimates and forecasts, 2017 to 2030 (USD Million)
- 4.4. Optical Modulators
- 4.4.1. Optical modulators market estimates and forecasts, 2017 to 2030 (USD Million)
- 4.5. Photodetectors
- 4.5.1. Photodetectors market estimates and forecasts, 2017 to 2030 (USD Million)
- 4.6. Wavelength-Division Multiplexing (WDM) Filters
- 4.6.1. Wavelength-Division Multiplexing (WDM) filters market estimates and forecasts, 2017 to 2030 (USD Million)
- 4.7. Laser
- 4.7.1. Laser market estimates and forecasts, 2017 to 2030 (USD Million)
Chapter 5. Silicon Photonics Market: Product Estimates & Trend Analysis
- 5.1. Silicon Photonics Market: Key Takeaways
- 5.2. Silicon Photonics Market: Movement & Market Share Analysis, 2022 & 2030
- 5.3. Transceivers
- 5.3.1. Transceivers market estimates and forecasts, 2017 to 2030 (USD Million)
- 5.4. Active Optical Cables
- 5.4.1. Active optical cables market estimates and forecasts, 2017 to 2030 (USD Million)
- 5.5. Optical Multiplexers
- 5.5.1. Optical multiplexers market estimates and forecasts, 2017 to 2030 (USD Million)
- 5.6. Optical Attenuators
- 5.6.1. Optical attenuators market estimates and forecasts, 2017 to 2030 (USD Million)
- 5.7. Others
- 5.7.1. Others market estimates and forecasts, 2017 to 2030 (USD Million)
Chapter 6. Silicon Photonics Market: Application Estimates & Trend Analysis
- 6.1. Silicon Photonics Market: Key Takeaways
- 6.2. Silicon Photonics Market: Movement & Market Share Analysis, 2022 & 2030
- 6.3. IT & Telecommunications
- 6.3.1. IT & telecommunications market estimates and forecasts, 2017 to 2030 (USD Million)
- 6.4. Consumer Electronics
- 6.4.1. Consumer electronics market estimates and forecasts, 2017 to 2030 (USD Million)
- 6.5. Healthcare & Life Sciences
- 6.5.1. Healthcare & life sciences market estimates and forecasts, 2017 to 2030 (USD Million)
- 6.6. Commercial
- 6.6.1. Commercial market estimates and forecasts, 2017 to 2030 (USD Million)
- 6.7. Defense and Security
- 6.7.1. Defense and security market estimates and forecasts, 2017 to 2030 (USD Million)
- 6.8. Others
- 6.8.1. Others market estimates and forecasts, 2017 to 2030 (USD Million)
Chapter 7. Silicon Photonics Market: Regional Estimates & Trend Analysis
- 7.1. Regional Outlook
- 7.2. Silicon Photonics Market by Region: Key Takeaway
- 7.3. North America
- 7.3.1. Market estimates and forecasts, 2017 to 2030 (Revenue, USD Million)
- 7.3.2. U.S.
- 7.3.2.1. Market estimates and forecasts, 2017 to 2030 (Revenue, USD Million)
- 7.3.3. Canada
- 7.3.3.1. Market estimates and forecasts, 2017 to 2030 (Revenue, USD Million)
- 7.4. Europe
- 7.4.1. UK
- 7.4.1.1. Market estimates and forecasts, 2017 to 2030 (Revenue, USD Million)
- 7.4.2. Germany
- 7.4.2.1. Market estimates and forecasts, 2017 to 2030 (Revenue, USD Million)
- 7.4.3. France
- 7.4.3.1. Market estimates and forecasts, 2017 to 2030 (Revenue, USD Million)
- 7.4.1. UK
- 7.5. Asia Pacific
- 7.5.1. Japan
- 7.5.1.1. Market estimates and forecasts, 2017 to 2030 (Revenue, USD Million)
- 7.5.2. China
- 7.5.2.1. Market estimates and forecasts, 2017 to 2030 (Revenue, USD Million)
- 7.5.3. India
- 7.5.3.1. Market estimates and forecasts, 2017 to 2030 (Revenue, USD Million)
- 7.5.4. Australia
- 7.5.4.1. Market estimates and forecasts, 2017 to 2030 (Revenue, USD Million)
- 7.5.5. South Korea
- 7.5.5.1. Market estimates and forecasts, 2017 to 2030 (Revenue, USD Million)
- 7.5.1. Japan
- 7.6. Latin America
- 7.6.1. Brazil
- 7.6.1.1. Market estimates and forecasts, 2017 to 2030 (Revenue, USD Million)
- 7.6.2. Mexico
- 7.6.2.1. Market estimates and forecasts, 2017 to 2030 (Revenue, USD Million)
- 7.6.1. Brazil
- 7.7. MEA
- 7.7.1. Saudi Arabia
- 7.7.1.1. Market estimates and forecasts, 2017 to 2030 (Revenue, USD Million)
- 7.7.2. South Africa
- 7.7.2.1. Market estimates and forecasts, 2017 to 2030 (Revenue, USD Million)
- 7.7.3. United Arab Emirates (UAE)
- 7.7.3.1. Market estimates and forecasts, 2017 to 2030 (Revenue, USD Million)
- 7.7.1. Saudi Arabia
Chapter 8. Competitive Landscape
- 8.1. Recent Developments & Impact Analysis, By Key Market Participants
- 8.2. Market Participant Categorization
- 8.2.1. Intel Corporation
- 8.2.1.1. Company overview
- 8.2.1.2. Financial performance
- 8.2.1.3. Product benchmarking
- 8.2.1.4. Strategic initiatives
- 8.2.2. Cisco Systems, Inc.
- 8.2.2.1. Company overview
- 8.2.2.2. Financial performance
- 8.2.2.3. Product benchmarking
- 8.2.2.4. Strategic initiatives
- 8.2.3. DAS Photonics
- 8.2.3.1. Company overview
- 8.2.3.2. Financial performance
- 8.2.3.3. Product benchmarking
- 8.2.3.4. Strategic initiatives
- 8.2.4. Hamamatsu Photonics K.K.
- 8.2.4.1. Company overview
- 8.2.4.2. Financial performance
- 8.2.4.3. Product benchmarking
- 8.2.4.4. Strategic initiatives
- 8.2.5. IBM Corporation
- 8.2.5.1. Company overview
- 8.2.5.2. Financial performance
- 8.2.5.3. Product benchmarking
- 8.2.5.4. Strategic initiatives
- 8.2.6. STMicroelectronics N.V.
- 8.2.6.1. Company overview
- 8.2.6.2. Financial performance
- 8.2.6.3. Product benchmarking
- 8.2.6.4. Strategic initiatives
- 8.2.7. Adtran Network
- 8.2.7.1. Company overview
- 8.2.7.2. Financial performance
- 8.2.7.3. Product benchmarking
- 8.2.7.4. Strategic initiatives
- 8.2.8. Finisar Corporation
- 8.2.8.1. Company overview
- 8.2.8.2. Financial performance
- 8.2.8.3. Product benchmarking
- 8.2.8.4. Strategic initiatives
- 8.2.9. Molex, LLC
- 8.2.9.1. Company overview
- 8.2.9.2. Financial performance
- 8.2.9.3. Product benchmarking
- 8.2.9.4. Strategic initiatives
- 8.2.10. Mellanox Technologies (NVIDIA Corporation)
- 8.2.10.1. Company overview
- 8.2.10.2. Financial performance
- 8.2.10.3. Product benchmarking
- 8.2.10.4. Strategic initiatives
- 8.2.11. Infinera Corporation
- 8.2.11.1. Company overview
- 8.2.11.2. Financial performance
- 8.2.11.3. Product benchmarking
- 8.2.11.4. Strategic initiatives
- 8.2.1. Intel Corporation

