|
|
市場調査レポート
商品コード
1376237
光ファイバー用コネクターの市場規模、シェア、動向分析レポート:製品別、用途別、地域別、セグメント予測、2023年~2030年Fiber Optic Connector Market Size, Share & Trends Analysis Report By Product (SC Connector, LC Connector, FC Connector, ST Connector, MTP/MPO Connector), By Application, By Region, And Segment Forecasts, 2023 - 2030 |
||||||
|
|
|||||||
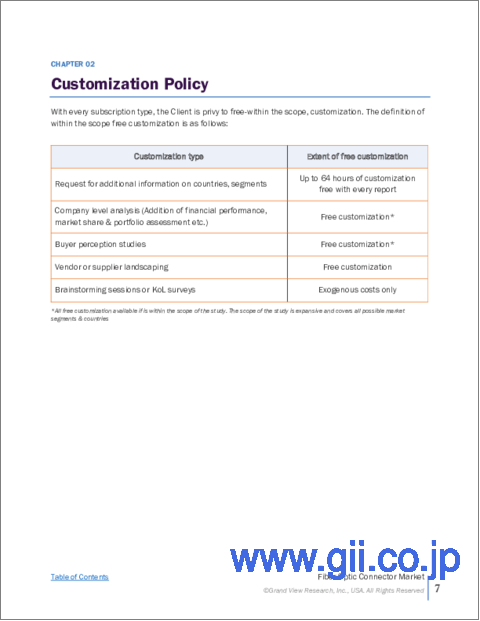
カスタマイズ可能
|
|||||||


| 光ファイバー用コネクターの市場規模、シェア、動向分析レポート:製品別、用途別、地域別、セグメント予測、2023年~2030年 |
|
出版日: 2023年10月30日
発行: Grand View Research
ページ情報: 英文 101 Pages
納期: 2~10営業日
|

- 全表示
- 概要
- 図表
- 目次
光ファイバー用コネクター市場の成長と動向:
Grand View Research, Inc.の最新レポートによると、世界の光ファイバー用コネクター市場規模は、2023年から2030年にかけてCAGR 5.9%を記録し、2030年には82億1,000万米ドルに達する見込みです。
光ファイバーセグメントは、予測期間中に大きく成長すると見られています。光ファイバー用コネクターは、ヘルスケア、鉄道、防衛・航空宇宙、石油・ガス分野の幅広い用途に組み込まれる大きな可能性を秘めています。
この技術は絶え間なく研究開発されており、大衆市場向けの低コスト用途や技術ソリューションの開発を目指しています。光ファイバー技術は、持続的な研究開発活動と高帯域幅の通信およびデータサービスからの需要の高まりにより、ここ数年で脚光を浴びるようになっています。
光ファイバー技術の普及が進むにつれ、メーカーやサプライヤーはより良い製品を開発するための研究開発に投資するようになっています。光ファイバー製品の製造と設置は非常に面倒でコストがかかるため、研究者は信頼性が高くコスト効率の高い光ファイバー製品の技術革新に注力しています。製造業者は、光ファイバー技術の他の選択肢を抑制するために、効率と価格を調整することによって、生産プロセスの最適化に努めています。
光ファイバー市場には、SCコネクター、LCコネクター、FCコネクター、STコネクター、MTPコネクターなど、さまざまな光ファイバー用コネクターが含まれます。光ファイバー用途に基づいて、市場は軍事・航空宇宙、石油・ガス、通信、医療、BFSI、鉄道、その他にセグメント化されます。通信部門は、収益面で最大の用途部門であり、政府やその他の関連規制当局が課す規制によって規制されています。
光ファイバー用コネクター市場レポートハイライト
- LCコネクターは、Cisco CatalystスイッチやHewlett Packard Pro Curveなどの高密度接続に使用されます。
- 通信セグメントは、2022年に42.5%の最大収益シェアを占めました。中国やインドなどの新興経済諸国における通信インフラの普及拡大は、同地域における技術の著しい成長に起因しています。
- 北米が市場を独占し、2022年に31.4%の最大収益シェアを占めました。
- 光ファイバー用コネクターの需要が伸びているのは、企業や通信事業者のネットワークで帯域幅の要件が増え続けているためです。
- 光ファイバー用コネクターは、主にフレキシブルバンドル、光伝導・照明、レーザーデリバリーシステムに展開されるため、医療業界全体でダイナミックな用途を見つけることができます。
目次
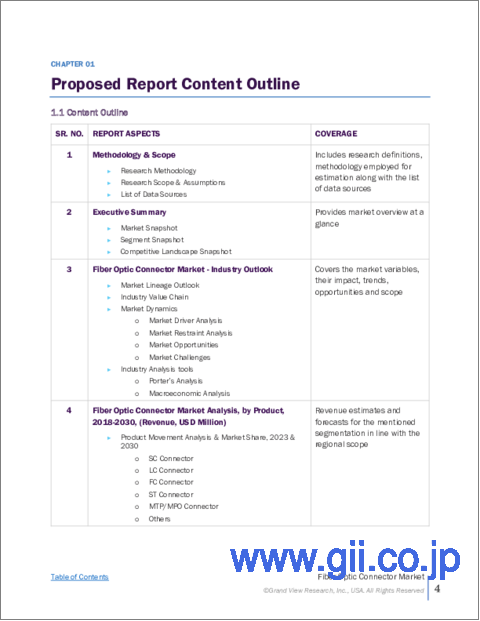
第1章 調査手法と範囲
第2章 エグゼクティブサマリー
第3章 光ファイバー用コネクター市場の変数、動向、範囲
- 市場系統の見通し
- 業界のバリューチェーン分析
- 市場力学
- 市場促進要因分析
- 市場抑制要因分析
- 市場機会分析
- 光ファイバー用コネクター市場分析ツール
- 業界分析- ポーターのファイブフォース分析
- PESTEL分析
第4章 光ファイバー用コネクター市場:製品の推定・動向分析
- 光ファイバー用コネクター市場:重要なポイント
- 光ファイバー用コネクター市場:動向と市場シェア分析、2022年および2030年
- SCコネクター
- LCコネクター
- FCコネクター
- STコネクター
- MTP/MPOコネクター
- その他
第5章 光ファイバー用コネクター市場:用途の推定・動向分析
- 光ファイバー用コネクター市場:重要なポイント
- 光ファイバー用コネクター市場:動向と市場シェア分析、2022年および2030年
- 通信
- 石油・ガス
- 軍事・航空宇宙
- BFSI
- 医療
- 鉄道
- その他
第6章 光ファイバー用コネクター市場:地域の推定・動向分析
- 地域の見通し
- 地域別の光ファイバー用コネクター市場:重要なポイント
- 北米
- 市場推計・予測、2017年から2030年まで
- 米国
- カナダ
- メキシコ
- 欧州
- 英国
- ドイツ
- フランス
- アジア太平洋地域
- 日本
- 中国
- インド
- オーストラリア
- 韓国
- 南米
- ブラジル
- 中東・アフリカ
- サウジアラビア
- 南アフリカ
- アラブ首長国連邦
第7章 競合情勢
- 主要市場参入企業による最近の動向と影響分析
- 市場参入企業の分類
- 3M
- Optical Cable Corporation
- STL Tech
- OFS Fitel, LLC
- Corning Incorporated
- ALE International, ALE USA Inc.
- Arris Group of Companies
- TE Connectivity
- FURUKAWA ELECTRIC CO., LTD.
List of Tables
- Table 1 List of abbreviation
- Table 2 North America fiber optic connector market, by product, 2017 - 2030 (USD Million)
- Table 3 North America fiber optic connector market, by application, 2017 - 2030 (USD Million)
- Table 4 North America fiber optic connector market, by region, 2017 to 2030 (USD Million)
- Table 5 U.S. fiber optic connector market, by product, 2017 - 2030 (USD Million)
- Table 6 U.S. fiber optic connector market, by application, 2017 - 2030 (USD Million)
- Table 7 Canada fiber optic connector market, by product, 2017 - 2030 (USD Million)
- Table 8 Canada fiber optic connector market, by application, 2017 - 2030 (USD Million)
- Table 9 Mexico fiber optic connector market, by product, 2017 - 2030 (USD Million)
- Table 10 Mexico fiber optic connector market, by application, 2017 - 2030 (USD Million)
- Table 11 Europe fiber optic connector market, by product, 2017 - 2030 (USD Million)
- Table 12 Europe fiber optic connector market, by application, 2017 - 2030 (USD Million)
- Table 13 Europe fiber optic connector market, by region, 2017 to 2030 (USD Million)
- Table 14 Germany fiber optic connector market, by product, 2017 - 2030 (USD Million)
- Table 15 Germany fiber optic connector market, by application, 2017 - 2030 (USD Million)
- Table 16 UK fiber optic connector market, by product, 2017 - 2030 (USD Million)
- Table 17 UK fiber optic connector market, by application, 2017 - 2030 (USD Million)
- Table 18 France fiber optic connector market, by product, 2017 - 2030 (USD Million)
- Table 19 France fiber optic connector market, by application, 2017 - 2030 (USD Million)
- Table 20 Asia Pacific fiber optic connector market, by product, 2017 - 2030 (USD Million)
- Table 21 Asia Pacific fiber optic connector market, by application, 2017 - 2030 (USD Million)
- Table 22 Asia Pacific fiber optic connector market, by region, 2017 to 2030 (USD Million)
- Table 23 China fiber optic connector market, by product, 2017 - 2030 (USD Million)
- Table 24 China fiber optic connector market, by application, 2017 - 2030 (USD Million)
- Table 25 Japan fiber optic connector market, by product, 2017 - 2030 (USD Million)
- Table 26 Japan fiber optic connector market, by application, 2017 - 2030 (USD Million)
- Table 27 India fiber optic connector market, by product, 2017 - 2030 (USD Million)
- Table 28 India fiber optic connector market, by application, 2017 - 2030 (USD Million)
- Table 29 Australia fiber optic connector market, by product, 2017 - 2030 (USD Million)
- Table 30 Australia fiber optic connector market, by application, 2017 - 2030 (USD Million)
- Table 31 South Korea fiber optic connector market, by product, 2017 - 2030 (USD Million)
- Table 32 South Korea fiber optic connector market, by application, 2017 - 2030 (USD Million)
- Table 33 South America fiber optic connector market, by product, 2017 - 2030 (USD Million)
- Table 34 South America fiber optic connector market, by application, 2017 - 2030 (USD Million)
- Table 35 South America fiber optic connector market, by region, 2017 to 2030 (USD Million)
- Table 36 Brazil fiber optic connector market, by product, 2017 - 2030 (USD Million)
- Table 37 Brazil fiber optic connector market, by application, 2017 - 2030 (USD Million)
- Table 38 Middle East and Africa fiber optic connector market, by product, 2017 - 2030 (USD Million)
- Table 39 Middle East and Africa fiber optic connector market, by application, 2017 - 2030 (USD Million)
- Table 40 Middle East and Africa fiber optic connector market, by region, 2017 to 2030 (USD Million)
- Table 41 South Africa fiber optic connector market, by product, 2017 - 2030 (USD Million)
- Table 42 South Africa fiber optic connector market, by application, 2017 - 2030 (USD Million)
- Table 43 Saudi Arabia fiber optic connector market, by product, 2017 - 2030 (USD Million)
- Table 44 Saudi Arabia fiber optic connector market, by application, 2017 - 2030 (USD Million)
- Table 45 UAE fiber optic connector market, by product, 2017 - 2030 (USD Million)
- Table 46 UAE fiber optic connector market, by application, 2017 - 2030 (USD Million)
List of Figures
- Fig. 1 Market research process
- Fig. 2 Data triangulation techniques
- Fig. 3 Primary research pattern
- Fig. 4 Market research approaches
- Fig. 5 Value-chain-based sizing & forecasting
- Fig. 6 QFD modeling for market share assessment
- Fig. 7 Market formulation & validation
- Fig. 8 Fiber optic connector market: Market outlook
- Fig. 9 Fiber optic connector market: Competitive insights
- Fig. 10 Parent market outlook
- Fig. 11 Related/ancillary market outlook
- Fig. 12 Penetration and growth prospect mapping
- Fig. 13 Industry value chain analysis
- Fig. 14 Fiber optic connector market driver impact
- Fig. 15 Fiber optic connector market restraint impact
- Fig. 16 Fiber optic connector market strategic initiatives analysis
- Fig. 17 Fiber optic connector market: Product movement analysis
- Fig. 18 Fiber optic connector market: Product outlook and key takeaways
- Fig. 19 SC connector market estimates and forecasts, 2017 - 2030
- Fig. 20 LC connector market estimates and forecasts, 2017 - 2030
- Fig. 21 FC connector market estimates and forecasts, 2017 - 2030
- Fig. 22 ST connector market estimates and forecasts, 2017 - 2030
- Fig. 23 MTP/MPO connector market estimates and forecasts, 2017 - 2030
- Fig. 24 Others market estimates and forecasts, 2017 - 2030
- Fig. 25 Fiber optic connector market: Application movement analysis
- Fig. 26 Fiber optic connector market: Application outlook and key takeaways
- Fig. 27 Telecom market estimates and forecasts, 2017 - 2030
- Fig. 28 Oil & gas market estimates and forecasts, 2017 - 2030
- Fig. 29 Military & aerospace market estimates and forecasts, 2017 - 2030
- Fig. 30 BFSI market estimates and forecasts, 2017 - 2030
- Fig. 31 Medical market estimates and forecasts, 2017 - 2030
- Fig. 32 Railway market estimates and forecasts, 2017 - 2030
- Fig. 33 Others market estimates and forecasts, 2017 - 2030
- Fig. 34 Global fiber optic connector market: Regional movement analysis
- Fig. 35 Global fiber optic connector market: Regional outlook and key takeaways
- Fig. 36 North America market estimates and forecasts, 2017 - 2030
- Fig. 37 U.S. market estimates and forecasts, 2017 - 2030
- Fig. 38 Canada market estimates and forecasts, 2017 - 2030
- Fig. 39 Mexico market estimates and forecasts, 2017 - 2030
- Fig. 40 Europe market estimates and forecasts, 2017 - 2030
- Fig. 41 UK market estimates and forecasts, 2017 - 2030
- Fig. 42 Germany market estimates and forecasts, 2017 - 2030
- Fig. 43 France market estimates and forecasts, 2017 - 2030
- Fig. 44 Asia Pacific market estimates and forecasts, 2017 - 2030
- Fig. 45 Japan market estimates and forecasts, 2017 - 2030
- Fig. 46 China market estimates and forecasts, 2017 - 2030
- Fig. 47 India market estimates and forecasts, 2017 - 2030
- Fig. 48 Australia market estimates and forecasts, 2017 - 2030
- Fig. 49 South Korea market estimates and forecasts, 2017 - 2030
- Fig. 50 South America market estimates and forecasts, 2017 - 2030
- Fig. 51 Brazil market estimates and forecasts, 2017 - 2030
- Fig. 52 Middle East and Africa market estimates and forecasts, 2017 - 2030
- Fig. 53 Saudi Arabia market estimates and forecasts, 2017 - 2030
- Fig. 54 South Africa market estimates and forecasts, 2017 - 2030
- Fig. 55 UAE market estimates and forecasts, 2017 - 2030
Fiber Optic Connector Market Growth & Trends:
The global fiber optic connector market size is expected to reach USD 8.21 billion by 2030, registering a CAGR of 5.9% from 2023 to 2030, according to a new report by Grand View Research, Inc.. The fiber optics segment is expected to grow, significantly, over the forecast period. Fiber optic connectors have huge potential to be incorporated into a wide range of applications in the healthcare, railway, defense & aerospace, and oil & gas sectors.
The technology is under constant R&D and aims to develop low-cost applications and technological solutions for the mass market. The fiber optic technology has gained prominence over the past few years, owing to the persistent research & development activities and the escalating demand from high bandwidth communication and data services.
The growing penetration of fiber optics technology is encouraging manufacturers and suppliers to invest in research & development for developing better products. Researchers are focusing on innovating reliable and cost-effective fiber optic products, as the production and installation of fiber optic products are quite tedious and costly. Manufacturers strive to optimize production processes, by regulating efficiency and prices, to curb other alternatives of the fiber optics technology.
The fiber optics market includes different fiber optic connectors such as SC connector, LC connector, FC connector, ST connector, MTP connector, and others. Based on fiber optic applications, the market is segmented into military & aerospace, oil & gas, telecom, medical, BFSI, railway, and others. The telecom sector is the biggest application sector, in terms of revenue, and is regulated by the regulations imposed by the government and other related regulatory authorities.
Fiber Optic Connector Market Report Highlights:
- The LC segment accounted for the largest revenue share of 36.7% in 2022.An LC connector is used in high-density connections such as Cisco Catalyst switches and Hewlett Packard Pro Curve.
- The telecom segment accounted for the largest revenue share of 42.5% in 2022.The growing penetration of telecommunication infrastructure in developing economies, such as China and India, is attributable to the significant growth of technology in the region.
- North America dominated the market and accounted for the largest revenue share of 31.4% in 2022.
- The growing demand for fiber optic connectors can be attributed to the ever-growing bandwidth requirements across enterprise and carrier networks
- Fiber optics connectors find dynamic applications across the medical industry, as they are mainly deployed in flexible bundling, light conduction & illumination, and laser delivery systems
Table of Contents
Chapter 1. Methodology and Scope
- 1.1. Market Segmentation & Scope
- 1.1.1. Product
- 1.1.2. Application
- 1.1.3. Regional scope
- 1.1.4. Estimates and forecast timeline
- 1.2. Research Methodology
- 1.3. Information Procurement
- 1.3.1. Purchased database
- 1.3.2. GVR's internal database
- 1.3.3. Secondary sources
- 1.3.4. Primary research
- 1.3.5. Details of primary research
- 1.4. Information or Data Analysis
- 1.5. Market Formulation & Validation
- 1.6. Model Details
- 1.7. List of Secondary Sources
- 1.8. List of Primary Sources
- 1.9. Objectives
Chapter 2. Executive Summary
- 2.1. Market Outlook
- 2.2. Segment Outlook
- 2.2.1. Product outlook
- 2.2.2. Application outlook
- 2.2.3. Regional outlook
- 2.3. Competitive Insights
Chapter 3. Fiber Optic Connector Market Variables, Trends & Scope
- 3.1. Market Lineage Outlook
- 3.2. Industry Value Chain Analysis
- 3.3. Market Dynamics
- 3.3.1. Market driver analysis
- 3.3.2. Market restraint analysis
- 3.3.3. Market opportunity analysis
- 3.4. Fiber Optic Connector Market Analysis Tools
- 3.4.1. Industry analysis - Porter's
- 3.4.1.1. Supplier power
- 3.4.1.2. Buyer power
- 3.4.1.3. Substitution threat
- 3.4.1.4. Threat of new entrant
- 3.4.1.5. Competitive rivalry
- 3.4.2. PESTEL analysis
- 3.4.2.1. Political landscape
- 3.4.2.2. Technological landscape
- 3.4.2.3. Economic landscape
- 3.4.1. Industry analysis - Porter's
Chapter 4. Fiber Optic Connector Market: Product Estimates & Trend Analysis
- 4.1. Fiber Optic Connector Market: Key Takeaways
- 4.2. Fiber Optic Connector Market: Movement & Market Share Analysis, 2022 & 2030
- 4.3. SC Connector
- 4.3.1. SC connector market estimates and forecasts, 2017 to 2030 (USD Million)
- 4.4. LC Connector
- 4.4.1. LC connector market estimates and forecasts, 2017 to 2030 (USD Million)
- 4.5. FC Connector
- 4.5.1. FC connector market estimates and forecasts, 2017 to 2030 (USD Million)
- 4.6. ST Connector
- 4.6.1. ST connector market estimates and forecasts, 2017 to 2030 (USD Million)
- 4.7. MTP/MPO Connector
- 4.7.1. MTP/MPO connector market estimates and forecasts, 2017 to 2030 (USD Million)
- 4.8. Others
- 4.8.1. Others market estimates and forecasts, 2017 to 2030 (USD Million)
Chapter 5. Fiber Optic Connector Market: Application Estimates & Trend Analysis
- 5.1. Fiber Optic Connector Market: Key Takeaways
- 5.2. Fiber Optic Connector Market: Movement & Market Share Analysis, 2022 & 2030
- 5.3. Telecom
- 5.3.1. Telecom market estimates and forecasts, 2017 to 2030 (USD Million)
- 5.4. Oil & Gas
- 5.4.1. Oil & gas delivery market estimates and forecasts, 2017 to 2030 (USD Million)
- 5.5. Military & Aerospace
- 5.5.1. Military & aerospace market estimates and forecasts, 2017 to 2030 (USD Million)
- 5.6. BFSI
- 5.6.1. BFSI market estimates and forecasts, 2017 to 2030 (USD Million)
- 5.7. Medical
- 5.7.1. Medical market estimates and forecasts, 2017 to 2030 (USD Million)
- 5.8. Railway
- 5.8.1. Railway market estimates and forecasts, 2017 to 2030 (USD Million)
- 5.9. Others
- 5.9.1. Others market estimates and forecasts, 2017 to 2030 (USD Million)
Chapter 6. Fiber Optic Connector Market: Regional Estimates & Trend Analysis
- 6.1. Regional Outlook
- 6.2. Fiber Optic Connector Market by Region: Key Takeaway
- 6.3. North America
- 6.3.1. Market estimates and forecasts, 2017 to 2030 (Revenue, USD Million)
- 6.3.2. U.S.
- 6.3.2.1. Market estimates and forecasts, 2017 to 2030 (Revenue, USD Million)
- 6.3.3. Canada
- 6.3.3.1. Market estimates and forecasts, 2017 to 2030 (Revenue, USD Million)
- 6.3.4. Mexico
- 6.3.4.1. Market estimates and forecasts, 2017 to 2030 (Revenue, USD Million)
- 6.4. Europe
- 6.4.1. UK
- 6.4.1.1. Market estimates and forecasts, 2017 to 2030 (Revenue, USD Million)
- 6.4.2. Germany
- 6.4.2.1. Market estimates and forecasts, 2017 to 2030 (Revenue, USD Million)
- 6.4.3. France
- 6.4.3.1. Market estimates and forecasts, 2017 to 2030 (Revenue, USD Million)
- 6.4.1. UK
- 6.5. Asia Pacific
- 6.5.1. Japan
- 6.5.1.1. Market estimates and forecasts, 2017 to 2030 (Revenue, USD Million)
- 6.5.2. China
- 6.5.2.1. Market estimates and forecasts, 2017 to 2030 (Revenue, USD Million)
- 6.5.3. India
- 6.5.3.1. Market estimates and forecasts, 2017 to 2030 (Revenue, USD Million)
- 6.5.4. Australia
- 6.5.4.1. Market estimates and forecasts, 2017 to 2030 (Revenue, USD Million)
- 6.5.5. South Korea
- 6.5.5.1. Market estimates and forecasts, 2017 to 2030 (Revenue, USD Million)
- 6.5.1. Japan
- 6.6. South America
- 6.6.1. Brazil
- 6.6.1.1. Market estimates and forecasts, 2017 to 2030 (Revenue, USD Million)
- 6.6.1. Brazil
- 6.7. MEA
- 6.7.1. Saudi Arabia
- 6.7.1.1. Market estimates and forecasts, 2017 to 2030 (Revenue, USD Million)
- 6.7.2. South Africa
- 6.7.2.1. Market estimates and forecasts, 2017 to 2030 (Revenue, USD Million)
- 6.7.3. UAE
- 6.7.3.1. Market estimates and forecasts, 2017 to 2030 (Revenue, USD Million)
- 6.7.1. Saudi Arabia
Chapter 7. Competitive Landscape
- 7.1. Recent Developments & Impact Analysis, By Key Market Participants
- 7.2. Market Participant Categorization
- 7.2.1. 3M
- 7.2.1.1. Company overview
- 7.2.1.2. Financial performance
- 7.2.1.3. Product benchmarking
- 7.2.1.4. Strategic initiatives
- 7.2.2. Optical Cable Corporation
- 7.2.2.1. Company overview
- 7.2.2.2. Financial performance
- 7.2.2.3. Product benchmarking
- 7.2.2.4. Strategic initiatives
- 7.2.3. STL Tech
- 7.2.3.1. Company overview
- 7.2.3.2. Financial performance
- 7.2.3.3. Product benchmarking
- 7.2.3.4. Strategic initiatives
- 7.2.4. OFS Fitel, LLC
- 7.2.4.1. Company overview
- 7.2.4.2. Financial performance
- 7.2.4.3. Product benchmarking
- 7.2.4.4. Strategic initiatives
- 7.2.5. Corning Incorporated
- 7.2.5.1. Company overview
- 7.2.5.2. Financial performance
- 7.2.5.3. Product benchmarking
- 7.2.5.4. Strategic initiatives
- 7.2.6. ALE International, ALE USA Inc.
- 7.2.6.1. Company overview
- 7.2.6.2. Financial performance
- 7.2.6.3. Product benchmarking
- 7.2.6.4. Strategic initiatives
- 7.2.7. Arris Group of Companies
- 7.2.7.1. Company overview
- 7.2.7.2. Financial performance
- 7.2.7.3. Product benchmarking
- 7.2.7.4. Strategic initiatives
- 7.2.8. TE Connectivity
- 7.2.8.1. Company overview
- 7.2.8.2. Financial performance
- 7.2.8.3. Product benchmarking
- 7.2.8.4. Strategic initiatives
- 7.2.9. FURUKAWA ELECTRIC CO., LTD.
- 7.2.9.1. Company overview
- 7.2.9.2. Financial performance
- 7.2.9.3. Product benchmarking
- 7.2.9.4. Strategic initiatives
- 7.2.1. 3M
