|
|
市場調査レポート
商品コード
1376199
ソーラーPVの米国市場規模、シェア、動向分析レポート:用途別、州別、セグメント別予測、2023~2030年U.S. Solar PV Market Size, Share & Trends Analysis Report By Application (Residential, Non-residential, Utility), By State, And Segment Forecasts, 2023 - 2030 |
||||||
|
|
|||||||
カスタマイズ可能
|
|||||||


| ソーラーPVの米国市場規模、シェア、動向分析レポート:用途別、州別、セグメント別予測、2023~2030年 |
|
出版日: 2023年10月25日
発行: Grand View Research
ページ情報: 英文 100 Pages
納期: 2~10営業日
|

- 全表示
- 概要
- 図表
- 目次
米国のソーラーPV市場の成長と動向
Grand View Research, Inc.の最新レポートによると、米国のソーラーPV市場規模は2030年までに966億米ドルに達し、2023年から2030年までのCAGRは13.7%で拡大すると予測されています。
ソーラーPVシステムの価格低下により、米国ではソーラーPVの導入が加速しています。政府のインセンティブやその他の融資オプションの増加が業界の成長を後押しすると予想されます。
米国政府は、従来のエネルギー源への依存を減らし、太陽光、風力、水素などの再生可能エネルギーの利用を増やすことを計画しています。政府は、大規模発電のためのユーティリティ規模のプロジェクトを建設してきました。
ユーティリティ部門は、地域社会全体に電力を供給する大規模な電力を発電します。米国政府は、ユーティリティ規模のソーラーPVプロジェクトへの投資を増やし、石炭やガスによる発電を段階的に廃止するため、多額の投資を行っています。多くの企業も、成長する市場を利用しようと、ユーティリティ規模のソーラーPVに投資し始めています。例えば、2022年4月、Primenergy社は米国最大のソーラーPV所の建設を発表しました。この発電所は2023年までに稼働する予定です。
米国でソーラーPVの需要が増加しているのは、ソーラーPVの価格が下がり、より現実的なものとなっているためです。カリフォルニア州、アリゾナ州、テキサス州など日射量の多い州は、投資回収期間が短いため高い成長が見込まれています。ニューヨーク州、ニュージャージー州、マサチューセッツ州などは、人口が集中し、ユーティリティプロジェクトに利用できる土地が比較的少ないため、住宅分野の成長が見込まれています。
業界各社は、ソーラーPVのコストを下げ、天然ガスや石炭といった従来の電源と競合できるようにするため、技術革新や技術進歩に注力しています。さらに市場参入企業は、合弁事業、パートナーシップ、M&Aなど、戦略的イニシアティブを重視し、今後数年間で足場を固めようとしています。
米国ソーラーPV市場レポート・ハイライト
- 2022年、ユーティリティ事業が66.68%の売上シェアで最大セグメントに浮上、これはユーティリティ事業が最も費用対効果が高く、政府や非公開会社からの投資も多いためです。
- テキサス州は、同州の日射係数が高いことから2021年には圧倒的な市場シェアを占めており、持続可能なエネルギーに対する需要の高まりが予測期間中の成長を後押しするとみられます。
- ニューメキシコ州は、同州における再生可能エネルギーの普及率が低いことが市場需要を押し上げ、同州の日照量が多いことから、予測期間中に大きなCAGRで成長すると推定・予測されます。
目次
第1章 調査手法と範囲
第2章 エグゼクティブサマリー
第3章 米国のソーラーPV市場の変数、動向、および範囲
- 市場系統の見通し
- 業界のバリューチェーン分析
- 技術概要
- 規制の枠組み
- 市場力学
- 市場促進要因の影響分析
- 市場抑制要因分析
- 市場機会分析
- 市場課題の分析
- 事業環境分析
- 業界分析- ポーターのファイブフォースモデル
- PESTLE分析-マクロ経済環境分析
- 市場参入戦略
- COVID-19のパンデミックが米国のソーラーPV市場に与える影響
第4章 米国のソーラーPV市場:製品の推定・動向分析
- 製品の変動分析と市場シェア、2022年と2030年
- 製品別
第5章 米国のソーラーPV市場:州の推定・動向分析
- 重要なポイント
- 州別
第6章 米国のソーラーPV市場:競合情勢
- 主要市場参入企業による最近の動向とその影響分析
- 原材料サプライヤー・チャネルパートナーのリスト
- 会社/競合の分類
- 潜在的顧客のリスト
- 企業の市場での位置付け
- 企業の市場シェア分析、2022年
- 企業ヒートマップ分析
- 競合ダッシュボード分析
- 戦略マッピング
- 会社一覧
List of Tables
- Table 1 List of Abbreviations
- Table 2 Recent Developments & Impact Analysis, By Key Market Participants
- Table 3 U.S. Solar PV Market Revenue Estimates and Forecast, By Product, 2018 - 2030 (USD Million)
- Table 4 U.S. Solar PV Market Revenue Estimates and Forecast, By State, 2018 - 2030 (USD Million)
- Table 5 Recent Developments & Their Impact Analysis, by Key Market Participants
- Table 6 Company Heat Map Analysis
- Table 7 Key companies involved in merger/acquisition
- Table 8 Key companies involved in product/technology launches
- Table 9 Key companies involved in agreement/partnership
- Table 10 Key companies involved in collaborations
- Table 11 Key companies undergoing expansions
List of Figures
- Fig. 1 Market Segmentation
- Fig. 2 Information Procurement
- Fig. 3 Primary Research Pattern
- Fig. 4 Primary Research Process
- Fig. 5 Market Research Approaches - Bottom-Up Approach
- Fig. 6 Market Research Approaches - Top-Down Approach
- Fig. 7 Market Research Approaches - Combined Approach
Fig. 8 U.S. Solar PV Market: Market Outlook (USD Million)
Fig. 9 U.S. Solar PV Market: Segmental Outlook (USD Million) (1/2)
Fig. 10 U.S. Solar PV Market: Segmental Outlook (USD Million) (2/2)
Fig. 11 U.S. Solar PV Market: Competitive Outlook (USD Million)
- Fig. 12 U.S. Solar PV Market: Value Chain Analysis
- Fig. 13 U.S. Solar PV Market Dynamics
- Fig. 14 U.S. Pharmaceutical Industry Revenue, 2018-2022 (USD Billion)
- Fig. 15 U.S. Solar PV Market - Porters Five Analysis
- Fig. 16 U.S. Solar PV Market- PESTLE Analysis
- Fig. 17 U.S. Solar PV Market, by Product: Key Takeaways
- Fig. 18 U.S. Solar PV Market, by Product: Market Share, 2022 & 2030
- Fig. 19 U.S. Solar PV Market Estimates & Forecasts, by Residential, 2018 - 2030 (USD Million)
- Fig. 20 U.S. Solar PV Market Estimates & Forecasts, by Non Residential, 2018 - 2030 (USD Million)
- Fig. 21 U.S. Solar PV Market Estimates & Forecasts, by Utility, 2018 - 2030 (USD Million)
- Fig. 22 U.S. Solar PV Market: Key Takeaways
- Fig. 23 California Cleanroom Film and Bags Market Estimates & Forecasts, 2018 - 2030 (USD Million)
- Fig. 24 Arizona Cleanroom Film and Bags Market Estimates & Forecasts, 2018 - 2030 (USD Million)
- Fig. 25 Hawaii Cleanroom Film and Bags Market Estimates & Forecasts, 2018 - 2030 (USD Million)
- Fig. 26 North Carolina Cleanroom Film and Bags Market Estimates & Forecasts, 2018 - 2030 (USD Million)
- Fig. 27 Nevada Cleanroom Film and Bags Market Estimates & Forecasts, 2018 - 2030 (USD Million)
- Fig. 28 South Carolina Cleanroom Film and Bags Market Estimates & Forecasts, 2018 - 2030 (USD Million)
- Fig. 29 Hawaii Cleanroom Film and Bags Market Estimates & Forecasts, 2018 - 2030 (USD Million)
- Fig. 30 Colorado Cleanroom Film and Bags Market Estimates & Forecasts, 2018 - 2030 (USD Million)
- Fig. 31 Texas Cleanroom Film and Bags Market Estimates & Forecasts, 2018 - 2030 (USD Million)
- Fig. 32 Florida Cleanroom Film and Bags Market Estimates & Forecasts, 2018 - 2030 (USD Million)
- Fig. 33 Georgia Cleanroom Film and Bags Market Estimates & Forecasts, 2018 - 2030 (USD Million)
- Fig. 34 Utah Cleanroom Film and Bags Market Estimates & Forecasts, 2018 - 2030 (USD Million)
- Fig. 35 Virginia Cleanroom Film and Bags Market Estimates & Forecasts, 2018 - 2030 (USD Million)
- Fig. 36 Maryland Cleanroom Film and Bags Market Estimates & Forecasts, 2018 - 2030 (USD Million)
- Fig. 37 New Mexico Cleanroom Film and Bags Market Estimates & Forecasts, 2018 - 2030 (USD Million)
- Fig. 38 Oregon Cleanroom Film and Bags Market Estimates & Forecasts, 2018 - 2030 (USD Million)
- Fig. 39 Indiana Cleanroom Film and Bags Market Estimates & Forecasts, 2018 - 2030 (USD Million)
- Fig. 40 Minnesota Cleanroom Film and Bags Market Estimates & Forecasts, 2018 - 2030 (USD Million)
- Fig. 41 Key Company Categorization
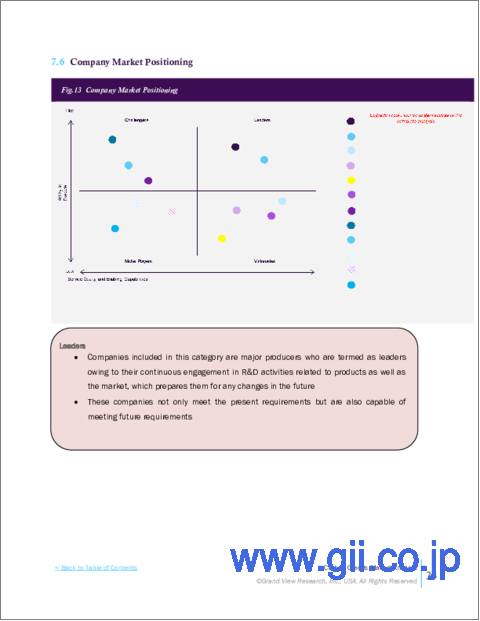
- Fig. 42 Company Market Positioning
- Fig. 43 Company Market Share Analysis, 2022
- Fig. 44 Company Heat Map Analysis
- Fig. 45 Competitive Dashboard Analysis
- Fig. 46 Strategy Mapping
U.S. Solar PV Market Growth & Trends:
The U.S. solar PV market size is expected to reach USD 96.6 billion by 2030, expanding at a CAGR of 13.7% from 2023 to 2030, according to a new report by Grand View Research, Inc.. Reducing prices of solar PV systems has accelerated the adoption of US solar photovoltaic (PV). An increase in government incentives and other financing options is expected to boost the industry's growth.
The U.S. government has planned to reduce the country's dependence on conventional energy sources and increase the use of renewable energy sources such as solar, wind, and hydrogen. The government has been constructing utility-scale projects for large-scale power generation.
The utility sector generates large-scale electricity to power entire communities. There have been high amounts of investment from the US government to invest more in utility-scale solar PV projects and phase out coal and gas power generation. Many companies have also started to invest in utility-scale solar to capitalize on the growing market. For instance, In April 2022, Primenergy announced the construction of the largest solar PV plant in the U.S. The project will be located in Nevada and will generate 690MW of electricity. The plant is expected to be operational by 2023.
The increasing demand for Solar PV in the country can be attributed to the decreasing prices of solar PV that are making them more viable. States with high irradiance such as California, Arizona, and Texas are expected to grow at a higher pace owing to the lower return of investment time frame. States such as New York, New Jersey, and Massachusetts are expected to witness growth in the residential segment owing to the higher concentration of people in these states and relatively lower land available for utility projects.
The industry players are focusing on innovation and technological advancements to reduce the cost of solar PV and to make it competitive with traditional power sources such as natural gas and coal. In addition, the market participants are emphasizing practicing several strategic initiatives such as joint ventures, partnerships, mergers & acquisitions, and others to gain a greater foothold in the forthcoming years.
U.S. Solar PV Market Report Highlights:
- In 2022, utility emerged as the largest segment with a revenue share of 66.68%, owing to the utility segment being the most cost-effective and higher investments from the government and private companies
- Texas held a dominant market in 2021 due to a higher irradiance factor of the state and the increasing demand for sustainable energy is expected to boost the growth during the forecast period
- New Mexico is estimated to grow at a significant CAGR over the forecast period owing to the lower penetration of renewable energy in the state boosting market demand and the high amount of sunlight in the state
Table of Contents
Chapter 1 Methodology and Scope
- 1.1 Research Methodology
- 1.1.1 Market Segmentation
- 1.1.2 Market Definitions
- 1.2 Research Methodology
- 1.3 Research Assumptions
- 1.4 Information Procurement
- 1.4.1 Purchased Database
- 1.4.2 GVR's Internal Database
- 1.4.3 Secondary Sources
- 1.4.4 Third Party Perspective
- 1.4.5 Primary Research
- 1.5 Information Analysis & Data Analysis Models
- 1.6 Market Formulation and Data Visualization
- 1.7 List of Data Sources
Chapter 2 Executive Summary
- 2.1 Market Outlook, 2022 (USD Million)
- 2.2 Segmental Outlook
- 2.3 Competitive Outlook
Chapter 3 U.S. Solar PV Market Variables, Trends, and Scope
- 3.1 Market Lineage Outlook
- 3.2 Industry Value Chain Analysis
- 3.3 Technology Overview
- 3.4 Regulatory framework
- 3.5 Market Dynamics
- 3.5.1 Market Driver Impact Analysis
- 3.5.1.1 Declining equipment costs
- 3.5.1.2 Technological advancements and innovation
- 3.5.1.3 Favorable regulations and policies
- 3.5.2 Market Restraint Analysis
- 3.5.2.1 Alternate energy sources
- 3.5.2.2 Higher per MW installation cost
- 3.5.3 Market Opportunities Analysis
- 3.5.4 Market Challenges Analysis
- 3.5.1 Market Driver Impact Analysis
- 3.6 Business Environment Analysis
- 3.6.1 Industry Analysis - Porter's Five Forces Model
- 3.6.2 PESTLE Analysis - Macro Economic Environment Analysis
- 3.7 Market Entry Strategies
- 3.8 Impact of COVID-19 Pandemic on U.S. Solar PV Market
Chapter 4 U.S. Solar PV Market: Product Estimates & Trend Analysis
- 4.1 Product Movement Analysis & Market Share, 2022 & 2030
- 4.2 U.S. Solar PV Market Estimates & Forecast, By Product (USD Million)
- 4.2.1 Residential
- 4.2.2 Non Residential
- 4.2.3 Utility
Chapter 5 U.S. Solar PV Market: States Estimates & Trend Analysis
- 5.1 Key Takeaways
- 5.2 U.S. Solar PV Market Estimates & Forecast, By State (USD Million)
- 5.2.1 California
- 5.2.2 Arizona
- 5.2.3 Hawaii
- 5.2.4 North Carolina
- 5.2.5 Nevada
- 5.2.6 South Carolina
- 5.2.7 Hawaii
- 5.2.8 Colorado
- 5.2.9 Texas
- 5.2.10 Florida
- 5.2.11 Georgia
- 5.2.12 Utah
- 5.2.13 Virginia
- 5.2.14 Maryland
- 5.2.15 New Mexico
- 5.2.16 Oregon
- 5.2.17 Indiana
- 5.2.18 Minnesota
Chapter 6 U.S. Solar PV Market: Competitive Landscape
- 6.1 Recent Developments & Their Impact Analysis, by Key Market Participants
- 6.2 List of Raw Material Suppliers and Channel Partners
- 6.3 Company/Competition Categorization
- 6.4 List Of Potential Customers
- 6.5 Company Market Positioning
- 6.6 Company Market Share Analysis, 2022
- 6.7 Company Heat Map Analysis
- 6.8 Competitive Dashboard Analysis
- 6.9 Strategy Mapping
- 6.9.1 Expansions
- 6.9.2 Mergers & acquisition
- 6.9.3 Collaborations
- 6.9.4 New product launches
- 6.9.5 Others
- 6.10 Company Listing
- 6.10.1 First Solar
- 6.10.2 SunPower
- 6.10.3 Suniva
- 6.10.4 Soltech
- 6.10.5 Sharp
- 6.10.6 Alps Technology
- 6.10.7 Advance power
- 6.10.8 Auxin solar
- 6.10.9 BORG Inc.
- 6.10.10 Pionis Energy
- 6.10.11 Participant's Overview
- 6.10.12 Financial Performance
- 6.10.13 Product Benchmarking
